EURCHF Bullish break-out signal above the 1W MA50.The EURCHF pair has rebounded on its 1.5-year Support Zone. A break above its 1W MA50 (blue trend-line) is a bullish break-out signal that would target Resistance 1 at 0.96650. That is where it can potentially make contact with the 1W MA200 (orange trend-line) for the first time since March 01 2021.
-------------------------------------------------------------------------------
** Please LIKE 👍, FOLLOW ✅, SHARE 🙌 and COMMENT ✍ if you enjoy this idea! Also share your ideas and charts in the comments section below! This is best way to keep it relevant, support us, keep the content here free and allow the idea to reach as many people as possible. **
-------------------------------------------------------------------------------
💸💸💸💸💸💸
👇 👇 👇 👇 👇 👇
Euro

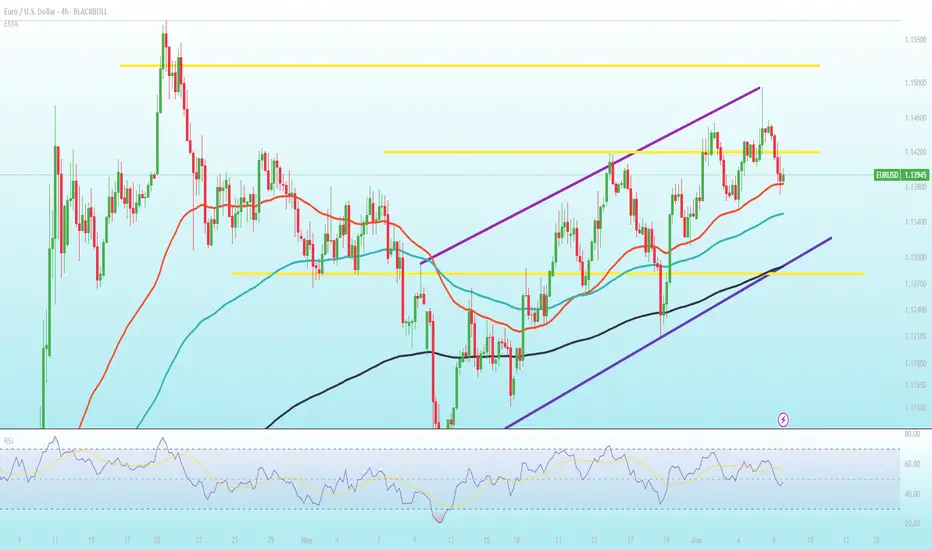
EURUSD Buy the next dip and target 1.17700The EURUSD pair has been trading within a Channel Up pattern and is currently on its 2nd Bullish Leg that hasn't yet been completed.
It does print an identical price action to the 1st Bullish Leg of the pattern, having already made its first pull-back near the 0.382 Fibonacci retracement level and is now rising for the 2nd rejection.
Our plan is to buy the next dip and target 1.17700, which is the -0.136 Fibonacci extension, the level where the 1st Bullish Leg topped.
-------------------------------------------------------------------------------
** Please LIKE 👍, FOLLOW ✅, SHARE 🙌 and COMMENT ✍ if you enjoy this idea! Also share your ideas and charts in the comments section below! This is best way to keep it relevant, support us, keep the content here free and allow the idea to reach as many people as possible. **
-------------------------------------------------------------------------------
Disclosure: I am part of Trade Nation's Influencer program and receive a monthly fee for using their TradingView charts in my analysis.
💸💸💸💸💸💸
👇 👇 👇 👇 👇 👇

Nato and EU meetings could lift EUR/USD further Despite believing the euro is currently overvalued, Bank of America prefers it to the US dollar, Swiss franc and Japanese yen.
Bank of America thinks the EUR could be supported leading up to the NATO and EU summits (June 24-27) especially if defense spending is confirmed. German infrastructure spending might also be expected to support the euro.
The EUR/USD holds above the 20- and 50-period EMAs at 1.1380–1.1360 and is comfortably above the 200-period EMA. The recent pull-back from 1.14930 has eased momentum slightly.
A close above 1.1420 could target 1.1470, then 1.1520. A sustained break below 1.1280 could neutralise the bullish bias.
Euro will correct a little and then continue to move up nextHello traders, I want share with you my opinion about Euro. Observing this chart, we can see how the price entered to upward channel, where it at once dropped from the resistance line to the support line and then started to grow. In a short time price rose to the 1.1210 level, broke it, and even rose a little more, but soon turned around and declined to the support line of the channel. Then the Euro made an upward impulse, and then broke the 1.1210 level one more time and continued to grow inside the channel. Later price reached the resistance line of the channel and then corrected, after which, in a short time rose to the support area, breaking the 1.1400 level. But soon the price turned around and dropped to the 1.1210 level, thereby exiting from channel. Next, Euro continued to grow inside the wedge, where it rose to the current support level and soon broke it. After this, the price rose to the resistance line of the wedge and then corrected, after which it made an upward impulse. Price exited from the wedge, and now I think that the Euro can make a correction, after the rise, and then continue to grow next. That's why I set my TP at 1.1560 points. Please share this idea with your friends and click Boost 🚀
Disclaimer: As part of ThinkMarkets’ Influencer Program, I am sponsored to share and publish their charts in my analysis.

EURCHF: Fierce consolidation prompts to a bullish breakoutEURCHF is neutral on its 1D technical outlook (RSI = 52.253, MACD = 0.000, ADX = 26.091) as it has been consolidating since the April 25th high. Since then it has failed to close a 1D candle above the 1D MA200. Given the strong presence of the S1 Zone, if we get that closing above the 1D MA200, we will turn bullish, aiming for the 0.618 Fibonacci retracement level (TP = 0.94900), like the March 14th high did.
## If you like our free content follow our profile to get more daily ideas. ##
## Comments and likes are greatly appreciated. ##

EURJPY Be ready to sell soon.Last time we looked at the EURJPY pair (February 26, see chart below), we gave a clear buy signal that wasted no time hitting straight our 162.250 Target:
With the Lower Highs trend-line now broken, a new pattern has emerged and that's a (blue) Channel Up. The current Bullish Leg is headed straight to the 8-month Resistance Zone, so we will be turning bearish there, targeting the 1D MA200 (orange trend-line) at 162.250.
-------------------------------------------------------------------------------
** Please LIKE 👍, FOLLOW ✅, SHARE 🙌 and COMMENT ✍ if you enjoy this idea! Also share your ideas and charts in the comments section below! This is best way to keep it relevant, support us, keep the content here free and allow the idea to reach as many people as possible. **
-------------------------------------------------------------------------------
💸💸💸💸💸💸
👇 👇 👇 👇 👇 👇

EURO-USD BUY STRONG 1. "EUR/USD Strong Buy Alert 🚀 | Key support zone holding firm – bulls eyeing the next leg up!"
2. "Strong Buy Zone ✅ | EUR/USD showing bullish momentum from this support level – eyes on 1.09+"
3. "EUR/USD Reversal Zone 💥 | Buyers stepping in strong – potential rally ahead!"
4. "Watch this zone! EUR/USD strong buy setup forming – bullish confirmation underway 📈"
5. "EUR/USD bouncing from key demand zone 🔥 | Technicals align for a strong buy signal!"

EURJPY: Well supported Channel Up aiming for 166.700.EURJPY is bullish on its 1D technical outlook (RSI = 58.535, MACD = 0.340, ADX = 24.438) and is staging right now a rebound on the 1D MA50. This comes only days after the 1D MA200 HL rebound tight at the bottom of the Channel Up. This is a great opportunity to buy and aim for the R1 level (TP = 166.700).
## If you like our free content follow our profile to get more daily ideas. ##
## Comments and likes are greatly appreciated. ##

EURUSD: Twin Channel Up structure aims for 1.14950.EURUSD is bullish on its 1D technical outlook (RSI = 59.016, MACD = 0.005, ADX = 22.852) as it maintains a bullish structure consisting of successive Channel Up patterns. We are currently on the 2nd, with the price supported by both the 30m MA50 and MA200. The 1st Channel Up peaked after a +1.29% rise. We remain bullish, aiming for a similar rise, TP = 1.14950.
See how our prior idea has worked out:
## If you like our free content follow our profile to get more daily ideas. ##
## Comments and likes are greatly appreciated. ##

EURCHF: The Most Predictable Soap Opera in ForexUnder 0.94 with low volume? You board that bus. Every. Single. Time.
CAPITALCOM:EURCHF
Since 2022, EURCHF has been playing the same tired but reliable rhythm.
Drop below 0.94, keep volume low, and boom, the bounce.
Not once. Not twice.
We've seen it repeat 48 times in 24 months!!!! Check the chart!
Let them discuss inflation, war, central banks, and macro theory all day.
Meanwhile, this pair is just running a predictable underground shuttle:
Tickets are issued quietly, below 0.94.
Entry is boring.
Exit? Clean profit....
Now, let’s talk politics. Because EURCHF is more than a chart
It’s a financial proxy war in slow motion.
On one side! The Eurozone, a union that behaves like a dysfunctional family reunion. Everyone talks. No one agrees.
The ECB? Too slow, too soft, too diplomatic. France wants spending. Germany wants austerity. Italy just wants to be invited.
On the other side: Switzerland.
A country that acts like the rich uncle who never comes to dinner but still gets the final say.
They don’t speak loudly, they just stack gold, flex the franc, and smile silently.
Neutral in politics, but never neutral in profit.
So every time the Euro wobbles, whether war in Ukraine, elections in France, or the ECB mumbling about rate cuts, the Swiss franc tightens its tie and appreciates quietly.
But here’s the punchline:
Eventually, the Euro shrugs it off.
It always does.
Maybe because the EU is too big to fail, or Switzerland can only push so far before exporters start screaming.
So what happens? EURCHF bounces. Every time.
Low volume under 0.94? That’s the market whispering to insiders.
We don’t need to guess.
We don’t need breaking news.
We just follow the same damn wave.
No reason to change strategy.
No reason to listen to noise.
It’s not about being smart, it’s about being consistent.
This isn’t trading. It’s public transportation.
And until that bus breaks down, we ride it.

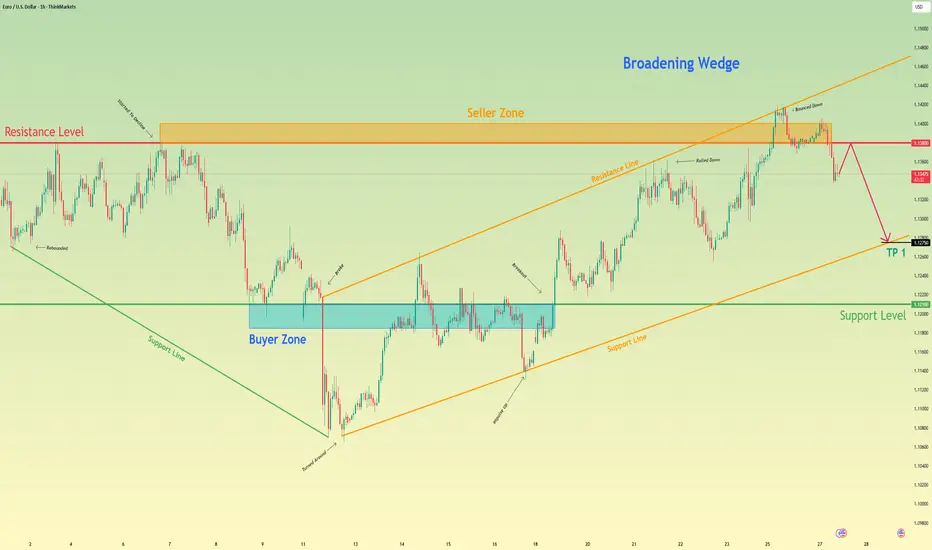
Euro will rise to seller zone and then drop to support lineHello traders, I want share with you my opinion about Euro. At first, price was moving inside a downward channel, forming lower highs and lower lows. Each rejection from the resistance line pushed the price lower, and the structure remained bearish until the price reached the buyer zone near 1.1210 - 1.1185 points. A strong rebound from this area triggered a breakout from the channel, signaling a shift in market dynamics. After this breakout, the trend reversed and price started forming an upward channel, with clean impulses and structured corrections. Bulls began stepping in from higher support levels, and the market started respecting the new rising support and resistance lines. Now the price is approaching the seller zone at 1.1435 - 1.1460 points and has already shown signs of rejection from that area. Given this setup, I believe EURUSD may start to decline and fall back toward the support line of the upward channel. That’s why I’ve placed my TP at 1.1325 points, which aligns with the channel's support structure. Please share this idea with your friends and click Boost 🚀
Disclaimer: As part of ThinkMarkets’ Influencer Program, I am sponsored to share and publish their charts in my analysis.

EURUSD Channel Up targeting 1.15000.The EURUSD pair just broke above the Resistance 1 level (1.14250) confirming the extension of the current Bullish Leg of the short-term Channel Up.
With their 4H RSI patterns very similar, the previous Bullish Leg rose by +2.58% before a pull-back to the 4H MA50 (blue trend-line). That gives us a potential Target of 1.15000 on the short-term.
-------------------------------------------------------------------------------
** Please LIKE 👍, FOLLOW ✅, SHARE 🙌 and COMMENT ✍ if you enjoy this idea! Also share your ideas and charts in the comments section below! This is best way to keep it relevant, support us, keep the content here free and allow the idea to reach as many people as possible. **
-------------------------------------------------------------------------------
Disclosure: I am part of Trade Nation's Influencer program and receive a monthly fee for using their TradingView charts in my analysis.
💸💸💸💸💸💸
👇 👇 👇 👇 👇 👇

SHORT ON EUR/USDEUR/USD has just swept a previous high and has plenty of liquidity to the downside to capture.
I will be selling EU to the next swing low looking to catch 80-100 pips.

EURUSD Forms Rising Wedge + Evening Star_ Bearish SetupAs I expected in the previous idea , the EURUSD ( FX:EURUSD ) started to rise after breaking the upper line of the descending channel and hit the Long Position target with Risk-To-Reward: 1.46 .
The EURUSD is trading near the Resistance zone($1.149-$1.142) .
From a Classic Technical perspective, EURUSD appears to be completing a Rising Wedge Reversal Pattern . Also, a good sign for a EURUSD reversal is the formation of an Evening Star Candlestick Pattern near the upper line of the rising wedge pattern.
Also, we can see the Regular Divergence(RD-) between Consecutive Peaks .
In terms of Elliott Wave theory , I think the EURUSD corrective waves are NOT over yet, and it seems that EURUSD has completed the main wave X inside the rising wedge pattern.
I expect EURUSD to decline to at least $1.126 AFTER breaking the lower line of the wedge pattern.
Note: If EURUSD touches $1.14903 , we can expect more pump.
Please respect each other's ideas and express them politely if you agree or disagree.
Euro/U.S. Dollar Analyze (EURUSD), 4-hour time frame.
Be sure to follow the updated ideas.
Do not forget to put a Stop loss for your positions (For every position you want to open).
Please follow your strategy and updates; this is just my Idea, and I will gladly see your ideas in this post.
Please do not forget the ✅' like '✅ button 🙏😊 & Share it with your friends; thanks, and Trade safe.

EURUSD: Detailed Support & Resistance Analysis For Next Week
Here is my latest structure analysis
and important supports and resistances for EURUSD
for next week.
Consider these structures for pullback/breakout trading.
❤️Please, support my work with like, thank you!❤️
I am part of Trade Nation's Influencer program and receive a monthly fee for using their TradingView charts in my analysis.

EURUSD Bull Flag and 1week Golden Cross pushing it higher.EURUSD is on a Bull Flag pattern and just completed a 1week Golden Cross.
The structure is identical to the last 1week Golden Cross on January 11th 2021, which was also formed at the end of a Bull Flag pattern.
That formation pushed the pair higher to complete a 2.0 Fibonacci extension Top.
Buy and target 1.1800.
Follow us, like the idea and leave a comment below!!

EUR/USD Technical Outlook (Read Caption)📈 EUR/USD Technical Outlook
🗓️ Date: May 28, 2025
🕒 Timeframe: Likely 4H
💵 Current Price: 1.13387
📍 Chart Zones & Market Structure
🟣 Support Zone (1.1280 – 1.1310)
🟢 Buyers Active!
✅ Strong demand visible with multiple bullish rejections (marked by green arrows).
🛡️ Market respects this zone – accumulation possible.
🧲 Acts as a springboard for upward moves.
🔴 Resistance Zone (1.1420 – 1.1450)
🔻 Sell Pressure High!
Repeated rejection at this level (red arrows 📉).
🚫 Strong resistance; previous highs couldn’t sustain.
⚠️ Price may pause or reverse here again.
📊 Price Action Pattern
📐 W-Pattern / Double Bottom Formation
The chart outlines a potential W-shaped recovery from support.
🔄 Suggests possible bullish reversal if neckline breaks around 1.1380.
🎯 Target post-breakout aligns with resistance zone (1.1420+).
🔮 Bullish Scenario (Blue Arrow)
💡 Plan: Break + Retest at 1.1380 = 🚀 Long Opportunity
📈 Target: 1.1420–1.1450 zone
📦 Entry confirmation: Bullish engulfing or strong breakout candle
🛑 SL: Below 1.1310
🧠 What to Watch
🔔 Key Economic Events Coming (🎯🇺🇸 & 🇪🇺 icons):
High volatility expected — align trades with fundamentals.
📅 News catalysts can validate or invalidate the technical setup.
🧭 Professional Tip
📌 "Structure first, signals second"
Let the price react at key zones before entering.
Patience + Reaction = Precision Trades 🧠📊
✅ Conclusion
The market is in a neutral-to-bullish phase, trading between well-defined support and resistance. With a clean structure forming and economic events lining up, it’s a great moment to stay alert, plan your entries, and execute only with clear confirmation. 🎯📉📈

EURGBP Megaphone bottom. Strong buy opportunity.The EURGBP pair is trading within a Bullish Megaphone since the start of the year. For the past 2 weeks it has been ranging within the 1D MA50 (blue trend-line) and 1D MA200 (orange trend-line).
This is technically the bottom formation of the pattern on its new Higher Low, as the 1D RSI has been printing the same sequence as February's which priced the previous Higher Low.
We are expecting at least a Resistance 1 test at 0.87400.
-------------------------------------------------------------------------------
** Please LIKE 👍, FOLLOW ✅, SHARE 🙌 and COMMENT ✍ if you enjoy this idea! Also share your ideas and charts in the comments section below! This is best way to keep it relevant, support us, keep the content here free and allow the idea to reach as many people as possible. **
-------------------------------------------------------------------------------
Disclosure: I am part of Trade Nation's Influencer program and receive a monthly fee for using their TradingView charts in my analysis.
💸💸💸💸💸💸
👇 👇 👇 👇 👇 👇

Euro can reach resistance line of pennant and then dropHello traders, I want share with you my opinion about Euro. The price of the Euro had been gradually declining, forming a series of lower highs and finding support around the 1.1070 - 1.1025 buyer zone. This pullback created the groundwork for a new structure to form as volatility narrowed and momentum shifted. After reaching a local bottom, the market rebounded and began constructing an upward pennant, a classic consolidation pattern that often precedes continuation or reversal, depending on breakout direction. Within this pennant, price respected both trendlines, each approach to the upper resistance was followed by a rejection, and each touch of the support line triggered a bounce. Now, the Euro is moving closer to the resistance line of the pennant once again. Given the overall structure, proximity to the 1.1415 resistance level, and prior reactions from the seller zone, I think the Euro can reach the top boundary and then continue to decline, potentially breaking below the pattern. That’s why I set my TP at 1.1150 points, targeting a move toward the support level and exit from the pennant. Please share this idea with your friends and click Boost 🚀
Disclaimer: As part of ThinkMarkets’ Influencer Program, I am sponsored to share and publish their charts in my analysis.

EURUSD: Bullish Megaphone unfolds its new bullish wave.EURUSD just turned bullish on its 1D technical outlook (RSI = 56.015, MACD = 0.004, ADX = 31.789) as it maintains a sustainable short term uptrend through a Bullish Megaphone pattern. The 1D MA50 has assumed the role of the medium term Support and the 3rd bullish wave is already under way. We expect it to repeat at least the previous +2.59% wave, having a TP = 1.14950.
## If you like our free content follow our profile to get more daily ideas. ##
## Comments and likes are greatly appreciated. ##

SHORT ON EUR/USDEUR/USD has pulled back to a major supply zone that previously formed a DOUBLE TOP in that area in the past. (This is technically the re-test)
I have placed a sell limit order in the supply area and I will be expecting EUR/USD to fall past the swing low for over 100 -150 pips.

Euro may grow to resistance level and then drop to 1.1275 pointsHello traders, I want share with you my opinion about Euro. After forming a strong upward move from the buyer zone (1.11850–1.1210), the price rose sharply, broke the mid-range resistance, and entered the seller zone between 1.1380 and 1.1400. Once it reached the upper boundary of the broadening wedge, the price bounced down from resistance at 1.1380. Now the price is trading inside a broadening wedge, showing signs of a potential reversal. After failing to hold above resistance, the Euro started to decline from the seller zone, confirming selling pressure. The current movement points to a correction within the wedge structure. I expect the Euro will continue falling toward 1.1275, my TP 1, where the support line of the wedge coincides with the upper boundary of the previous buyer zone. This zone has already shown strong reactions before and could act as a short-term reversal area. Given the recent rejection from resistance, the broadening wedge formation, and return from the seller zone, I remain bearish and anticipate further decline. Please share this idea with your friends and click Boost 🚀
Disclaimer: As part of ThinkMarkets’ Influencer Program, I am sponsored to share and publish their charts in my analysis.
eurusd 20 short-term market update short it exit 1160🏆 EURUSD Market Update m20 short-term trade
📊 Technical Outlook
🔸Short-term: BEARS 1160
🔸5 waves impulse completed
🔸1090/1240/1140/1350/1270/1410
🔸a/b/c/ correction 1160
🔸short sell and exit at 1160
🔸Price Target Bears: 1160
Key recent developments in EURUSD
📉 The U.S. dollar weakened as investors grew concerned over President Trump's proposed tax and spending bill, which could significantly increase the national debt
📈 The euro reached a one-month high after President Trump delayed the implementation of 50% tariffs on European Union imports, providing a temporary boost to investor confidence
🗣️ European Central Bank President Christine Lagarde suggested that the euro could become a global alternative to the U.S. dollar, contingent on strengthening the EU's financial and security infrastructure
📊 Technical analysis indicates that the EUR/USD pair may edge higher within a range of 1.1360 to 1.1420, though upward momentum is slowing
📉 Soft inflation data from France has increased selling pressure on the euro, as markets anticipate a stronger divergence between the Federal Reserve and the European Central Bank
📉 The EUR/USD pair is under bearish pressure, trading near 1.1350, as the U.S. dollar finds demand ahead of upcoming economic data and ongoing Senate tax debates
