Week 18 Analysis (29Apr) + Week 17 ReviewWelcome Fellow Traders!
Tech Analysis for the coming week + review of the current!
Usually takes about 15-20 mins, sharing as much as possible, Stay Tuned!
If you find the content useful to you, do follow me on trading view and give me a Rocket BOOST!
Euro

EURUSD will Attack to Support zone⚔️===>>(➡️RR=2.92)🏃♂️ EURUSD is moving in the 🟢 Support zone($1.0695-$1.0626) 🟢, but I expect it to be broken based on the explanation below 👇.
🌊According to the theory of Elliot waves , EURUSD seems to have completed the Double Three Correction(WXY ) in the 🟢 Support zone($1.0695-$1.0626) 🟢.
📈Regarding Classic Technical Analysis , EURUSD has successfully formed an Ascending Broadening Wedge Pattern Reversal Pattern .
💡Also, we can see Regular Divergence(RD-) between two Consecutive Peaks.
🔔I expect EURUSD to go DOWN at least to the lower line of the Ascending Broadening Wedge Pattern , and EURUSD will probably break the 🟢 Support zone($1.0695-$1.0626) 🟢.
--------------------------------------------------------------------------
EURUSD
🔴Position: Short
✅Entry Point: 1.06975 USD (Limit Order)
⛔️Stop Loss: 1.07420 USD
💰Take Profit:
💰Take Profit:
🎯1.06303 USD👉Risk-To-Reward: 1.51
🎯1.05674 USD👉Risk-To-Reward: 2.92
⚠️Please don't forget to follow capital management.
⚠️Please pay attention to the style of opening the position.
--------------------------------------------------------------------------
Euro/U.S.Dollar Analyze ( EURUSD), 1-hour Time frame ⏰.
Do not forget to put Stop loss for your positions (For every position you want to open).
Please follow your strategy; this is just my idea, and I will gladly see your ideas in this post.
Please do not forget the ✅' like '✅ button 🙏😊 & Share it with your friends; thanks, and Trade safe.

EURCAD - NEW BREAKOUT 📉Hello Traders !
On Thursday 25 April, The EURCAD Price Reached The Resistance Line and Failed To Break it !
The Last Higher Low is Broken (Change of Character).
So, I Expect a Bearish Move 📉.
-----------
TARGET: 1.45965🎯

EURJPY SHORTOANDA:EURJPY
The pair is extremely overbought also shows signs of divergence. A clear doubletop is forming. At the moment the price action is largely dependent on BoJ decision, but it seems that it is ready to support the Yen. The trade is risky, but the reward is considerable.

Strifor || EURUSD-26/04/2024Preferred direction: BUY
Comment: All previous trading ideas for the euro were closed with profit. For now, it's best to wait until next week, but we're already highlighting the two most likely scenarios. The euro remains bullish and there is short-term growth potential. In addition, there are assumptions regarding the level of 1.09000. and even 1.09500 , where the price may be heading. But these are just thoughts and rumors for now.
There are two most likely scenarios in front of you; there is a possibility that today the price will record its presence near 1.08000.
Additional comments on this trade will be provided as situation changes. Follow us!
Thank you for like and share your views!

EUR/USD Update: Assessing Bullish Momentum and Risk FactorsAs the new trading week kicks off, the EUR/USD pair finds itself in a sideways movement, hovering around the 1.0660 mark. Last week, market participants witnessed a potential bullish momentum, sparked by several technical signals indicating a shift in sentiment.
One notable signal was the recognition of a bullish impulse originating from the 78.6% Fibonacci retracement levels, coupled with oversold conditions observed in stochastic indicators. This convergence of technical indicators often suggests a potential reversal or continuation of a trend. Adding to the bullish case, a Gartley formation and divergence patterns were also identified, further bolstering the optimism among traders.
However, amidst these technical signals, the absence of significant economic data releases leaves the pair vulnerable to fluctuations in risk sentiment. The valuation of the US Dollar (USD) could be influenced by market perception of risk, particularly as traders await key economic indicators scheduled for release later in the week.
Tomorrow's agenda includes crucial economic data from the United States, notably the Flash Manufacturing PMI, Flash Services PMI, New Home Sales, and the Richmond Manufacturing Index. These releases have the potential to sway market sentiment and dictate the direction of the USD.
Furthermore, the performance of US stock index futures provides insights into market sentiment. Futures indicate a positive opening for Wall Street, with gains ranging between 0.3% and 0.5%. A continuation of this positive momentum on Wall Street could exert downward pressure on the USD, consequently supporting further upside potential for the EUR/USD pair.
Beyond economic data releases, market participants will also keep an eye on developments in Europe. The European Commission is set to release preliminary Consumer Confidence data for April, offering insights into the sentiment among European consumers. Additionally, European Central Bank (ECB) President Christine Lagarde is scheduled to deliver a speech during American trading hours, potentially providing clues about the ECB's monetary policy stance and its impact on the Euro.
In conclusion, the EUR/USD pair navigates a consolidation phase near 1.0660, buoyed by technical signals indicating a possible bullish reversal. However, the pair remains sensitive to shifts in risk sentiment and awaits crucial economic data releases to determine its next directional move. With eyes on both sides of the Atlantic, traders brace themselves for a week filled with potential market-moving events.

EUR/NZD H4 | Potential bullish reversal off overlap supportEUR/NZD is falling towards an overlap support and could potentially bounce off this level to climb higher.
Buy entry is at 1.7978 which is an overlap support that lies above the 61.8% Fibonacci retracement level.
Stop loss is at 1.7830 which is a level that lies underneath a pullback support.
Take profit is at 1.8134 which is a pullback resistance.
High Risk Investment Warning
Trading Forex/CFDs on margin carries a high level of risk and may not be suitable for all investors. Leverage can work against you.
Stratos Markets Limited (www.fxcm.com):
CFDs are complex instruments and come with a high risk of losing money rapidly due to leverage. 66% of retail investor accounts lose money when trading CFDs with this provider. You should consider whether you understand how CFDs work and whether you can afford to take the high risk of losing your money.
Stratos Europe Ltd, previously FXCM EU Ltd (www.fxcm.com):
CFDs are complex instruments and come with a high risk of losing money rapidly due to leverage. 70% of retail investor accounts lose money when trading CFDs with this provider. You should consider whether you understand how CFDs work and whether you can afford to take the high risk of losing your money.
Stratos Trading Pty. Limited (www.fxcm.com):
Trading FX/CFDs carries significant risks. FXCM AU (AFSL 309763), please read the Financial Services Guide, Product Disclosure Statement, Target Market Determination and Terms of Business at www.fxcm.com
Stratos Global LLC (www.fxcm.com):
Losses can exceed deposits.
Please be advised that the information presented on TradingView is provided to FXCM (‘Company’, ‘we’) by a third-party provider (‘TFA Global Pte Ltd’). Please be reminded that you are solely responsible for the trading decisions on your account. There is a very high degree of risk involved in trading. Any information and/or content is intended entirely for research, educational and informational purposes only and does not constitute investment or consultation advice or investment strategy. The information is not tailored to the investment needs of any specific person and therefore does not involve a consideration of any of the investment objectives, financial situation or needs of any viewer that may receive it. Kindly also note that past performance is not a reliable indicator of future results. Actual results may differ materially from those anticipated in forward-looking or past performance statements. We assume no liability as to the accuracy or completeness of any of the information and/or content provided herein and the Company cannot be held responsible for any omission, mistake nor for any loss or damage including without limitation to any loss of profit which may arise from reliance on any information supplied by TFA Global Pte Ltd.
The speaker(s) is neither an employee, agent nor representative of FXCM and is therefore acting independently. The opinions given are their own, constitute general market commentary, and do not constitute the opinion or advice of FXCM or any form of personal or investment advice. FXCM neither endorses nor guarantees offerings of third-party speakers, nor is FXCM responsible for the content, veracity or opinions of third-party speakers, presenters or participants.

EURUSD: Important Decision Ahead 🇪🇺🇺🇸
Technical analysis of EURUSD ahead of important US Fundamentals.
Price action, key levels analysis.
Potential scenarios.
Trading recommendations.
❤️Please, support my work with like, thank you!❤️

EURGBP - Short Trade IdeaThis is a short idea I have, and most likely it will come to fruition. We have a good liquidity pool taken out with a great reversal displacement. We also have a great draw on liquidity for the buyside.
See here for my analysis on the Daily timeframe.
Refer to my notes within the screenshots for context.
Happy trading!
- R2F

EURJPY - Important Breakout 🚀Hello Traders !
On The Daily Time Frame, The EURJPY Price Formed a Rectangle Pattern.
Presently, The Resistance Level is Broken !
So, I Expect a Bullish Move 📈
-------------
TARGET: 166.430🎯

EUR/CAD H4 | Bearish downtrendEUR/CAD is rising towards a resistance zone that is bounded by the descending trendline and Fibonacci retracement levels. It could potentially reverse off this zone to drop lower.
Sell entry is between 1.4650 and 1.4655 which is a resistance zone that is bounded by the descending trendline and Fibonacci retracements at 38.2% and 50.0% levels.
Stop loss is at 1.4690 which is a level that sits above a Fibonacci confluence (the 50% and 61.8% retracement levels) and a pullback resistance.
Take profit is at 1.4579 which is a pullback support.
High Risk Investment Warning
Trading Forex/CFDs on margin carries a high level of risk and may not be suitable for all investors. Leverage can work against you.
Stratos Markets Limited (www.fxcm.com):
CFDs are complex instruments and come with a high risk of losing money rapidly due to leverage. 66% of retail investor accounts lose money when trading CFDs with this provider. You should consider whether you understand how CFDs work and whether you can afford to take the high risk of losing your money.
Stratos Europe Ltd, previously FXCM EU Ltd (www.fxcm.com):
CFDs are complex instruments and come with a high risk of losing money rapidly due to leverage. 70% of retail investor accounts lose money when trading CFDs with this provider. You should consider whether you understand how CFDs work and whether you can afford to take the high risk of losing your money.
Stratos Trading Pty. Limited (www.fxcm.com):
Trading FX/CFDs carries significant risks. FXCM AU (AFSL 309763), please read the Financial Services Guide, Product Disclosure Statement, Target Market Determination and Terms of Business at www.fxcm.com
Stratos Global LLC (www.fxcm.com):
Losses can exceed deposits.
Please be advised that the information presented on TradingView is provided to FXCM (‘Company’, ‘we’) by a third-party provider (‘TFA Global Pte Ltd’). Please be reminded that you are solely responsible for the trading decisions on your account. There is a very high degree of risk involved in trading. Any information and/or content is intended entirely for research, educational and informational purposes only and does not constitute investment or consultation advice or investment strategy. The information is not tailored to the investment needs of any specific person and therefore does not involve a consideration of any of the investment objectives, financial situation or needs of any viewer that may receive it. Kindly also note that past performance is not a reliable indicator of future results. Actual results may differ materially from those anticipated in forward-looking or past performance statements. We assume no liability as to the accuracy or completeness of any of the information and/or content provided herein and the Company cannot be held responsible for any omission, mistake nor for any loss or damage including without limitation to any loss of profit which may arise from reliance on any information supplied by TFA Global Pte Ltd.
The speaker(s) is neither an employee, agent nor representative of FXCM and is therefore acting independently. The opinions given are their own, constitute general market commentary, and do not constitute the opinion or advice of FXCM or any form of personal or investment advice. FXCM neither endorses nor guarantees offerings of third-party speakers, nor is FXCM responsible for the content, veracity or opinions of third-party speakers, presenters or participants.

EURAUD: Rejection at the top of the Channel Down.EURAUD has turned marginally bearish on its 1D technical outlook (RSI = 44.934, MACD = 0.000, ADX = 23.651) and dropped under the 1D MA50 and 1D MA200. This happened at the top of the Channel Down. We turn bearish, aiming at a symmetric LH wave of -4.31% (TP = 1.60250).
## If you like our free content follow our profile to get more daily ideas. ##
## Comments and likes are greatly appreciated. ##

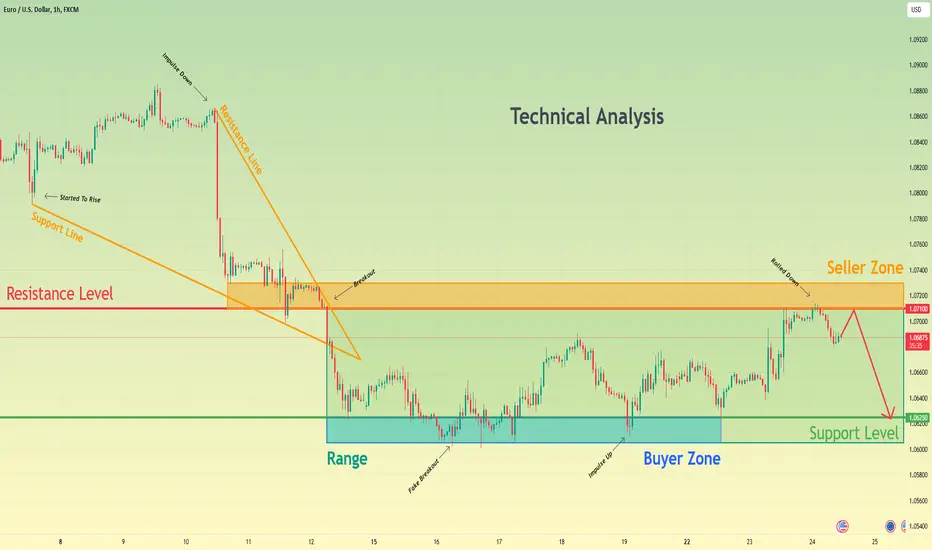
Euro can rebound from resistance level and continue to fallHello traders, I want share with you my opinion about Euro. By observing the chart, we can see that the price started to trades in a wedge, where it at once started to rise from the support line to the resistance line. After the price reached this line, at once turned around and made a strong impulse down to the 1.0710 resistance level, which coincided with the seller zone. Soon, the price broke this level and exited from the wedge too, after which the Euro started to trades inside from range. In the range, the price first made a fake breakout of 1.0625 support level, which coincided with the buyer zone, after which it tried to rise, but later EUR declined to the buyer zone back. After this movement, the price turned around and in a short time rose to a resistance level, but recently it rolled down and now trades close. So, at the moment, I think that the Euro can reach the resistance level again and then rebound down to the support level. For this reason, I set my target at the 1.0625 level. Please share this idea with your friends and click Boost 🚀
Strifor || EURUSD-Week StartingPreferred direction: BUY
Comment: After a busy weekend, the market is coming to its senses. There was no downward gap in the euro due to the worsening geopolitical situation in the Middle East. Short-term bearish sentiment remains, but a potential recovery can be expected within this week.
Growth is expected towards the level of 1.08000 . Two scenarios are considered, and the main one assumes growth after a slight update of the current local minimum (Scenario №1) . A more aggressive seller scenario (Scenario №2) involves buying around the level of 1.05500.
Additional comments on this trade will be provided as situation changes. Follow us!
Thank you for like and share your views!

EUR/AUD H1 | Potential bearish reversalEUR/AUD is rising towards an overlap resistance and could potentially reverse off this level to drop lower.
Sell entry is at 1.6519 which is an overlap resistance.
Stop loss is at 1.6555 which is a level that sits above a pullback resistance.
Take profit is at 1.6476 which is an overlap support.
High Risk Investment Warning
Trading Forex/CFDs on margin carries a high level of risk and may not be suitable for all investors. Leverage can work against you.
Stratos Markets Limited (www.fxcm.com):
CFDs are complex instruments and come with a high risk of losing money rapidly due to leverage. 66% of retail investor accounts lose money when trading CFDs with this provider. You should consider whether you understand how CFDs work and whether you can afford to take the high risk of losing your money.
Stratos Europe Ltd, previously FXCM EU Ltd (www.fxcm.com):
CFDs are complex instruments and come with a high risk of losing money rapidly due to leverage. 70% of retail investor accounts lose money when trading CFDs with this provider. You should consider whether you understand how CFDs work and whether you can afford to take the high risk of losing your money.
Stratos Trading Pty. Limited (www.fxcm.com):
Trading FX/CFDs carries significant risks. FXCM AU (AFSL 309763), please read the Financial Services Guide, Product Disclosure Statement, Target Market Determination and Terms of Business at www.fxcm.com
Stratos Global LLC (www.fxcm.com):
Losses can exceed deposits.
Please be advised that the information presented on TradingView is provided to FXCM (‘Company’, ‘we’) by a third-party provider (‘TFA Global Pte Ltd’). Please be reminded that you are solely responsible for the trading decisions on your account. There is a very high degree of risk involved in trading. Any information and/or content is intended entirely for research, educational and informational purposes only and does not constitute investment or consultation advice or investment strategy. The information is not tailored to the investment needs of any specific person and therefore does not involve a consideration of any of the investment objectives, financial situation or needs of any viewer that may receive it. Kindly also note that past performance is not a reliable indicator of future results. Actual results may differ materially from those anticipated in forward-looking or past performance statements. We assume no liability as to the accuracy or completeness of any of the information and/or content provided herein and the Company cannot be held responsible for any omission, mistake nor for any loss or damage including without limitation to any loss of profit which may arise from reliance on any information supplied by TFA Global Pte Ltd.
The speaker(s) is neither an employee, agent nor representative of FXCM and is therefore acting independently. The opinions given are their own, constitute general market commentary, and do not constitute the opinion or advice of FXCM or any form of personal or investment advice. FXCM neither endorses nor guarantees offerings of third-party speakers, nor is FXCM responsible for the content, veracity or opinions of third-party speakers, presenters or participants.

EUR/USD could be due a break from its bearish drubbingHaving fallen for six consecutive days, bearish momentum on EUR/USD is beginning to fade. Tuesday's low also held above the 1.06 level and 71.6% Fibonacci level whilst RSI (14) and (2) are in oversold levels on the daily chart.
The 4-hour chart shows bullish divergences on the RSIs, so the bias is to seek dips towards 1.06 for a long towards 1.0650 at a minimum. As we suspect some mean reversion higher is due - even if only temporarily.

eurusd → an updatehello guys...
as I published before:
I am in the short position from QMl(2) and the price was respected in my area perfectly:))
now I think the pair wanna touch the midline of the descending channel and start another downward movement but the support area is so strong so we can expect a compression here!
___________________________
✓✓✓ always do your research.
❒❒❒ If you have any questions, you can write them in the comments below, and I will answer them.
❤︎ ❤︎ ❤︎And please don't forget to support this idea with your likes and comment

EURUSD above the 4H MA50 after 2 weeks.The EURUSD pair broke above the 4H MA50 (blue trend-line) today for the first time in almost 2 weeks (since April 10). Our long-term bearish Target (1.05500) is intact, as called on April 02 (see chart below):
The 4H MA50 test should be a rejection though as it has been done while the pair is forming a Bear Flag. That is similar to the February 12 test which resulted into one final drop on the bottom (Lower Lows trend-line) of the long-term Channel Down.
We expect a strong medium-term rebound after the price hits 1.05500 and our Target will be 1.0800, which is marginally below the 0.618 Fibonacci retracement level, the mark that priced the March 08 (Lower) High.
-------------------------------------------------------------------------------
** Please LIKE 👍, FOLLOW ✅, SHARE 🙌 and COMMENT ✍ if you enjoy this idea! Also share your ideas and charts in the comments section below! This is best way to keep it relevant, support us, keep the content here free and allow the idea to reach as many people as possible. **
-------------------------------------------------------------------------------
💸💸💸💸💸💸
👇 👇 👇 👇 👇 👇

EUR/USD Sell setup 280 PipsDaily timeframe
We have broken the head and shoulder pattern and we estimate the downside will be the length of the head and we should wait for price to retrace at least to 31.8% or 50% fib level which come in confluence with the broken support which will act as resistance and trendline too.
Follow and comment below for more break down analysis

EURUSD: Detailed Technical Analysis & Key Levels 🇪🇺🇺🇸
Here is my latest structure analysis and important key levels
to watch on EURUSD next week.
Consider these structures for pullback/breakout trading.
❤️Please, support my work with like, thank you!❤️

Euro can decline to buyer zone again and then start to riseHello traders, I want share with you my opinion about Euro. By observing the chart, we can see that the price a not long time ago entered to downward channel, where firstly it broke the resistance level, which coincided with the seller zone and rose to the resistance line of the channel. Next, the price turned around and soon fell to the seller zone, but later price tried to back up and failed, after which in a short time Euro declined to support line of the downward channel, breaking the 1.0815 level. But then, the price started to rise and soon backed up to the seller zone, after which it some time traded near this area, and then made a strong downward impulse to support level, exiting from the channel and breaking the 1.08150 level one more time. Price started to trades near the 1.0620 support level, which coincided with the buyer zone and sometimes it even declined to this area, but a not long time ago EUR rebounded up. So, in my opinion, the Euro can decline to the buyer zone again, and then repeat movement up higher current location. For this case, my 1st TP is located at the 1.0740 points. Please share this idea with your friends and click Boost 🚀

EURUSD One last dump before the pump?The EURUSD pair is approaching the 1.05500 Target that we called on April 02 (see chart below), which is at the bottom of the 4-month Channel Down:
That will form the new Lower Low of the pattern, completing a -4.00% decline from the Lower High, which is 100% symmetrical with the previous Low. The structure of the Legs is very symmetrical so after the Low we expect the pair to turn bullish on the medium-term again. Our Target will be 1.0800 (just below the 0.618 Fibonacci retracement level).
-------------------------------------------------------------------------------
** Please LIKE 👍, FOLLOW ✅, SHARE 🙌 and COMMENT ✍ if you enjoy this idea! Also share your ideas and charts in the comments section below! This is best way to keep it relevant, support us, keep the content here free and allow the idea to reach as many people as possible. **
-------------------------------------------------------------------------------
💸💸💸💸💸💸
👇 👇 👇 👇 👇 👇

Eurozone Core & Headline CPI overviewEUROZONE CPI
Eurozone Headline and Core CPI for October both came in as expected (decrease)
Eurozone Headline CPI:
MoM – Actual 0.1% / Exp. 0.1% / Prev. 0.3%
YoY – Actual 2.9% / Exp. 2.9% / Prev. 4.3% (purple on chart)
Eurozone Core CPI:
MoM – Actual 0.2% / Exp. 0.2% / Prev. 0.2%
YoY – Actual 4.2% / Exp. 4.2% / Prev. 4.5% (blue on chart)
The chart below illustrates the direction of the current YoY down trend for both Headline and Core CPI however we are still not at the historical moderate levels of inflation desired. You can see these moderate levels of inflation between 0 – 2% from 2015 – 2020 below.
