EURUSD Rally already underway on the 1D MA50.The EURUSD pair has been trading within a Channel Up since practically the beginning of the year. The recent rebound (May 12) on its 1D MA50 (blue trend-line) has technically started the pattern's new Bullish Leg.
Given that the previous two have risen by +7.50% on average, and were both confirmed by a 1D MACD Bullish Cross like the one formed today, we expect a minimum +7.20% rise from the bottom. Our Target is 1.18500.
-------------------------------------------------------------------------------
** Please LIKE 👍, FOLLOW ✅, SHARE 🙌 and COMMENT ✍ if you enjoy this idea! Also share your ideas and charts in the comments section below! This is best way to keep it relevant, support us, keep the content here free and allow the idea to reach as many people as possible. **
-------------------------------------------------------------------------------
Disclosure: I am part of Trade Nation's Influencer program and receive a monthly fee for using their TradingView charts in my analysis.
💸💸💸💸💸💸
👇 👇 👇 👇 👇 👇
Euro

EURUSD - Important Breakout !Hello Traders !
The EURUSD price formed a descending channel.
Currently, The resistance line is broken !
So, I expect a bullish move🚀
______________
TARGET: 1.14095🎯

EUR JPY TECHHello dear traders :) It's time to share my new tech!
As we see here we have many reasons to think its ok position to open Long EURJPY
We got a strong uptrend here. We have 16 days LONG strong up channel in this pair. also a nice support point inside.
Our trades price target is near +60 pips (Take Profit).
If you have any Questions? Ask me!
FxCROWN :)
Thank you

Euro will start to grow from support and then leave pennantHello traders, I want share with you my opinion about Euro. Previously, price was moving confidently inside an upward channel, forming steady higher highs and higher lows. After a clear breakout from that structure, the price started consolidating inside a new pattern, an upward pennant. This formation usually appears as a continuation structure, where the market builds pressure before a new impulse. Currently, the price is trading near the middle of the pennant, after rolling down from the resistance line and rebounding up from the support area. The structure is compressing, and a retest of the support line near 1.1155 may occur before a breakout happens. Given the confluence of the pennant structure, the strong support area, and the previous bullish momentum, I expect the Euro to rebound again from the lower trend line and initiate an upward breakout. That’s why I set my TP 1 at the 1.1500 level, a logical target aligned with the upper boundary of the pattern and next key resistance. Please share this idea with your friends and click Boost 🚀
Disclaimer: As part of ThinkMarkets’ Influencer Program, I am sponsored to share and publish their charts in my analysis.

EURUSD Pullback in Play – Next Stop: $1.1337EURUSD ( FX:EURUSD ) is moving in the Resistance zone($1.1310-$1.1162) while the upper line of the descending channel has been broken.
According to Elliott Wave theory , a breakout of the descending channel can at least confirm the end of a corrective wave . The corrective wave structure was a Double Three Correction(WXY) .
I expect EURUSD to rise to at least $1.1337 after completing a pullback to the upper line of the descending channel .
Note: If EURUSD touches $1.11590, we can expect further declines.
Please respect each other's ideas and express them politely if you agree or disagree.
Euro/U.S. Dollar Analyze (EURUSD), 4-hour time frame.
Be sure to follow the updated ideas.
Do not forget to put a Stop loss for your positions (For every position you want to open).
Please follow your strategy and updates; this is just my Idea, and I will gladly see your ideas in this post.
Please do not forget the ✅' like '✅ button 🙏😊 & Share it with your friends; thanks, and Trade safe.

SHORT ON EUR/AUDEUR/AUD has swept the Asian high and am looking to short it to take out the Asian low as balance out a huge FVG from the higher timeframe.

Euro H4 | Potential bullish bounceThe Euro (EUR/USD) could fall towards an overlap support and potentially bounce off this level to climb higher.
Buy entry is at 1.1274 which is an overlap support that aligns with the 23.6% Fibonacci retracement.
Stop loss is at 1.1195 which is a level that lies underneath a pullback support and the 50.0% Fibonacci retracement.
Take profit is at 1.1426 which is a pullback resistance.
High Risk Investment Warning
Trading Forex/CFDs on margin carries a high level of risk and may not be suitable for all investors. Leverage can work against you.
Stratos Markets Limited (tradu.com/uk):
CFDs are complex instruments and come with a high risk of losing money rapidly due to leverage. 63% of retail investor accounts lose money when trading CFDs with this provider. You should consider whether you understand how CFDs work and whether you can afford to take the high risk of losing your money.
Stratos Europe Ltd (tradu.com/eu):
CFDs are complex instruments and come with a high risk of losing money rapidly due to leverage. 63% of retail investor accounts lose money when trading CFDs with this provider. You should consider whether you understand how CFDs work and whether you can afford to take the high risk of losing your money.
Stratos Global LLC (tradu.com/en):
Losses can exceed deposits.
Please be advised that the information presented on TradingView is provided to Tradu (‘Company’, ‘we’) by a third-party provider (‘TFA Global Pte Ltd’). Please be reminded that you are solely responsible for the trading decisions on your account. There is a very high degree of risk involved in trading. Any information and/or content is intended entirely for research, educational and informational purposes only and does not constitute investment or consultation advice or investment strategy. The information is not tailored to the investment needs of any specific person and therefore does not involve a consideration of any of the investment objectives, financial situation or needs of any viewer that may receive it. Kindly also note that past performance is not a reliable indicator of future results. Actual results may differ materially from those anticipated in forward-looking or past performance statements. We assume no liability as to the accuracy or completeness of any of the information and/or content provided herein and the Company cannot be held responsible for any omission, mistake nor for any loss or damage including without limitation to any loss of profit which may arise from reliance on any information supplied by TFA Global Pte Ltd.
The speaker(s) is neither an employee, agent nor representative of Tradu and is therefore acting independently. The opinions given are their own, constitute general market commentary, and do not constitute the opinion or advice of Tradu or any form of personal or investment advice. Tradu neither endorses nor guarantees offerings of third-party speakers, nor is Tradu responsible for the content, veracity or opinions of third-party speakers, presenters or participants.

SHORT ON EUR/USDEUR/USD is in a overall uptrend.
I'm just looking to catch the pullback as we continue to make downtrend market structure on the pullback itself.
Looking to catch 200-400 pips to the downside.

Euro can continue to decline in channel to buyer zoneHello traders, I want share with you my opinion about Euro. Earlier, the Euro formed a symmetrical triangle, where the price squeezed between resistance and support lines before breaking out with a strong impulse move. After this breakout, the pair quickly climbed toward the 1.1420 - 1.1455 resistance area, a major seller zone, but failed to hold above it. Since then, the price structure shifted into a well-defined downward channel. Within this channel, we’ve seen repeated rejections from the upper boundary and controlled declines toward the support line. Recently, EUR rebounded again from the resistance line, confirming that sellers remain in control. Now the price is heading lower once more. Given this repeated rejection and the prevailing bearish structure, I expect the decline to continue toward the next key area, the 1.1070 - 1.1035 buyer zone. This level aligns with the channel’s support and has acted as a reaction zone in the past. That’s why I set my TP at 1.1035, the bottom of the buyer zone and a logical target within this bearish setup. Please share this idea with your friends and click Boost 🚀
Disclaimer: As part of ThinkMarkets’ Influencer Program, I am sponsored to share and publish their charts in my analysis.

EURUSD 1st 4H Death Cross after 7 months. Is it enough to short?The EURUSD pair just formed its first Death Cross on the 4H time-frame since October 04 2024. The last such formation signaled the bearish extension of the trend by breaking below its Higher Lows trend-line.
That was a similar Higher Lows trend-line the price rebounded on on May 12, exactly on the 1D MA50 (red trend-line). With the 1D RSI on levels similar with that previous Death Cross, we will wait for confirmation before shorting again and the price to break is the Higher Low/ 1D MA50 Cluster.
If broken, our Target will be just above the 0.618 Fibonacci from the bottom at 1.07350.
-------------------------------------------------------------------------------
** Please LIKE 👍, FOLLOW ✅, SHARE 🙌 and COMMENT ✍ if you enjoy this idea! Also share your ideas and charts in the comments section below! This is best way to keep it relevant, support us, keep the content here free and allow the idea to reach as many people as possible. **
-------------------------------------------------------------------------------
Disclosure: I am part of Trade Nation's Influencer program and receive a monthly fee for using their TradingView charts in my analysis.
💸💸💸💸💸💸
👇 👇 👇 👇 👇 👇

Euro H4 | Overlap resistance at 38.2% Fibonacci retracementThe Euro (EUR/USD) is rising towards an overlap resistance and could potentially reverse off this level to drop lower.
Sell entry is at 1.1263 which is an overlap resistance that aligns with the 38.2% Fibonacci retracement.
Stop loss is at 1.1395 which is a level that sits above the 61.8% Fibonacci retracement and a multi-swing-high resistance.
Take profit is at 1.1081 which is an overlap support that aligns close to the 61.8% Fibonacci retracement.
High Risk Investment Warning
Trading Forex/CFDs on margin carries a high level of risk and may not be suitable for all investors. Leverage can work against you.
Stratos Markets Limited (tradu.com):
CFDs are complex instruments and come with a high risk of losing money rapidly due to leverage. 63% of retail investor accounts lose money when trading CFDs with this provider. You should consider whether you understand how CFDs work and whether you can afford to take the high risk of losing your money.
Stratos Europe Ltd (tradu.com):
CFDs are complex instruments and come with a high risk of losing money rapidly due to leverage. 63% of retail investor accounts lose money when trading CFDs with this provider. You should consider whether you understand how CFDs work and whether you can afford to take the high risk of losing your money.
Stratos Global LLC (tradu.com):
Losses can exceed deposits.
Please be advised that the information presented on TradingView is provided to Tradu (‘Company’, ‘we’) by a third-party provider (‘TFA Global Pte Ltd’). Please be reminded that you are solely responsible for the trading decisions on your account. There is a very high degree of risk involved in trading. Any information and/or content is intended entirely for research, educational and informational purposes only and does not constitute investment or consultation advice or investment strategy. The information is not tailored to the investment needs of any specific person and therefore does not involve a consideration of any of the investment objectives, financial situation or needs of any viewer that may receive it. Kindly also note that past performance is not a reliable indicator of future results. Actual results may differ materially from those anticipated in forward-looking or past performance statements. We assume no liability as to the accuracy or completeness of any of the information and/or content provided herein and the Company cannot be held responsible for any omission, mistake nor for any loss or damage including without limitation to any loss of profit which may arise from reliance on any information supplied by TFA Global Pte Ltd.
The speaker(s) is neither an employee, agent nor representative of Tradu and is therefore acting independently. The opinions given are their own, constitute general market commentary, and do not constitute the opinion or advice of Tradu or any form of personal or investment advice. Tradu neither endorses nor guarantees offerings of third-party speakers, nor is Tradu responsible for the content, veracity or opinions of third-party speakers, presenters or participants.

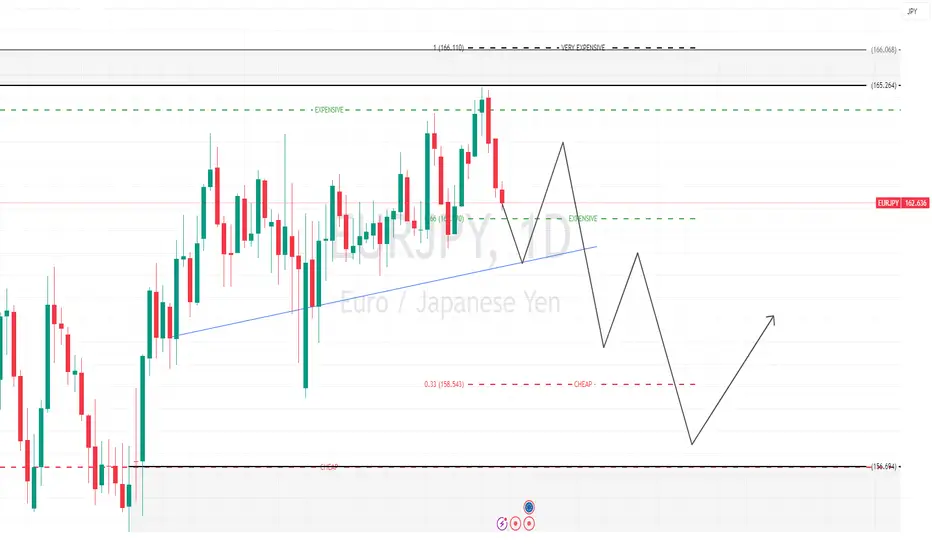
EURJPY- SHORTI can see that with the expectations of the upcoming CPI due on Monday.
1. Prices moved back into our NO TRADE ZONE (FAIR VALUE) after touching our Key retail area.
2. The initial direction is showing a downtrend.
personally feel the rally has been exhausted and is ready for cooling of the Euro/Jpy
MY EXPECTATIONS:
- Deflationary Data outcome for the CPI
- Weaker Euro
- Bad news for the Euro
TO PUSH DOWN PRICES FURTHER into my wholesaler area
EURGBP | A Shift in Market Dynamics: GBP to Gain StrengthThe current environment, driven by increasing uncertainty in the dollar, presents a unique opportunity in the EURGBP trading pair. With the Eurozone having lowered interest rates, the euro has gained value somewhat unnecessarily, largely in response to some of the illogical market moves we've seen from the Trump era. However, as the volatility from such unpredictable actions settles down, the British pound (GBP) will likely make a comeback.
📉 Euro's Overvaluation and GBP's Stability
While the Euro has benefited from these external factors, its recent strength is arguably not reflective of the underlying economic realities. On the other hand, the British pound has maintained stability with consistent interest rates. This relative calmness has allowed GBP to gain strength against the euro over time.
📈 GBP Will Play Catch-Up
As we move forward, the GBP is poised to compensate for its recent underperformance. The Bank of England's steady approach to interest rates will provide a solid foundation for the pound to regain lost ground. In contrast, the euro may struggle to sustain its current levels, particularly with the potential risks surrounding further economic policies in the Eurozone.
🔍 Trade Strategy for EURGBP
As a trader, I see EURGBP as a clear short opportunity, with the pound likely to outperform the euro in the near-term. Patience is key here, as waiting for the right technical setup, especially on the lower timeframes, will allow you to enter with confirmation.
💡 Why This Matters
The shifts in these two economies — one facing potential fallout from low rates and the other benefiting from a more stable policy environment — create an optimal setup for taking advantage of currency movements. Just as in any trade, follow the clear path where value has been mispriced and capitalize on that gap.
Stay informed and be ready to act when these market conditions play out — because this opportunity might not last long.
📌I keep my charts clean and simple because I believe clarity leads to better decisions.
📌My approach is built on years of experience and a solid track record. I don’t claim to know it all but I’m confident in my ability to spot high-probability setups.
📌If you would like to learn how to use the heatmap, cumulative volume delta and volume footprint techniques that I use below to determine very accurate demand regions, you can send me a private message. I help anyone who wants it completely free of charge.
🔑I have a long list of my proven technique below:
🎯 ZENUSDT.P: Patience & Profitability | %230 Reaction from the Sniper Entry
🐶 DOGEUSDT.P: Next Move
🎨 RENDERUSDT.P: Opportunity of the Month
💎 ETHUSDT.P: Where to Retrace
🟢 BNBUSDT.P: Potential Surge
📊 BTC Dominance: Reaction Zone
🌊 WAVESUSDT.P: Demand Zone Potential
🟣 UNIUSDT.P: Long-Term Trade
🔵 XRPUSDT.P: Entry Zones
🔗 LINKUSDT.P: Follow The River
📈 BTCUSDT.P: Two Key Demand Zones
🟩 POLUSDT: Bullish Momentum
🌟 PENDLEUSDT.P: Where Opportunity Meets Precision
🔥 BTCUSDT.P: Liquidation of Highly Leveraged Longs
🌊 SOLUSDT.P: SOL's Dip - Your Opportunity
🐸 1000PEPEUSDT.P: Prime Bounce Zone Unlocked
🚀 ETHUSDT.P: Set to Explode - Don't Miss This Game Changer
🤖 IQUSDT: Smart Plan
⚡️ PONDUSDT: A Trade Not Taken Is Better Than a Losing One
💼 STMXUSDT: 2 Buying Areas
🐢 TURBOUSDT: Buy Zones and Buyer Presence
🌍 ICPUSDT.P: Massive Upside Potential | Check the Trade Update For Seeing Results
🟠 IDEXUSDT: Spot Buy Area | %26 Profit if You Trade with MSB
📌 USUALUSDT: Buyers Are Active + %70 Profit in Total
🌟 FORTHUSDT: Sniper Entry +%26 Reaction
🐳 QKCUSDT: Sniper Entry +%57 Reaction
📊 BTC.D: Retest of Key Area Highly Likely
📊 XNOUSDT %80 Reaction with a Simple Blue Box!
📊 BELUSDT Amazing %120 Reaction!
I stopped adding to the list because it's kinda tiring to add 5-10 charts in every move but you can check my profile and see that it goes on..

Euro may break support level and fall to support line of channelHello traders, I want share with you my opinion about Euro. In this chart, we can see how the price after another rejection from the resistance boundary of the descending channel, the Euro began to show renewed bearish pressure. The price attempted to gain ground above the buyer zone, but the breakout lacked follow-through and quickly reversed. This false breakout scenario often acts as a trigger for a deeper drop, especially when it occurs near the mid-range of a well-defined channel. The market remains inside a structured downward channel, with lower highs and lower lows still intact. At this point, the price is approaching the upper section of the buyer zone again. If sellers regain control and push the market lower, a breakdown below 1.1135 could open the way for another leg to the downside. I expect EUR will continue declining toward the support line of the channel. That’s why my current TP 1 is set at 1.100, which aligns with the lower boundary of the structure and marks a potential short-term target for bearish continuation. Please share this idea with your friends and click Boost 🚀

Euro H4 | Overlap resistance at 38.2% Fibonacci retracementThe Euro (EUR/USD) is rising towards an overlap resistance and could potentially reverse off this level to drop lower.
Sell entry is at 1.1263 which is an overlap resistance that aligns with the 38.2% Fibonacci retracement.
Stop loss is at 1.1395 which is a level that sits above the 61.8% Fibonacci retracement and a multi-swing-high resistance.
Take profit is at 1.1081 which is an overlap support that aligns close the 61.8% Fibonacci retracement.
High Risk Investment Warning
Trading Forex/CFDs on margin carries a high level of risk and may not be suitable for all investors. Leverage can work against you.
Stratos Markets Limited (tradu.com):
CFDs are complex instruments and come with a high risk of losing money rapidly due to leverage. 63% of retail investor accounts lose money when trading CFDs with this provider. You should consider whether you understand how CFDs work and whether you can afford to take the high risk of losing your money.
Stratos Europe Ltd (tradu.com):
CFDs are complex instruments and come with a high risk of losing money rapidly due to leverage. 63% of retail investor accounts lose money when trading CFDs with this provider. You should consider whether you understand how CFDs work and whether you can afford to take the high risk of losing your money.
Stratos Global LLC (tradu.com):
Losses can exceed deposits.
Please be advised that the information presented on TradingView is provided to Tradu (‘Company’, ‘we’) by a third-party provider (‘TFA Global Pte Ltd’). Please be reminded that you are solely responsible for the trading decisions on your account. There is a very high degree of risk involved in trading. Any information and/or content is intended entirely for research, educational and informational purposes only and does not constitute investment or consultation advice or investment strategy. The information is not tailored to the investment needs of any specific person and therefore does not involve a consideration of any of the investment objectives, financial situation or needs of any viewer that may receive it. Kindly also note that past performance is not a reliable indicator of future results. Actual results may differ materially from those anticipated in forward-looking or past performance statements. We assume no liability as to the accuracy or completeness of any of the information and/or content provided herein and the Company cannot be held responsible for any omission, mistake nor for any loss or damage including without limitation to any loss of profit which may arise from reliance on any information supplied by TFA Global Pte Ltd.
The speaker(s) is neither an employee, agent nor representative of Tradu and is therefore acting independently. The opinions given are their own, constitute general market commentary, and do not constitute the opinion or advice of Tradu or any form of personal or investment advice. Tradu neither endorses nor guarantees offerings of third-party speakers, nor is Tradu responsible for the content, veracity or opinions of third-party speakers, presenters or participants.

SHORT ON EUR/JPYOANDA:EURJPY has created a double top with bearish divergence at a major supply zone.
I will be selling EJ to the next level of support/demand for over 200 pips.

EUR/USD Daily Short SetupSetup: Retest of the former support zone (now supply) after the recent pullback from the mid-April highs
Entry: Short around 1.1336 (within the shaded resistance box)
Stop-Loss: Above the recent swing high at 1.1390
Take-Profit: Near the lower range support at 1.0735
Risk : Reward: ~1 : 5
Rationale:
Following a strong rally from early March to mid-April, EUR/USD has corrected sharply and is now back into the grey supply area that previously acted as support. This zone is likely to cap upside moves, making a short entry here attractive. The next major support lies around 1.0735, offering a high reward relative to risk. A break above 1.1390 would invalidate the setup.

EURCAD - Bearish Double TOPHello Traders !
The EURCAD failed to break the resistance level (1.59934 - 1.59334).
The price formed a double top pattern.
Currently, The neckline is broken !
So, I expect a bearish move📉
________________
TARGET: 1.54350🎯

Euro H4 | Rising into an overlap resistanceThe Euro (EUR/USD) is rising towards an overlap resistance and could potentially reverse off this level to drop lower.
Sell entry is at 1.1263 which is an overlap resistance that aligns with the 38.2% Fibonacci retracement.
Stop loss is at 1.1395 which is a level that sits above the 61.8% Fibonacci retracement and a multi-swing-high resistance.
Take profit is at 1.1081 which is an overlap support that aligns close the 61.8% Fibonacci retracement.
High Risk Investment Warning
Trading Forex/CFDs on margin carries a high level of risk and may not be suitable for all investors. Leverage can work against you.
Stratos Markets Limited (tradu.com):
CFDs are complex instruments and come with a high risk of losing money rapidly due to leverage. 63% of retail investor accounts lose money when trading CFDs with this provider. You should consider whether you understand how CFDs work and whether you can afford to take the high risk of losing your money.
Stratos Europe Ltd (tradu.com):
CFDs are complex instruments and come with a high risk of losing money rapidly due to leverage. 63% of retail investor accounts lose money when trading CFDs with this provider. You should consider whether you understand how CFDs work and whether you can afford to take the high risk of losing your money.
Stratos Global LLC (tradu.com):
Losses can exceed deposits.
Please be advised that the information presented on TradingView is provided to Tradu (‘Company’, ‘we’) by a third-party provider (‘TFA Global Pte Ltd’). Please be reminded that you are solely responsible for the trading decisions on your account. There is a very high degree of risk involved in trading. Any information and/or content is intended entirely for research, educational and informational purposes only and does not constitute investment or consultation advice or investment strategy. The information is not tailored to the investment needs of any specific person and therefore does not involve a consideration of any of the investment objectives, financial situation or needs of any viewer that may receive it. Kindly also note that past performance is not a reliable indicator of future results. Actual results may differ materially from those anticipated in forward-looking or past performance statements. We assume no liability as to the accuracy or completeness of any of the information and/or content provided herein and the Company cannot be held responsible for any omission, mistake nor for any loss or damage including without limitation to any loss of profit which may arise from reliance on any information supplied by TFA Global Pte Ltd.
The speaker(s) is neither an employee, agent nor representative of Tradu and is therefore acting independently. The opinions given are their own, constitute general market commentary, and do not constitute the opinion or advice of Tradu or any form of personal or investment advice. Tradu neither endorses nor guarantees offerings of third-party speakers, nor is Tradu responsible for the content, veracity or opinions of third-party speakers, presenters or participants.

Digital Euro: Separating Fact from Conspiracy TheoriesIn today’s fast-paced digital landscape, misinformation can spread rapidly and mislead even those well-intentioned readers. With the Digital Euro project circulating online, numerous pieces of fake news have surfaced—not just criticism or differing opinions, but outright falsehoods that may convince citizens, especially those less familiar with financial innovations, that the project is something it is not. In this article, we delve into the most common misconceptions and explain with clarity and factual context why these claims do not correspond with reality.
1. Myth: "The Digital Euro Will Replace Cash"
❌ False. Despite alarming headlines, cash will not vanish. The Digital Euro is poised to become an additional payment option alongside physical money. The Eurosystem is committed to ensuring that banknotes and coins remain accessible. In fact, plans are already underway to introduce new series of euro banknotes, reaffirming the continued value of cash in our daily transactions.
2. Myth: "The ECB Will Be Able to Control and Block Your Payments"
❌ False. Privacy is a cornerstone of the Digital Euro. Similar to the way cash transactions operate, offline payments would be possible without any tracking by the Eurosystem. This means that your personal transactions remain private and free from arbitrary interference. The design of the digital euro ensures that your financial autonomy is preserved.
3. Myth: "There Will Be Arbitrary Limits on How Much Digital Euro Can Be Held"
❌ False. Any limits imposed on holding digital euros would not be arbitrary measures of control but rather tools to safeguard financial stability. Such thresholds are considered from the perspective of systemic security—not the curtailment of individual freedom. The focus is on ensuring that the financial ecosystem remains resilient rather than monitoring or constraining individual spending.
4. Myth: "The Digital Euro Is a Way to Introduce Negative Interest Rates on Deposits"
❌ False. The digital euro is designed to mirror cash in its fundamental properties—namely, being interest-free. It is not a mechanism for financial authorities to impose negative interest rates on personal funds. The purpose is to complement traditional cash by offering a modern payment solution without altering the neutrality of money.
5. Myth: "It Will Be Mandatory to Use the Digital Euro"
❌ False. Use of the digital euro is entirely optional, serving as one out of many available payment instruments. Just as consumers choose between cash, credit cards, or other digital means, the digital euro is simply an additional tool. No regulation compels you to adopt this innovation if you prefer your existing methods.
6. Myth: "Banks Will Lose All Their Role"
❌ False. The introduction of the digital euro will not render banks obsolete. Banks will continue to provide essential financial services, acting as intermediaries and offering the digital euro alongside other products. The evolution of the payment system enhances consumer choice without dismantling the traditional banking framework.
7. Myth: "The Digital Euro Will Be Programmable, So They Will Tell You How to Spend Your Money"
❌ False. The concept of programmability—that is, dictating how funds are spent—has been explicitly ruled out by the ECB. Both proposals from the European Commission and the legislative frameworks confirm that the digital euro will not be programmable. The goal is to maintain financial freedom and user discretion, similar to how cash operates.
8. Myth: "It's a Project to Eliminate Cryptocurrencies"
❌ False. Rather than extinguishing cryptoassets, the Digital Euro is designed to coexist alongside them. While cryptocurrencies are often speculative and volatile, the digital euro aims to offer a more stable and secure means of payment. The two are intended to serve different purposes: cryptoassets are generally considered investment or speculative instruments, whereas the Digital Euro would fulfill everyday transactional needs.
9. Myth: "There Will Be No More Privacy in Payments"
❌ False. Privacy in the digital age remains a top priority. Offline transactions with the Digital Euro will mirror the privacy features of cash, shielding your personal data. For online transactions, robust privacy regimes are in place. Importantly, the issuer—the Eurosystem—will not have the ability to directly connect transactions to specific individuals, ensuring that your financial privacy is maintained.
Conclusion
The Digital Euro is not the harbinger of a new era of financial surveillance or control. Instead, it represents an additional, modern means of payment designed to coexist with traditional cash and current banking services . By dispelling these myths, we hope to foster a clearer understanding of the Digital Euro project and promote informed discussions based on official facts.
Embracing accurate information is crucial to navigating the ever-changing world of digital finance, ensuring that choices are made based on facts rather than fictions.
FX_IDC:EURUSD TVC:DXY TVC:EXY INDEX:BTCUSD CRYPTO:BTCUSD TVC:SPX EUREX:FESX1! EURONEXT:N100 AMEX:FXE TVC:GOLD FX_IDC:XAUUSD

EURGBP: Shifting to long term bearish.EURGBP is heavily bearish on its 1D technical outlook (RSI = 36.165, MACD = 0.000, ADX = 36.508), and most likely will close the day under its 1D MA50. At the moment it is crossing below the 2025 Channel Up and if it closes under it, we will have a validated trend shift to bearish long term. It will be similar to the August 2024 decline that made a new Low after a 1D MA50 rejection. We first aim for the S1 level (TP1 = 0.83500) and as long as it remains under the 1D MA50, resell on the bounce to the S1 level (TP2 = 0.82500).
## If you like our free content follow our profile to get more daily ideas. ##
## Comments and likes are greatly appreciated. ##

EURUSD first 1D MA50 test since March 03. Bearish?Last time we had a look at the EURUSD pair (April 28, see chart below), we gave a bearish continuation signal, which not only did it hit its 1.12500 Target but also broke below the 3-month Channel Down:
This has brought us to the almost the first 1D MA50 (blue trend-line) test since the March 03 break-out. As long as this holds, it keeps the trend bullish but the 1D RSI is on a Bearish Divergence, indicating a potential long-term trend change.
Technically it is similar with the December 28 2023 High, which at the time of the 1D MA50 test was also on Higher Lows but its RSI on Lower Lows (Bearish Div). The 1D MA50 eventually broke, leading to a sell continuation that hit the 0.618 Fibonacci retracement level from the bottom.
As a result, if the D MA50 breaks, we will turn bearish, targeting 1.07000 (the 0.618 Fib).
-------------------------------------------------------------------------------
** Please LIKE 👍, FOLLOW ✅, SHARE 🙌 and COMMENT ✍ if you enjoy this idea! Also share your ideas and charts in the comments section below! This is best way to keep it relevant, support us, keep the content here free and allow the idea to reach as many people as possible. **
-------------------------------------------------------------------------------
Disclosure: I am part of Trade Nation's Influencer program and receive a monthly fee for using their TradingView charts in my analysis.
💸💸💸💸💸💸
👇 👇 👇 👇 👇 👇

Euro may exit from wedge and then drop to support levelHello traders, I want share with you my opinion about Euro. After a strong impulse to the upside and a retest of the 1.1265 resistance area, the Euro started to consolidate inside a downward wedge. Despite repeated attempts to hold above the 1.1265 - 1.1300 zone, price action gradually shifted lower, creating lower highs within the wedge formation. This pattern often signals continuation or deeper correction, especially when formed after a large bullish move. The recent breakout below both the support area and the lower wedge boundary confirms that bearish pressure is taking control. The rejection from the seller zone and the sharp decline reinforce this shift in sentiment. Now the price is trading near the support line of the wedge and showing weak attempts to recover, forming a potential retest of the broken structure. Given the break of support, I expect the Euro may continue its decline toward the 1.0925 level, which coincides with both the buyer zone and a well-defined support level, thereby exiting from wedge pattern. This zone serves as my current TP 1. Please share this idea with your friends and click Boost 🚀
