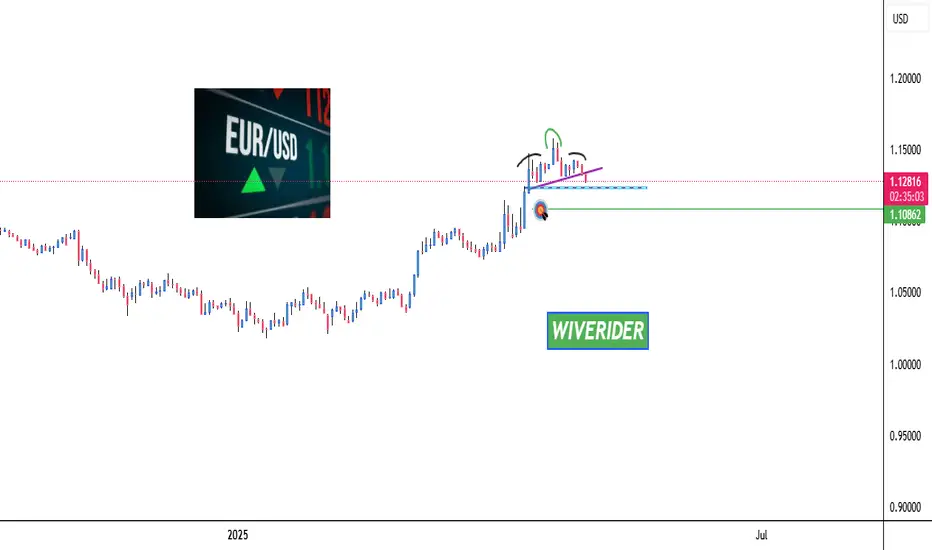
EUR/USD Bearish Setup: QM + Breakout Play Targeting Demand Zone!Hello guys!
I think eurusd is bearish! why?
A Range: Market consolidated in a tight horizontal range before breaking out.
QM Pattern: A lower high and lower low structure indicates potential for a trend reversal.
Neckline Break: Bearish confirmation with a strong break and close below neckline support.
Retest Zone: Price is now revisiting the QM supply zone, offering a high-probability short setup.
Bearish Projection: The next expected move is a drop toward the S&D (Support & Demand) zone between 1.12640 and 1.11900, which aligns with historical demand and previous accumulation.
________________________
🎯 Bearish Target Zone:
First TP: 1.12640
Final TP: 1.11900 - 1.12080 (Demand Zone)
Euro

Euro may correct to support area and then start to move upHello traders, I want share with you my opinion about Euro. Looking at this chart, we can see how price has been confidently trending within an upward channel, supported by strong impulses and consistent demand from the lower boundary. The price initially rebounded from the buyer zone, which later became the launchpad for a major upward move. After breaking the resistance line of the channel, the Euro made a clean breakout and confirmed its strength with a retest from above, a clear sign of bullish continuation. This upward momentum carried price directly into the support area, which has since served as a key zone for consolidations. The market then shifted into a horizontal range, trading within well-defined boundaries, with repeated rejections near the top and steady rebounds from the bottom support. What’s crucial now is that the Euro is again testing the lower border of this range while holding above the current support level at 1.1270. Given this structure, a strong preceding trend, clean reaction at the bottom of the range, and ongoing consolidation without deeper breakdowns, I expect the price to rebound from this zone and continue higher. My TP1 is set at 1.1575, the upper boundary of the current range, which remains a logical magnet for price in the short term. Please share this idea with your friends and click Boost 🚀

Euro will exit from pennant and grow to resistance levelHello traders, I want share with you my opinion about Euro. Looking at this chart, we can see how the price, after a strong upward impulse, the price entered into a consolidation phase, forming a classic upward pennant pattern. Throughout this structure, the price repeatedly respected both the support line and resistance line, tightening inside the pennant while still holding above the support level at 1.1300. This zone, between 1.1280 and 1.1300, marked as the buyer zone, has acted as a strong floor multiple times. Every touch to this area sparked bullish reactions, and most recently, we can see the rice once again starting to grow after dipping into this zone. On the upper side, the resistance level at 1.1430 coincides with the breakout target of the pennant, and also lies just below the seller zone, making it a logical TP 1 area for bulls. The current price action suggests that after a minor pull-back, the price may test the lower pennant edge and then rebound, potentially initiating an impulsive breakout toward 1.1430. Given this structure and the strong base forming around 1.1300, I expect Euro will grow upward toward my TP 1 at the 1.1430 level, thereby exiting from the pennant. Please share this idea with your friends and click Boost 🚀

Euro H4 | Pullback resistance at 50% Fibonacci retracementThe Euro (EUR/USD) is rising towards a pullback resistance and could potentially reverse off this level to drop lower.
Sell entry is at 1.1426 which is a pullback resistance that aligns with the 50.0% Fibonacci retracement.
Stop loss is at 1.1583 which is a level that sits above a swing-high resistance.
Take profit is at 1.1274 which is a multi-swing-low support that aligns close to the 38.2% Fibonacci retracement.
High Risk Investment Warning
Trading Forex/CFDs on margin carries a high level of risk and may not be suitable for all investors. Leverage can work against you.
Stratos Markets Limited (tradu.com):
CFDs are complex instruments and come with a high risk of losing money rapidly due to leverage. 63% of retail investor accounts lose money when trading CFDs with this provider. You should consider whether you understand how CFDs work and whether you can afford to take the high risk of losing your money.
Stratos Europe Ltd (tradu.com):
CFDs are complex instruments and come with a high risk of losing money rapidly due to leverage. 63% of retail investor accounts lose money when trading CFDs with this provider. You should consider whether you understand how CFDs work and whether you can afford to take the high risk of losing your money.
Stratos Global LLC (tradu.com):
Losses can exceed deposits.
Please be advised that the information presented on TradingView is provided to Tradu (‘Company’, ‘we’) by a third-party provider (‘TFA Global Pte Ltd’). Please be reminded that you are solely responsible for the trading decisions on your account. There is a very high degree of risk involved in trading. Any information and/or content is intended entirely for research, educational and informational purposes only and does not constitute investment or consultation advice or investment strategy. The information is not tailored to the investment needs of any specific person and therefore does not involve a consideration of any of the investment objectives, financial situation or needs of any viewer that may receive it. Kindly also note that past performance is not a reliable indicator of future results. Actual results may differ materially from those anticipated in forward-looking or past performance statements. We assume no liability as to the accuracy or completeness of any of the information and/or content provided herein and the Company cannot be held responsible for any omission, mistake nor for any loss or damage including without limitation to any loss of profit which may arise from reliance on any information supplied by TFA Global Pte Ltd.
The speaker(s) is neither an employee, agent nor representative of Tradu and is therefore acting independently. The opinions given are their own, constitute general market commentary, and do not constitute the opinion or advice of Tradu or any form of personal or investment advice. Tradu neither endorses nor guarantees offerings of third-party speakers, nor is Tradu responsible for the content, veracity or opinions of third-party speakers, presenters or participants.

EURUSD Channel Up favors buying but keep an eye on this.The EURUSD pair has been trading within a Channel Up pattern since the February 28 Low and its current Bearish Leg almost reached the 0.382 Fibonacci retracement level. That is where the previous Bearish Leg made a Higher Low (March 27) and rebounded.
This keeps for now the bullish trend intact and it will remain so for as long as the price remains within the Channel Up. The short-term Target is the -0.236 Fib extension at 1.17500. If on the other hand it breaks below the Channel Up, be ready to take the small loss and sell towards the 1D MA200 (orange trend-line) at 1.08500, which is the level that supported the market on that previous March 27 Low.
-------------------------------------------------------------------------------
** Please LIKE 👍, FOLLOW ✅, SHARE 🙌 and COMMENT ✍ if you enjoy this idea! Also share your ideas and charts in the comments section below! This is best way to keep it relevant, support us, keep the content here free and allow the idea to reach as many people as possible. **
-------------------------------------------------------------------------------
Disclosure: I am part of Trade Nation's Influencer program and receive a monthly fee for using their TradingView charts in my analysis.
💸💸💸💸💸💸
👇 👇 👇 👇 👇 👇

EURAUD - Bearish Head and ShouldersHello Traders !
The EURAUD failed to create a new higher high!
The price formed a head and shoulders pattern.
At the moment, The neckline is broken !
So, I expect a bearish move📉
_______________
TARGET: 1.71900🎯

Euro can continue to move up inside upward channelHello traders, I want share with you my opinion about Euro. Looking at this chart, we can observe how the price has been moving confidently within the boundaries of a well-formed upward channel. After an extended period of consolidation inside the buyer zone, the market began forming higher lows and eventually broke out with strong bullish momentum. That breakout was followed by a smooth trend-building phase, where each correction found support at higher levels, a clear signal of growing buyer interest. As the price moved higher, it respected both the support line and the support level at 1.0910, reinforcing the structure of the channel. When the market reached the support area, it consolidated for a while before launching another impulse up, confirming the breakout and creating a new higher support zone. Now, the market has pulled back into the support zone, which aligns with the 1.1285 current support level and the lower boundary of the channel. Given the strength of the overall trend, the clear structure of the upward channel, and the reaction from a key support zone, I expect the pair to continue moving higher toward TP1 at 1.1600 points. Please share this idea with your friends and click Boost 🚀

Eur/Gbp Elliott wave May/02 hello eveyone...
as you can see it seems wave 4 completed ( Holding 50% ) and wave 5 can start....

head and shoulders pattern EURUSD has formed a head and shoulders pattern and is now approaching the blue support zone. If the price breaks below this support level, it could signal a bearish move with the target set at the green line level.
📈 Technical Overview:
Pattern: Head and Shoulders
Support Zone: Blue area currently being approached.
🎯 Breakdown Target: Green line level upon confirmation of the breakdown
Euro may drop to 1.1200 points, exiting from pennant patternHello traders, I want share with you my opinion about Euro. Earlier, the price was growing steadily inside an upward pennant, following a strong breakout from the buyer zone. This impulse pushed the market higher toward the current support level at 1.1300, where the price found a temporary stabilization. Afterward, EUR moved into a range phase, trading sideways between local highs and lows. Despite several attempts to break higher, the market repeatedly showed weakness near the upper boundary, resulting in multiple turnarounds. Each bounce up was followed by lower highs, forming the descending resistance line of the pennant, while buyers defended the support area. Currently, the market is squeezed between the resistance and support lines, forming a classic compression pattern. Price action reveals increasing pressure on the support, and recent rebounds are becoming weaker, a clear sign of buyers losing momentum. In my view, the overall market situation has shifted from a strong bullish impulse toward a potential downside correction. So, given the breakdown structure forming and the price testing the lower side of the pennant multiple times, I expect a bearish breakout soon. My current TP1 is the 1.1200 points level. Please share this idea with your friends and click Boost 🚀

EURAUD H2 compression BUY/HOLD +150/300 pips🏆 EURAUD Market Update
📊 Technical Outlook
🔸Short-term: BEARS 7650/7700
🔸Mid-term: BULLS 8050/8150
🔸Status: compression wedge
🔸getting ready for a PUMP
🔸noteworthy compression in April
🔸Price Target Bears: 7650/7700
🔸Price Target BULLS: 8050/8150
📊 Forex & Gold Market Highlights – April 30, 2025
💶 EUR/USD Nears 1.1400
- Trading around 1.1390 amid softer U.S. economic data
- Investors await German economic indicators and U.S. PCE report
- April shows a 5.1% gain, the largest monthly increase since November 2022
💷 GBP/USD Hovers Near 1.3400
- Sterling trades at approximately 1.3379 after testing YTD highs
- U.S. JOLTS and Consumer Confidence data missed forecasts, fueling Fed rate cut speculation
🥇 Gold Retreats Below $3,310
- Spot gold at $3,302.58 per ounce, down 0.4%
- Decline follows easing trade tensions and a stronger U.S. dollar
- Investors focus on upcoming U.S. PCE data and non-farm payrolls report
📌 Market Outlook:
- EUR/USD: Potential to test 1.15 if German data supports euro strength
- GBP/USD: Eyes on U.S. economic data for direction; support around 1.3300
- Gold: Volatility expected; watch for U.S. economic indicators influencing Fed policy expectations

EURCHF - NEW BREAKOUT !Hello Traders !
On Wednesday 9 April, The EURCHF reached a strong support level.
The price broke the resistance (0.94090 - 0.93900).
This key level becomes new support !
So, I expect a bullish move🚀
______________
TARGET: 0.94830🎯

EURUSD below its 4H MA50 signals more selling.The EURUSD pair broke last Wednesday below its 4H MA50 for the first time since the start of April and is now consolidating under it. Within its 3-month Channel Up, this has always been a signal of more downtrend to come as it was technically halfway through the Bearish Legs of the pattern.
Given that the 4H MA200 (orange trend-line) is the medium-term Support, our Target is at 1.12500, just above the Internal Higher Lows trend-line. Check also the 4H RSI sequences between these 3 Bearish Legs. It is exactly ranging between the levels it did half-way through those Legs.
-------------------------------------------------------------------------------
** Please LIKE 👍, FOLLOW ✅, SHARE 🙌 and COMMENT ✍ if you enjoy this idea! Also share your ideas and charts in the comments section below! This is best way to keep it relevant, support us, keep the content here free and allow the idea to reach as many people as possible. **
-------------------------------------------------------------------------------
💸💸💸💸💸💸
👇 👇 👇 👇 👇 👇

Forex Grid Trading Overview: Practical Guide for 2025Forex Grid Trading Strategy: Detailed Overview & Low-Risk EUR/USD Application
1️⃣ What Is Grid Trading?
A grid trading strategy places a series of **buy** and **sell** orders at fixed intervals (“grid levels”) above and below a base price, without forecasting market direction. As price oscillates, it triggers orders across the grid, locking in small profits on each swing.
- **No Directional Bias** – Profits on both up- and down-moves
- **Automated Entry/Exit** – Ideal for Expert Advisors (EAs) on MT4/MT5
- **Scalable** – Grid size and lot sizing can be tailored to account size and volatility
2️⃣ How It Works – Core Components
1. **Grid Levels**
- Define a **base price** (e.g. current EUR/USD mid)
- Set **intervals** (e.g. every 20 pips) above/below the base
2. **Orders**
- **Buy Limit** orders at 20, 40, 60 pips below base
- **Sell Limit** orders at 20, 40, 60 pips above base
3. **Take Profit (TP) for Each Order**
- TP typically equals the grid interval (e.g. 20 pips) so each triggered order nets a small profit
- No hard Stop Loss per order—risk is managed via overall exposure
4. **Cumulative P&L**
- Winning trades roll profits into the floating drawdown of unfilled orders
- As price oscillates, the grid “locks in” incremental gains
3️⃣ Pros & Cons
| Pros | Cons |
|---------------------------------------|------------------------------------------|
| ✅ Profits in ranging markets | ❌ Can incur large drawdowns in strong trends |
| ✅ Automated, systematic execution | ❌ Requires significant margin for multiple open trades |
| ✅ Scalable to any time-frame | ❌ Floating negative exposure if grid one-sided |
---
✅Low-Risk Best Practices
1. **Grid Spacing & Width**
- Wider grid intervals (e.g. 30–50 pips) reduce order density and margin use
- Use **ATR** (Average True Range) to adapt spacing to EUR/USD volatility
2. **Lot Sizing & Equity Risk**
- Risk ≤ 1–2% equity per full grid cycle
- Use **fixed fractional** sizing: each order size = (Equity × 1%) / (max number of open grid orders)
3. **Drawdown Control**
- **Maximum Open Orders** cap (e.g. 5 orders per side)
- **Equity Stop-Out**: if floating drawdown exceeds e.g. 10% of equity, close all orders
4. **Trend Filters**
- Use a **200-period SMA** or **ADX** filter: only enable sell grid if price < SMA (downtrend) or ADX < 25 (low momentum)
- Disables grid in strong one-way trends
5. **Grid Shifting / Re-Base**
- After a net grid profit, **shift** the base price to current mid to reset exposure
- Prevents runaway open trades far from current price
5️⃣ Step-by-Step: Applying to EUR/USD
1. **Choose Time-Frame**
- **H4 or H1** recommended: balances signal frequency and margin needs
2. **Define Grid Parameters**
- **Base Price:** current EUR/USD mid (e.g. 1.0980)
- **Interval:** 30 pips (≈ recent ATR on H4)
- **Levels:** 3 buys at 1.0950 / 1.0920 / 1.0890; 3 sells at 1.1010 / 1.1040 / 1.1070
3. **Set Order Size**
- Account equity $10 000, risk 1% = $100 per full grid
- Max open orders 6 → each order $100/6 ≈ $16.7 → ≈ 0.02 lots
4. **Configure TP & No SL**
- Each order TP = 30 pips (equals interval)
- No per-order SL; overall drawdown managed by equity stop
5. **Implement Filters**
- Only open **sell** grid if H4 close < 200-SMA; only open **buy** grid if H4 close > 200-SMA
- Pause grid if ADX > 30 (strong trend) or market events (e.g. NFP, ECB rate decision)
6. **Deploy & Monitor**
- Run on MT4 with an EA or semi-automated Expert Advisor
- Monitor margin usage; adjust grid or disable before major news
6️⃣ Example P&L Mechanics
| Trigger Price | Order Type | Entry | TP Target | Profit (pips) |
|---------------|------------|---------|-----------|---------------|
| 1.0950 | Buy Limit | 1.0950 | 1.0980 | 30 |
| 1.0980 | Sell Limit | 1.0980 | 1.1010 | 30 |
- If price moves down to 1.0950: buy executes, TP at 1.0980 nets +30 pips
- If price then climbs above base, sells trigger at 1.1010 nets +30 pips
2️⃣ Introducing Progressive & Regressive Scaling
🔼 2.1 Progressive Scaling
“Let winners run”—increase exposure after success
Concept: After each profitable grid cycle, step up your lot size by a fixed increment.
Why: Capitalizes on momentum and winning streaks.
How to apply:
Base Lot: 0.02 lots per order (1% equity risk).
After grid closes net-positive, next cycle = 0.03 lots.
Continue stepping up (0.04, 0.05 …) until a drawdown or equity-stop is hit.
Reset back to base lot after a losing cycle or whenever floating drawdown > 5%.
Caps & Safeguards:
Max Lot Cap: Never exceed 0.10 lots (or 2% equity risk).
Equity Stop: If floating drawdown > 10%, close cycle & reset.
🔽 2.2 Regressive Scaling
“Protect the downside”—reduce exposure after losses
Concept: After a losing grid cycle, step down your lot size to conserve capital.
Why: Limits damage during rough periods and preserves margin.
How to apply:
Base Lot: 0.02 lots per order.
If grid hits equity-stop or nets negative, next cycle = 0.015 lots.
Continue stepping down (0.01, 0.005) until you record a net-positive cycle.
Reset to base lot after recovery (e.g. two consecutive winning cycles).
Thresholds:
Don’t drop below 0.005 lots (to avoid over-shrinking).
After two winning cycles at reduced lot, return to base.
✅ Bottom Line
Forex grid trading on EUR/USD can generate steady gains in choppy markets—but demands **strict risk controls** (grid spacing, lot sizing, drawdown limits) and **trend filters** to avoid large losses in trending conditions. When properly applied, a low-risk grid on EUR/USD offers a robust, mostly hands-off strategy for capturing repetitive market swings.
4️⃣ Key Takeaways
Progressive Scaling lifts lot sizes on winning streaks, amplifying gains—but must be capped and reset on losses.
Regressive Scaling shrinks exposure after drawdowns, preserving capital until the strategy recovers.
Combine both with your grid’s risk parameters, trend filter, and a solid equity-stop to maintain a balanced, low-risk EUR/USD grid.
By layering scaling rules atop your grid, you adapt dynamically to market performance—maximizing winners and protecting against prolonged losing runs. Good luck! 🚀

Euro may rebound from support line of wegde and continue growHello traders, I want share with you my opinion about Euro. For a while, price was consolidating in a flat range, bouncing between support near 1.0735 and resistance close to 1.0950 points. The price showed multiple rejections from the buyer zone, indicating strong interest from bulls around that area. Eventually, this led to a breakout to the upside, accompanied by a sharp impulse movement. After the breakout, the pair formed a steady upward wedge pattern, where both support and resistance lines were respected. This pattern helped channel the bullish pressure, allowing the price to gradually push higher while also offering clear correction zones. One of those zones, the support area, is particularly important. Price bounced off this area again recently, signaling that buyers are still in control. The market is currently recovering from a local correction and showing early signs of continued growth, as visible from the bounce off the wedge's support line and the area around the current support level. Given this structure, the breakout from range, the formation of the wedge, and the consistent support reaction, I expect the Euro may to continue its movement upward. So, that's why I set my TP at 1.1550 points. Please share this idea with your friends and click Boost 🚀

Euro H4 | Pullback resistance at 50% Fibonacci retracementThe Euro (EUR/USD) is rising towards a pullback resistance and could potentially reverse off this level to drop lower.
Sell entry is at 1.1426 which is a pullback resistance that aligns close to the 50.0% Fibonacci retracement.
Stop loss is at 1.1583 which is a level that sits a swing-high resistance.
Take profit is at 1.1274 which is a swing-low support that aligns close to the 38.2% Fibonacci retracement.
High Risk Investment Warning
Trading Forex/CFDs on margin carries a high level of risk and may not be suitable for all investors. Leverage can work against you.
Stratos Markets Limited (tradu.com):
CFDs are complex instruments and come with a high risk of losing money rapidly due to leverage. 63% of retail investor accounts lose money when trading CFDs with this provider. You should consider whether you understand how CFDs work and whether you can afford to take the high risk of losing your money.
Stratos Europe Ltd (tradu.com):
CFDs are complex instruments and come with a high risk of losing money rapidly due to leverage. 63% of retail investor accounts lose money when trading CFDs with this provider. You should consider whether you understand how CFDs work and whether you can afford to take the high risk of losing your money.
Stratos Global LLC (tradu.com):
Losses can exceed deposits.
Please be advised that the information presented on TradingView is provided to Tradu (‘Company’, ‘we’) by a third-party provider (‘TFA Global Pte Ltd’). Please be reminded that you are solely responsible for the trading decisions on your account. There is a very high degree of risk involved in trading. Any information and/or content is intended entirely for research, educational and informational purposes only and does not constitute investment or consultation advice or investment strategy. The information is not tailored to the investment needs of any specific person and therefore does not involve a consideration of any of the investment objectives, financial situation or needs of any viewer that may receive it. Kindly also note that past performance is not a reliable indicator of future results. Actual results may differ materially from those anticipated in forward-looking or past performance statements. We assume no liability as to the accuracy or completeness of any of the information and/or content provided herein and the Company cannot be held responsible for any omission, mistake nor for any loss or damage including without limitation to any loss of profit which may arise from reliance on any information supplied by TFA Global Pte Ltd.
The speaker(s) is neither an employee, agent nor representative of Tradu and is therefore acting independently. The opinions given are their own, constitute general market commentary, and do not constitute the opinion or advice of Tradu or any form of personal or investment advice. Tradu neither endorses nor guarantees offerings of third-party speakers, nor is Tradu responsible for the content, veracity or opinions of third-party speakers, presenters or participants.

EURUSD - Understanding PriceIn this video I go through what has been happening with EURUSD in the past week, where price has reached, where it is likely going, what has happened yesterday and where we are possibly going to go to today. Pretty straight forward stuff using good ol' ICT concepts.
I hope you find this video insightful, because it's the truth of the markets.
Good luck and happy trading!
- R2F Trading

Euro can drop from top part of range and fall to support levelHello traders, I want share with you my opinion about Euro. Recently, price continued to grow inside a well-defined upward channel, maintaining a steady structure of higher highs and higher lows. The move started after a clear breakout from the buyer zone, which marked a strong bullish impulse and confirmed support near the 1.0735 level. After this breakout, the price gradually climbed, eventually entering a horizontal range, where it started to consolidate between local support and resistance. The current support level has held firm and now aligns with the lower boundary of the range as well as the support area. At the moment, the Euro is approaching the upper boundary of the range. Given the repeated reactions from this resistance zone, I expect the price to make one more push upward, retesting the top of the range, and then reverse downward toward the lower boundary, with TP1 set at 1.1270, where demand and structure are likely to react again. This short-term setup aligns with the current channel structure, the strength of the support area, and the repeated rejection from the range highs. Please share this idea with your friends and click Boost 🚀

+300/+500 pips EURJPY Swing Trade Setup H4 TF🏆 EURJPY Market Update H4 chart
📊 Technical Outlook
🔸trading in well defined range
🔸Short-term: BULLS final pump
🔸Mid-term: BEARS 158.00
🔸Status: REVERSAL from S/R
🔸163.50/165.00 heavy resistances
🔸158.00/156.00 key s/r zones below
🔸Price Target Bears: 158
🔸Price Target BULLS: 1140/1160
🔸strategy: SHORT SELL 163.50
🔸SL 75 pips TP1 +300 pips TP2 +500 pips
🔸swing trade setup for patient traders
📊 Forex Market Update (April 23, 2025)
🇪🇺 EUR/USD
📉 Price: ~1.1380
💪 Pressure from strong USD
🔻 Weak German PMI; ECB may cut rates
⚠️ Key Levels: Support 1.1300 | Resistance 1.1400
🇬🇧 GBP/USD
📉 Price: ~1.3300 (Down from 7-month high at 1.3424)
🇺🇸 USD rebound on Trump's comments
🏦 Market cautious on BoE policy
⚠️ Key Levels: Support 1.3280 | Resistance 1.3420
🇺🇸 DXY (US Dollar Index)
📈 Price: 99.18 (Recovering from recent low 97.92)
🗣️ Boosted by Trump reassurance on Fed leadership
⚠️ Remains pressured by trade tensions & Fed concerns
📌 Key Levels: Support 95, 90 | Resistance 101, 107
🔔 Market Volatility Alert: Watch for geopolitical updates & central bank news closely!

Trump back off and so does the EUROWith the recent news of Trump backing off of Tariff enforcement and his decision to not fire the FED chair, the the EURO waterfalls back down fast as the bears takeover! I'm holding off until I can find reliable support and looking at a price target around 1.26'ish.

EURUSD | Short‑Term Pullback Meets First Support ZoneI know a lot of you have been watching EURUSD closely. With recent developments, we could see a modest dip before the next leg up in the euro.
What’s Driving the Dollar
End of Market Indecision
As uncertainty fades, the dollar’s safe‑haven appeal eases. Investors feel more confident stepping into riskier assets.
U.S.–China Dialogue
News that the U.S. and China are ready to resume high‑level talks removes a huge overhang. Less trade‑war fear means less upward pressure on USD.
Solid Economic Data
Last week’s jobless claims and employment figures were far from recession‑level weakness. That supports the dollar in the near term.
Short‑Term Outlook
Putting these factors together, EURUSD may unwind some of its recent gains. Sellers could push price lower into the blue box, which marks our first support area.
Long‑Term Perspective
Even so, remember that President Trump’s ongoing policy surprises tend to rattle confidence in the dollar over time. Once this short‑term pullback is over, the euro stands to resume its broader uptrend.
How to Trade It
Wait for price to dip into the blue box
Look for lower‑time‑frame bullish breaks confirmed by CDV signals
Enter a long only when you see a clean structure shift and volume support
If price breaks below the blue box without a retest, stay out or reassess
This approach keeps risk tight and lets the market prove itself first. Many traders jump in too early. If you follow these steps, you’ll join the move with conviction rather than guesswork. I’ve built my track record by trading exactly this way—patiently and with clear confirmations. Stay tuned and let’s capture the next leg up together.
📌I keep my charts clean and simple because I believe clarity leads to better decisions.
📌My approach is built on years of experience and a solid track record. I don’t claim to know it all but I’m confident in my ability to spot high-probability setups.
📌If you would like to learn how to use the heatmap, cumulative volume delta and volume footprint techniques that I use below to determine very accurate demand regions, you can send me a private message. I help anyone who wants it completely free of charge.
🔑I have a long list of my proven technique below:
🎯 ZENUSDT.P: Patience & Profitability | %230 Reaction from the Sniper Entry
🐶 DOGEUSDT.P: Next Move
🎨 RENDERUSDT.P: Opportunity of the Month
💎 ETHUSDT.P: Where to Retrace
🟢 BNBUSDT.P: Potential Surge
📊 BTC Dominance: Reaction Zone
🌊 WAVESUSDT.P: Demand Zone Potential
🟣 UNIUSDT.P: Long-Term Trade
🔵 XRPUSDT.P: Entry Zones
🔗 LINKUSDT.P: Follow The River
📈 BTCUSDT.P: Two Key Demand Zones
🟩 POLUSDT: Bullish Momentum
🌟 PENDLEUSDT.P: Where Opportunity Meets Precision
🔥 BTCUSDT.P: Liquidation of Highly Leveraged Longs
🌊 SOLUSDT.P: SOL's Dip - Your Opportunity
🐸 1000PEPEUSDT.P: Prime Bounce Zone Unlocked
🚀 ETHUSDT.P: Set to Explode - Don't Miss This Game Changer
🤖 IQUSDT: Smart Plan
⚡️ PONDUSDT: A Trade Not Taken Is Better Than a Losing One
💼 STMXUSDT: 2 Buying Areas
🐢 TURBOUSDT: Buy Zones and Buyer Presence
🌍 ICPUSDT.P: Massive Upside Potential | Check the Trade Update For Seeing Results
🟠 IDEXUSDT: Spot Buy Area | %26 Profit if You Trade with MSB
📌 USUALUSDT: Buyers Are Active + %70 Profit in Total
🌟 FORTHUSDT: Sniper Entry +%26 Reaction
🐳 QKCUSDT: Sniper Entry +%57 Reaction
📊 BTC.D: Retest of Key Area Highly Likely
📊 XNOUSDT %80 Reaction with a Simple Blue Box!
📊 BELUSDT Amazing %120 Reaction!
I stopped adding to the list because it's kinda tiring to add 5-10 charts in every move but you can check my profile and see that it goes on..

EURUSD 3 TARGETS for selling 3 TOPS. The 5 year cheat-sheet!The EURUSD pair opened the week with a strong rally already due to the fundamentals surrounding the recent Tariff news. The 1W RSI is overbought at 74.00 and it hasn't been that high since January 22 2018. That was a long-term Top for EURUSD that initiated a 2-year downtrend until the March 2020 COVID crash and the start of massive rate hiking.
Even the last two times that the RSI came close to such overbought levels, the pair started a 6-month peak formation pattern with 3 Highs that offered solid short entries before the eventual larger downtrend. Those periods were January 30 2023 - July 17 2023 and August 31 2020 - May 24 2021.
Given that EURUSD is now trading within a long-term Channel Up (blue) and just formed a 1D MA50/ 1W MA50 Bullish Cross, we are closer to High (1) than not, since every time that is formed close to the standard +16.19% rise from the bottom.
For those successive Highs, our long-term sell targets will be 1.12500, 1.13250 and 1.12000 on the 0.382 Fibonacci retracement level respectively.
-------------------------------------------------------------------------------
** Please LIKE 👍, FOLLOW ✅, SHARE 🙌 and COMMENT ✍ if you enjoy this idea! Also share your ideas and charts in the comments section below! This is best way to keep it relevant, support us, keep the content here free and allow the idea to reach as many people as possible. **
-------------------------------------------------------------------------------
Disclosure: I am part of Trade Nation's Influencer program and receive a monthly fee for using their TradingView charts in my analysis.
💸💸💸💸💸💸
👇 👇 👇 👇 👇 👇

Euro may correct to support area and then rebound upHello traders, I want share with you my opinion about Euro. Looking at the chart, we can see that the price started its growth from the buyer zone between 1.0730 - 1.0785 points, where the price found strong support near the lower boundary of the broadening wedge. After bouncing off that zone, Euro gained momentum and made an impulsive move upward, breaking through the resistance line and establishing a bullish trajectory. Once the pair overcame the 1.1265 level, which is now acting as current support, the price entered a period of consolidation inside the support area between 1.1310 - 1.1265 points. This zone is showing signs of strength again, with the price attempting to stabilize above it. The overall structure continues to respect the boundaries of the broadening wedge, with higher highs and higher lows confirming bullish control. At the moment, EUR is correcting slightly after reaching local highs and is approaching the support area again. A healthy pullback toward 1.1310 - 1.1265 would be in line with the pattern and could trigger the next bullish impulse. Given the ongoing upward structure, the strong support area, and the clear wedge formation, I expect Euro to continue growing toward the upper wedge boundary near 1.1555 points, which is my current TP1. Please share this idea with your friends and click Boost 🚀
