EUR/USD Daily Chart Analysis For Week of June 27, 2025Technical Analysis and Outlook:
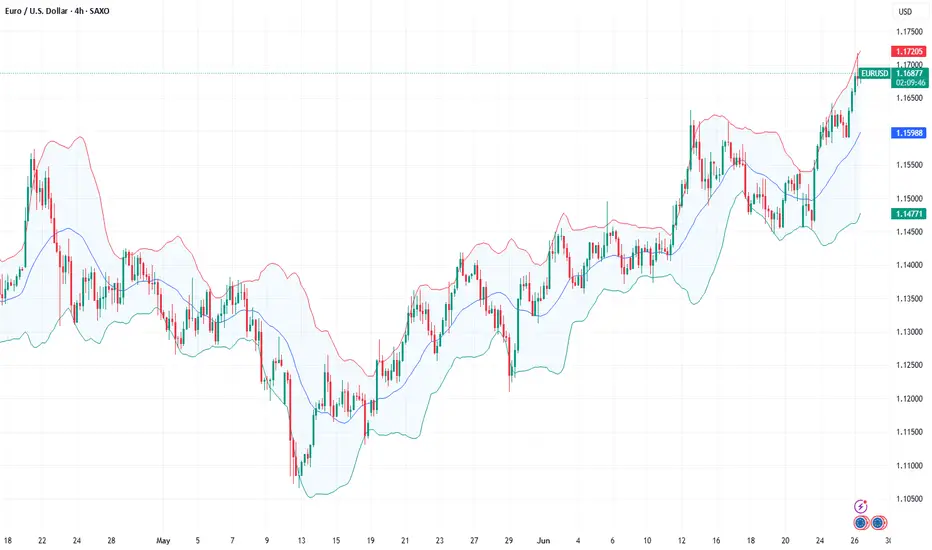
In the course of this week's trading session, the Eurodollar has exhibited a strong rebound, successfully retesting and surpassing the Outer Currency Rally threshold of 1.163. Recent analyses suggest that the Euro is poised for further upward advancement, with the key target to reach the outer currency rally target of 1.177. Nonetheless, it is essential to recognize the possibility of a subsequent decline to the Mean Support level of 1.160 before a definitive upward movement.
Eurodollar

EUR/USD Pair Hits Yearly HighEUR/USD Pair Hits Yearly High
Yesterday, the EUR/USD exchange rate rose above the 1.1700 level for the first time this year. The last time one euro was worth more than 1.70 US dollars was in autumn 2019.
The main driver behind the euro’s rise is the weakening dollar, largely due to decisions made by the Trump administration. This week alone, the EUR/USD pair has gained more than 2%, partly as a result of escalating tensions between the US President and the Chair of the Federal Reserve.
According to Reuters, Trump called Powell “terrible” and said he had three or four candidates in mind for the top job at the Fed. It was also reported that Trump had considered selecting and announcing a replacement for Powell by September or October (his current term officially runs until May 2026).
Technical Analysis of the EUR/USD Chart
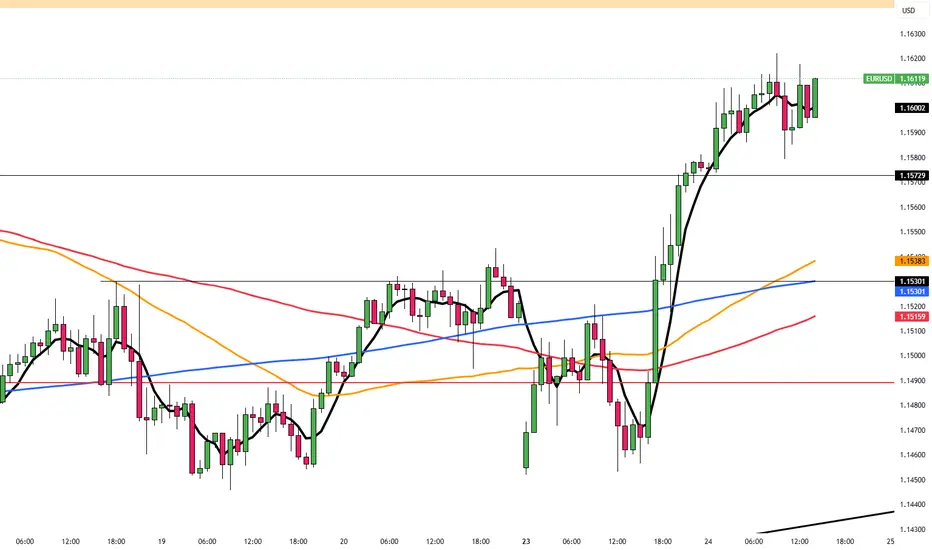
Price movements are forming an upward channel (highlighted in blue), with the following observations:
→ Midweek, the price consolidated around the channel’s median line (as indicated by arrow 1);
→ It then broke through the 1.6300 level with strong bullish momentum (shown by arrow 2), a level that had acted as resistance earlier in the month;
→ The long upper wicks on the candles forming yesterday’s highs (circled) suggest increased selling pressure near the upper boundary of the channel.
Given this, we could assume that in the short term, the price might form a new consolidation zone around the median line above the 1.6300 level. Significant fundamental catalysts would be required to break the developing upward trend.
This article represents the opinion of the Companies operating under the FXOpen brand only. It is not to be construed as an offer, solicitation, or recommendation with respect to products and services provided by the Companies operating under the FXOpen brand, nor is it to be considered financial advice.

Fundamental Market Analysis for June 26, 2025 EURUSDThe EUR/USD pair continues to rise to 1.16800 during Thursday's Asian session. The US dollar (USD) is weakening against the euro (EUR) as investors worry about the future independence of the US Federal Reserve (Fed). Final data on US GDP growth for the first quarter will be in focus later on Thursday.
US President Donald Trump said on Wednesday that he is considering three or four potential candidates to replace Fed Chairman Jerome Powell. According to the Wall Street Journal, Trump may consider former Fed Governor Kevin Warsh, National Economic Council Director Kevin Hassett, and Treasury Secretary Scott Bessent. Other candidates include former World Bank President David Malpass and Fed Governor Christopher Waller.
This raises questions about a potential weakening of the Fed's independence and a possible decline in its authority, which undermines the dollar and creates favorable conditions for the major currency pair.
Across the Atlantic, European Central Bank (ECB) policymakers are concerned about the economic outlook due to Trump's tariff policy and geopolitical risks. Earlier this week, ECB policymaker François Villeroy de Galhau said that despite current conditions, further rate cuts are still possible. Statements by ECB policymakers may put pressure on the single currency in the near term.
Trading recommendation: BUY 1.16750, SL 1.16300, TP 1.17500
EUROUSD updates chartEUR/USD Sell Setup Active 🔻
Pair rejected key resistance zone near 1.0740 – entering sell position now.
📉 Short-term momentum favoring bears.
🎯 Target: 1.0650 → 1.0600
🛑 Stop Loss: Above 1.0755
🕰️ H1/H4 confluence confirms downside pressure.
Trendline + RSI divergence = high-probability short!
📌 Plan the trade. Trade the plan.

EUR/USD Nears 1.1620 Before Powell’s TestimonyEUR/USD edged up to 1.1615 in early European trading on Wednesday, supported by improved risk sentiment after Israel and Iran signaled an end to their air conflict. The truce, backed by pressure from President Trump, increased appetite for risk assets, favoring the euro over the dollar.
All eyes are now on Fed Chair Jerome Powell, who reiterated on Tuesday that monetary policy will remain data-driven. However, comments from Kansas City Fed President Schmid hinted at caution due to tariff-driven inflation. While markets expect a rate cut in September, July odds have edged slightly higher.
Resistance is at 1.1630, while support is at 1.1530.

EUR/USD Hits Weekly High as Ceasefire Weakens DollarEUR/USD climbed to a fresh weekly high near 1.1610 during late Asian trading on Tuesday, boosted by a sharp sell-off in the US Dollar following the announcement of a ceasefire between Israel and Iran by President Donald Trump. The truce improved market risk appetite and dampened demand for traditional safe havens like the US Dollar. As a result, the US Dollar Index (DXY) dropped steeply from Monday’s two-week high of 99.42 to around 98.10.
The dollar also came under pressure from shifting expectations around Fed policy. On Monday, Fed Governor Michelle Bowman signaled support for a potential rate cut as early as the July meeting, citing rising concerns over the labor market. “We should put more weight on downside risks to the job market,” she stated, adding that it's time to consider adjusting the policy rate.
Her dovish tone nudged up expectations for a July rate cut, with CME FedWatch data showing the probability rising from 14.5% on Friday to 22.7%.
In the Eurozone, ECB officials expressed concerns over the region’s economic outlook, particularly considering new US tariff policies. President Christine Lagarde, in remarks to the European Parliament, warned that inflation staying near the 2% target is uncertain and noted that survey data points to “some weaker prospects for economic activity in the near term.” She added that risks to growth remain “tilted to the downside.”
Resistance is located at 1.1630, while support is seen at 1.1530.
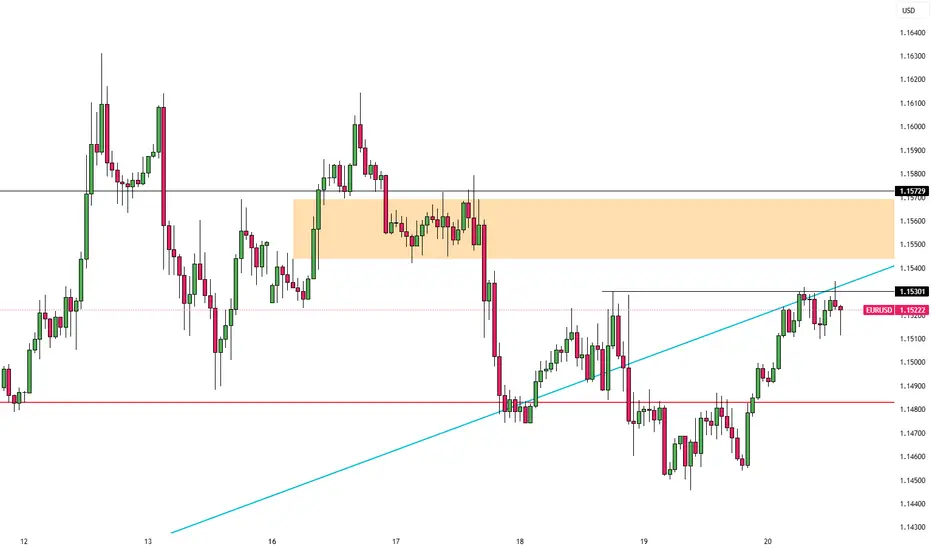
EUR/USD 2-Hour Chart Analysis2-hour candlestick chart for the Euro/U.S. Dollar (EUR/USD) currency pair, sourced from OANDA, as of June 23, 2025. The current exchange rate is 1.14705, reflecting a 0.45% decrease (-0.00517). The chart highlights recent price movements, with a marked resistance zone around 1.15218 and a support zone near 1.14483. An upward trend is indicated with an arrow, suggesting potential price action toward the resistance level.

Fundamental Market Analysis for June 23, 2025 EURUSDThe EUR/USD exchange rate fell to around 1.14900 at the start of the Asian session on Monday. The US dollar is strengthening against the euro (EUR) amid US President Donald Trump's decision to join Israel's war against Iran, which has sharply escalated the conflict. Traders will closely monitor developments surrounding the conflict in the Middle East.
Over the weekend, the US entered the conflict between Israel and Iran when American military aircraft and submarines struck three Iranian targets in Iran, Fordow, Natanz, and Isfahan. Trump said Iran's key uranium enrichment facilities had been “totally destroyed” and warned of “much more severe” strikes if Iran did not agree to peace. The rise in tensions following the US bombing of Iranian nuclear facilities is contributing to the rise in safe-haven currencies such as the US dollar and is having a negative impact on the major currency pair.
Earlier this month, the European Central Bank (ECB) cut interest rates for the eighth time this year to support the eurozone's sluggish recovery, but made it clear that there would be a pause in July. ECB President Christine Lagarde said that rate cuts are coming to an end, as the central bank is now “well positioned” to deal with the current uncertainty. The ECB's hawkish tone may help limit the euro's losses in the near term.
Trading recommendation: BUY 1.15000, SL 1.14600, TP 1.15800

EURUSD -> Bullish Idea 22/06/2025(ICT x Volume Profile)OANDA:EURUSD 🎯 Bias: Bullish
🕒 Timeframe: H1 primary, H15 confirmation
Happy sunday traders!
Following President Trump’s strikes on Iran, I expect an initial bearish reaction in the Asian and London Sessions, then a bullish reaction in the NY sessions as sellers push the USD lower. However, the prevailing trend context remains bullish: the hourly chart has shifted structure (MSS) and broke structure to the upside. I anticipate a liquidity sweep below the recent lows, before a retracement into the 15-minute fair value gap (FVG) which aligns with the volume profile, then continuation higher to target the weak high and into the swing highs marked.

EUR/USD Daily Chart Analysis For Week of June 20, 2025Technical Analysis and Outlook:
During this week's trading session, the Eurodollar has encountered a significant decline, dipping below the Mean Support level of 1.149; however, it exhibited a modest recovery on Friday. Recent analyses indicate that the Euro is likely to decrease further to the Mean Support level of 1.148, with the potential for extending its bearish trend to reach 1.140. Nevertheless, there remains a possibility that the current recovery will persist, which could result in price movements targeting the Key Resistance level at 1.158 and potentially leading to a retest of the Outer Currency Rally's 1.163 mark.

EUR/USD Slips as Fed Stays HawkishEUR/USD hovered near 1.1520 during Friday’s Asian session, extending gains for a third day as the US dollar weakened, likely due to a technical pullback. However, the greenback may rebound as safe-haven demand grows amid rising tensions between the US and Iran.
Citing senior US intelligence, The New York Times reported that Iran hasn’t yet decided to pursue nuclear weapons, despite having enriched uranium reserves. Meanwhile, the Senate Intelligence Committee Chair said President Trump is set to offer Iran one final window to negotiate before considering military action, potentially delaying any decisions for up to two weeks.
Markets are also awaiting Friday’s Monetary Policy Report from the Federal Reserve, which will provide fresh insights into the Fed’s stance. On the Euro side, the ECB’s hawkish outlook offered additional support, with President Christine Lagarde suggesting rate cuts may soon end as the central bank remains “well positioned” to handle persistent risks.
Resistance is located at 1.1530, while support is seen at 1.1450
EUR/USD 2-Hour Chart Analysis2-hour performance of the Euro/U.S. Dollar (EUR/USD) currency pair, showing a recent decline with a change of -0.00134 (-0.12%) to a current value of 1.14676. The chart includes key levels such as a support zone around 1.14012-1.14457 and a resistance zone near 1.15000-1.15509. A breakout above the resistance could indicate a potential upward trend, as suggested by the highlighted area.

EUR/USD Slips as Fed Stays HawkishEUR/USD fell toward 1.1465 in Thursday’s Asian session, pressured by a risk-off mood as Middle East tensions rise. The focus shifts to speeches from ECB officials Lagarde, Nagel, and de Guindos for further guidance.
On Wednesday, the Fed held rates at 4.25%–4.50% and signaled a slower pace of cuts, citing inflation risks from Trump’s new tariffs. The FOMC still projects two cuts in 2025
Bloomberg reported the US may strike Iran in the coming days, raising safe-haven demand for the dollar and adding pressure on the euro. ECB’s Lagarde said rate cuts are nearly done and that the ECB is well-positioned to manage current uncertainties.
Resistance is located at 1.1475, while support is seen at 1.1415

Market Analysis: EUR/USD Faces RejectionMarket Analysis: EUR/USD Faces Rejection
EUR/USD declined from the 1.1640 resistance and traded below 1.1550.
Important Takeaways for EUR/USD Analysis Today
- The Euro started a fresh decline after a strong surge above the 1.1600 zone.
- There is a connecting bearish trend line forming with resistance at 1.1545 on the hourly chart of EUR/USD at FXOpen.
EUR/USD Technical Analysis
On the hourly chart of EUR/USD at FXOpen, the pair rallied above the 1.1600 resistance zone before the bears appeared, as discussed in the previous analysis. The Euro started a fresh decline and traded below the 1.1550 support zone against the US Dollar.
The pair declined below 1.1520 and tested the 1.1475 zone. A low was formed near 1.1475 and the pair started a consolidation phase. There was a minor recovery wave above the 1.1495 level.
The pair tested the 23.6% Fib retracement level of the downward move from the 1.1614 swing high to the 1.1475 low. EUR/USD is now trading below 1.1550 and the 50-hour simple moving average. On the upside, the pair is now facing resistance near the 1.1505 level.
The next key resistance is at 1.1545 and the 50% Fib retracement level of the downward move from the 1.1614 swing high to the 1.1475 low. There is also a connecting bearish trend line forming with resistance at 1.1545.
The main resistance is near the 1.1580 level. A clear move above the 1.1580 level could send the pair toward the 1.1615 resistance. An upside break above 1.1615 could set the pace for another increase. In the stated case, the pair might rise toward 1.1650.
If not, the pair might resume its decline. The first major support on the EUR/USD chart is near 1.1475. The next key support is at 1.1450. If there is a downside break below 1.1450, the pair could drop toward 1.1400. The next support is near 1.1350, below which the pair could start a major decline.
This article represents the opinion of the Companies operating under the FXOpen brand only. It is not to be construed as an offer, solicitation, or recommendation with respect to products and services provided by the Companies operating under the FXOpen brand, nor is it to be considered financial advice.

Fundamental Market Analysis for June 18, 2025 EURUSDEvent to pay attention to today:
12:00 EET. EUR - Consumer Price Index
15:30 EET. USD - Unemployment Claims
21:00 EET. USD - FOMC Rate Decision
Declining confidence in the US economy amid trade policy is undermining the US Dollar (USD) against the Euro (EUR). Data released by the US Census Bureau on Tuesday showed that US retail sales fell 0.9% m/m in May, compared to a 0.1% decline (revised from +0.1%) recorded in April. The figure was weaker than estimates of -0.7%. Meanwhile, US industrial production in May declined 0.2% m/m vs. 0.1% previously (revised from 0%), worse than expectations of 0.1%.
Traders expect the US Federal Reserve to leave borrowing costs unchanged at its June meeting on Wednesday. Markets now estimate a nearly 80% chance that the Fed will cut rates in September and then another in October, according to Reuters.
The mood of European Central Bank (ECB) policymakers is supportive of the common currency. ECB President Christine Lagarde said that rate cuts are coming to an end as the central bank is now in a “good position” to deal with the current uncertainty.
Meanwhile, investors will keep an eye on geopolitical risks. Israel is set to step up strikes on Tehran, while the US is considering expanding its role amid rising tensions between Israel and Iran.
Trade recommendation: SELL 1.1460, SL 1.1560, TP 1.1260

ECB’s De Guindos Sees Balanced Inflation RisksEuropean Central Bank Vice President Luis de Guindos said Monday that the EUR/USD at 1.15 does not hinder the ECB’s inflation goal, noting the euro’s gradual rise and stable volatility.
He stated inflation risks are balanced, with little chance of falling short of the target, and that markets have clearly understood the ECB’s recent policy signals. De Guindos reaffirmed the ECB is close to its inflation objective
Looking ahead, he warned that tariffs could slow growth and inflation in the medium term but expressed confidence in the Fed maintaining swap line arrangements. He also confirmed there have been no discussions about repatriating gold reserves from New York.
At the time, EUR/USD was down 0.09%, trading near 1.1537.
Resistance is located at 1.1580, while support is seen at 1.1460.

EUR/USD Daily Chart Analysis For Week of June 13, 2025Technical Analysis and Outlook:
During the current trading session, the Eurodollar has exhibited notable volatility, mirroring patterns observed in the preceding week. The currency has surpassed both the Mean Resistance level of 1.145 and the Key Resistance level of 1.151, subsequently retesting the significant completed Outer Currency Rally level at 1.157.
Recent analyses indicate that the Euro is likely to revisit both the Key Resistance and the completed Outer Currency Rally and expand further to the next Outer Currency Rally of 1.177 in the forthcoming trading session(s). However, there exists a potential for a continuation of the downward trend from the current level, which could lead to the price action targeting the Mean Support level at 1.149 and possibly a further extension to the Mean Support level at 1.140.

(iFVG) before continuing its fall.EUR/USD is now ready to move downward. The market has already cleared out all the liquidity above, which suggests that it's now in the mood to drop. Earlier, on the 4-hour timeframe, the market had formed a bullish Fair Value Gap (FVG), but that has now been broken to the downside.
Currently, there are chances that the market might touch the imbalance (iFVG) before continuing its fall. Keep an eye on that level and observe how the market reacts there. It could be an important zone.
Do Your Own Research (DYOR)! This is not financial advice.

EUR/USD tests three-year ceiling Aside from a brief spike in April, EUR/USD has remained below 1.1500 for over three years.
Sellers again have had to defend the zone following the weaker-than-expected US CPI release. The main resistance zone potentially spans all the way up to 1.1573 (the April high).
Some indicators suggest potential room for further upside. The Relative Strength Index (RSI) has not yet reached overbought territory, and the Daily Moving Average is positively sloped. A break below the 4-hour Moving Average could trigger more selling pressure and a potential correction.

EUR/USD Daily Chart Analysis For Week of June 6, 2025Technical Analysis and Outlook:
During the current trading session, the Eurodollar has exhibited notable volatility, mirroring patterns observed in the previous week. The currency surpassed a significant Mean Resistance level of 1.142 and encountered substantial resistive price action near the crucial Key Resistance level of 1.151. Recent analyses indicate that the Euro is likely to approach the critical Mean Support level at 1.137 and may decline to the subsequent Mean Support level at 1.129. Nevertheless, there exists the possibility of an upward movement from the current level or the Mean Support at 1.137, which could result in a target Mean Resistance of 1.145 and a retest of the Key Resistance at 1.151.

ECB Cuts Rates. EUR/USD Spikes to 1.5-Month HighECB Cuts Rates. EUR/USD Spikes to 1.5-Month High
Yesterday, as widely expected, the European Central Bank (ECB) cut interest rates for the eighth time since May 2024. According to ForexFactory, the main refinancing rate was lowered from 2.40% to 2.15% (having stood at 4.50% in May 2024).
According to Reuters:
→ ECB President Christine Lagarde stated that interest rates are now at a “good level”, despite the extremely high uncertainty caused by tariff threats from President Donald Trump.
→ Following the press conference, markets interpreted the message as a sign that the ECB is unlikely to cut rates again at its next meeting in July.
In response to the ECB's decision, the EUR/USD rate jumped to its highest level in a month and a half, but later retreated (as indicated by the arrow) back to previous levels.
Technical Analysis of the EUR/USD Chart
Four days ago, while analysing the EUR/USD chart, we:
→ drew an ascending channel;
→ suggested that bullish momentum could push the EUR/USD rate up to the psychological level of 1.1500 during the current week.
In fact, at yesterday’s peak, the rate came very close to 1.1500. However, a candlestick with a long upper shadow had formed on the EUR/USD chart, by the end of the day. Additionally, this morning, the 1.1450 level has acted as a resistance zone.
This suggests bearish activity, which could pull the rate down towards the lower boundary of the local channel (outlined in black), and possibly even attempt a breakout below it.
This article represents the opinion of the Companies operating under the FXOpen brand only. It is not to be construed as an offer, solicitation, or recommendation with respect to products and services provided by the Companies operating under the FXOpen brand, nor is it to be considered financial advice.

Fundamental Market Analysis for June 5, 2025 EURUSDThe EUR/USD pair is trading cautiously, slightly above the key level of 1.14000 during Thursday's Asian trading session. The major currency pair is expected to remain in a sideways trend as investors await the European Central Bank's (ECB) interest rate decision.
The ECB is almost certain to cut its key lending rates by 25 basis points (bps), bringing the deposit rate and the main refinancing rate to 2% and 2.15%, respectively. This will be the ECB's seventh consecutive interest rate cut and the eighth since June last year, when it began its cycle of monetary expansion.
Traders are increasingly confident of a seventh consecutive ECB interest rate cut as deflationary trends persist in the eurozone. Preliminary data from the eurozone's harmonized index of consumer prices (HICP) released on Tuesday showed that inflationary pressure fell below the central bank's 2% target.
With the Fed widely expected to cut interest rates, investors will be watching ECB President Christine Lagarde's press conference closely for clues on likely monetary policy in the second half of the year. Market participants would also like to hear about the progress of trade negotiations with the US.
Meanwhile, the US dollar (USD) is struggling to stay near a six-week low as weak US data has reignited stagflation risks. The ISM Services PMI unexpectedly declined in May, while its components showed that production costs continue to rise rapidly. ADP employment change data, which reflects labor demand in the private sector, showed that 37,000 new jobs were created in May, the lowest figure since February 2021.
Trading recommendation: SELL 1.14100, SL 1.14400, TP 1.13600

"STOXX50/EURO50" Trading Plan: Ride the Wave or Get Trapped?🚨 EUROPEAN INDEX HEIST: STOXX50 Breakout Robbery Plan (Long Setup) 🚨
🌟 Hi! Hola! Ola! Bonjour! Hallo! Marhaba! 🌟
Attention Market Bandits & Index Robbers! 🏦💶💸
Using 🔥Thief Trading tactics🔥, we're targeting the STOXX50/EURO50 for a clean breakout heist. The plan? Go long and escape before the MA trap snaps shut. Overbought? Yes. Risky? Absolutely. But real thieves profit when weak hands panic. Take your cut and run! 🏆💰
📈 ENTRY: TIME TO STRIKE!
Wait for MA breakout at 5460.00 → Then move fast!
Buy Stop Orders: Place above Moving Average
Buy Limit Orders: Sneak in on 15M/30M pullbacks
Pro Tip: Set a BREAKOUT ALARM - don't miss the action!
🛑 STOP LOSS: DON'T GET CAUGHT!
For Buy Stop Orders: Never set SL pre-breakout - amateurs get burned!
Thief's Safe Zone: Recent swing low (5300.00 on 4H chart)
Rebels: Place SL wherever... but don't cry later! 😈
🏴☠️ TARGET: 5680.00 (OR ESCAPE EARLY!)
Scalpers: Long only! Trail your SL like a pro
Swing Traders: Ride this heist for max gains
💶 MARKET CONTEXT: BULLISH BUT TRAPPY
Fundamentals: Macro data, COT reports, Quant analysis
Market Sentiment: Intermarket flows, positioning
Full Analysis: Check our bio0 linkss 👉🔗 (Don't trade blind!)
⚠️ WARNING: NEWS = VOLATILITY TRAP!
Avoid new trades during high-impact news
Lock profits with trailing stops - greed gets you caught!
💥 SUPPORT THE HEIST!
Smash that Boost Button 💖→ Stronger crew = bigger scores!
Steal profits daily with the Thief Trading Style 🎯🚀
Next heist coming soon... stay sharp! 🤑🐱👤🔥
