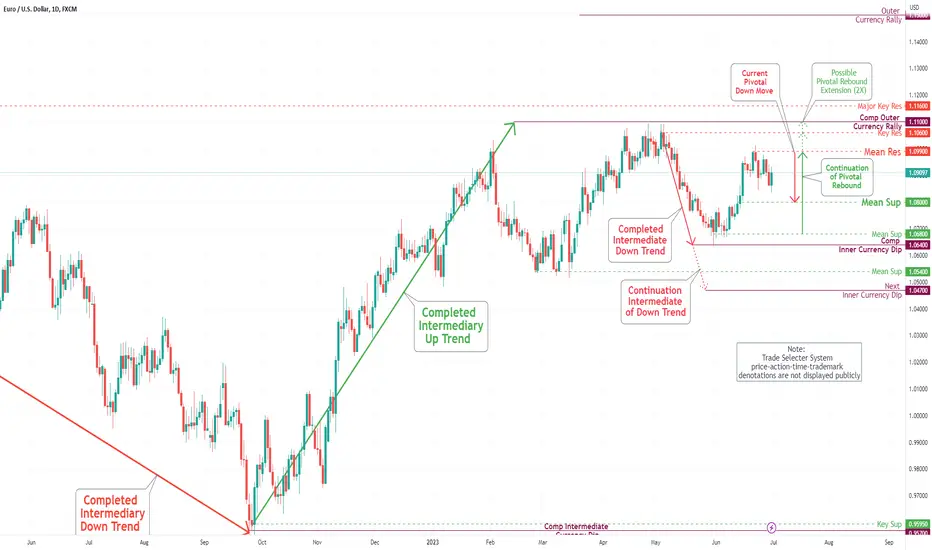
EUR/USD Daily Chart Analysis For Week of July 7, 2023Technical Analysis and Outlook:
This week, the Eurodollar did its Jumpgate performance. It established the newly created Mean Sup 1.085, indicating its potential to retest the completed Outer Currency Rally with determination. However, the price may decrease to Mean Sup 1.099 (the opposite of Mean Res) before returning to the crime scene.
Eurodollar

Eurusd Pulls up to end the week 📺The Weekly candle has flipped bullish with NFP data as I outlined as a possible scenario in yesterday's publishing and appears to be now headed towards 1.096 Daily resistance zone( Also the other side of the daily range). We are currently above 1.091 daily resistance zone and closed at this level with the 4hr candle. The 4hr candle closed quite strongly bullish. We have done a retest at our previous 4h resistance zone(1.09) which has just acted as a support level 40 minutes ago. We are seeing a bullish push to end off the week here and I think it may continue towards 1.0936 and 1.096 Daily resistance zone. We are consistently holing above 1.091 daily resistance zone and the 4hr close has given us confirmation that we may continue up. We have now gotten 2 1hr candles and 1 4hr candle close above 1.091 daily resistance zone. It may act as a support now after we have recieved candle closure confirmation on the 1hr/4hr timeframes.
I was originally looking for sell positions on Eurusd with NFP. Instead we saw that —> 1) I Identified that NFP data was expected to decrease overall from the prior period ( Not a positive for USD) 2) The data was worse than what was forecasted by analysts' ( Not good for USD) 3) Price printed a strong daily candle closure back inside our daily timeframe range with yesterday's daily candle. Our daily timeframe range being between 1.085-6 Daily Support and 1.096 Daily Resistance
1 Trade today. Buy Stops with NFP
Explanation :
So price created a Daily resistance zone on Monday. On Tuesday it respected the daily resistance zone and moved down accordingly. I placed my buy stop position above this high of Tuesday's price. One position closed for +8 Pips, Other position closed for +9.3 Pips 💰. My target was the next 1hr resistance zone as we noted in yesterday's publishing at 1.0936. I secured partial positions and extend my Take Profit to 8-10 Pips during news trading and Lowered my position size accordingly.
Data

Thoughts on Eurusd Prior to July NFP!📢Another video reflecting on what's occurred in the last 24 hours, our current key level's, and thoughts prior to July NFP data. In the previous publishing I talked about how we should anticipate a pullback from the lows of structure. Price did indeed pullback for 1.08370 4hr support zone and did so throughout london all the way back to our key 1.09 4hr resistance level. With New york session open ( which was accompanied by ADP and Unemployemnt cliams data) price did a continuation of our previous downtrend on the week. I outlined yesterday that the market often uses Red folder news releases as a catalyst for a continuation of momentum. Throughout the week it's easy to identify that we've had bearish pressure and no wonder this is what we observed. It appears though that players took profit and price once again pulled back up from the lows of strucutre after we saw a continuation occur with news. What a volatile day it was today with plenty of opportunity. Expected nothing less of another Thursday in the markets. I did not participate since I've already reached my goal on the week but it is quite fun to observe from the sidelines.
What to look for : If price pulls up towards 1.09 and 1.091 daily resistance level, observe how candle's close around there. This may clue us on what may occur with NFP. As the weekly candle pulls back up on thursday and once again back into our daily range, I can see a potential increase for Friday's candle to end the week. Price looks like it's squeezing on the Daily timeframe and we may be awaiting an increase back to 1.096 daily resistance and 1.1024 in the coming day and moving into next week.
If price pulls down and then back up prior to nfp data , I may be looking to set a sell stop with NFP data.

EUR/USD -6/7/2023-• Blurry technical picture for the Euro currency and the trend is turning into neutral
• Bullish ascending trend line since October 2022 intact, supporting the price
• We have a potential short term descending triangle, a bearish formation usually
• If the sellers manage to break below the triangle, the pair might be facing a 150-200 pips move lower according to the triangle breakout projection method
• There is a strong area of resistance between 1.10 and 1.11 and the bullish trend won't gain momentum unless the bulls manage to break above it
• To the downside, supports level align at 1.08-1.0820 (ascending trend line and triangle support) followed by 1.064 (previous swing low) and 1.05
• Unless we see a very bad or very good NFP report, I suspect we are going to stay in a trading range between 1.08 and 1.10-1.11

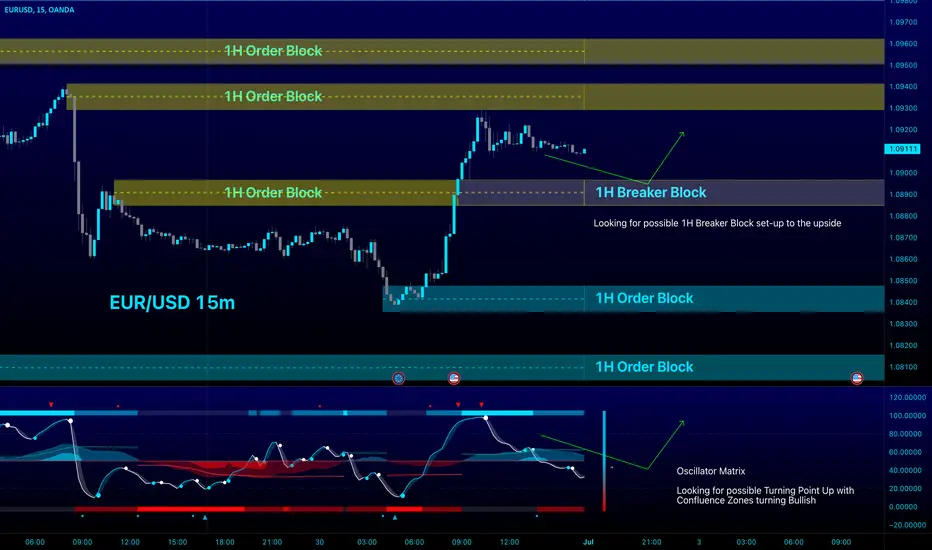
EUR/USD - I wanted to fight this Order BlockOANDA:EURUSD
I know I shouldn't had taking the short at these 1H & 15m OB's, but that's why I only wanted TP on the other side of the OB's, and be done with it.
Virtually no drawn down, I think my draw down was the initial spread.
Nice, right?

Thursday Daily Candle Incoming 🤯--> Continuation ( 6 minutes video 😎 ) As We approach the end of the week, We may observe alot of momentum! My mentors always told me that the market is setting up early in the week. The avalanche later in the week will provide plenty of opportunity for the disciplined trader to implement a trading system.
Price was at 1.08892 during our last publishing 24 hours ago. Price consolidated during Asian and London Sessions before gaining enough liquidity to see a breakout to the downside. Price is currently headed towards 1.08384 where we may see a bounce as we head into london session. If not then price is headed towards 1.081 4hr support zone as our next bearish target. Price has confirmed a breakout to the downside and I'm anticipating a pullback before my sells. If not then I anticpate a pullback with our 4 news releases tomorrow durng new york session. We could see all three sessions be bearish and it s thursday so I wouldn't be surprises. Must keep this in mind and plan for every scenario. I've outlined that good pullback prices look to me to be arouns 1.08628-1.0875
I've already met my weekly goal of 2% and I am quite a happy camper. 2 Weeks ago I recall I was up about 2.5% (.5% more than my goal) and I trade on a friday where I proceeded to give back 1/3 of my profits on the week. What a sour taste it left in my mouth to end off the week! Don't want to do that again so I will be publishing ideas and content for my channels to end off the week.
If you enjoyed the Video Analysis, please let me know by leaving a Rocket or comment!
-- ShrewdCatFx

Eurusd Multi-timeframe Analysis 1W -> 1Hr ( Video 📹) Hello traders,
Welcome to this free Multi-timeframe analysis. Eurusd is the only market I trade and I thought that maybe I can bring more value with this educational video analysis.
Eurusd has low volume coming out of the bank holiday as expected. Do not blink though because we have a full plate of fundmanental news to end off the week with fed meeting minutes being released during late NY session tomorrow. With the Lack off bottom wick we can observe on the previous Daily candle I see another increase on Eurusd towards the top of the daily range (1.096) as long as we can stay above 1.086 Daily support level. If I'm going to be honest, zones are looking a bit messy to the upside when we get around 1.092. With have a very nice 36 pips range to fill to the downside to 1.08382 4hr support zone if our Daily support doesn't hold. We must keep in mind news can take price anywhere despite the messiness and cluster of our zones. So anything can happen and we must be preprared for both scenarios.
This was my previous publishing of Eurusd prior to PMI data release on Monday. (One of the scenario's pointed us back towards 1.08761 1hr Zone) Current price 1.0884

SOFR: Farewell to LIBORCME: SOFR ( CME:SR31! )
On June 30th, SEC Chairman Gary Gensler posted a 3-minute short video on Twitter. In this educational piece titled RIP LIBOR, he explains what the London Interbank Offered Rate (LIBOR) is, and why its passing away is actually a good thing for consumers.
As CFTC Chairman in 2009-2014 and SEC Chairman since 2021, Mr. Gensler oversaw the investigation of the 2012 LIBOR scandal and its replacement by the Secured Overnight Financing Rate (SOFR) in 2021 as the benchmark interest rate for US dollar.
Eurodollar and LIBOR
Offshore Dollar, the US currency deposited in banks outside of the United States, is commonly known as Eurodollar. Traditionally, offshore dollars were traded mainly among European banks. The name sticks to these days and applies to funds in non-European banks as well.
A key advantage of trading Eurodollar is the fact that it is subject to fewer regulations by the Fed, being outside of the US jurisdiction. London is the largest trading hub for Eurodollar.
The London Interbank Offered Rate came into being in the 1970s as a reference interest rate in the Eurodollar markets. By 1986, the British Bankers' Association (BBA) began publishing the US Dollar LIBOR daily. The BBA Libor was calculated based on interest rates reported by 17 member banks who together represented the bulk of Eurodollar transactions. Libor has been widely used as a reference rate for many financial instruments, including:
• Forward rate agreements
• Interest rate futures, e.g., CME Eurodollar futures
• Interest rate swaps and swaptions
• Interest rate options, Interest rate cap and floor
• Floating rate notes and Floating rate certificates of deposit
• Syndicated loans
• Variable rate mortgages and Term loans
• Range accrual notes and Step-up callable notes
• Target redemption notes and Hybrid perpetual notes
• Collateralized mortgage obligations and Collateralized debt obligations
How important was Libor? It is a reference rate in the documentation by private trade association International Swaps and Derivatives Association (ISDA), which sets global market standard for OTC derivative transactions.
In 2008, 60% of prime adjustable-rate mortgages and nearly all subprime mortgages were indexed to the USD Libor in the US. Furthermore, American cities borrowed 75% of their money through financial products that were linked to the Libor.
Libor has been the indispensable global benchmark for pricing everything from credit card debt to mortgages, auto loans, corporate loans, and complex derivatives.
CME Eurodollar Futures
In 1981, the Chicago Mercantile Exchange launched Eurodollar futures, the first ever cash-settled futures contract. It quickly became the most liquid contract by CME. At its peak, over 1,500 traders and clerks worked at the Eurodollar pit on CME trading floor.
Not to be confused with the Euro currency, Eurodollar futures contracts are derivatives on the interest rate paid on a notional or "face value" of $1,000,000 time deposit at a bank outside of the United. It uses the 3-month USD Libor rate as its settlement index. The late Fred D. Arditti, CME economist, is credited as the brain behind Eurodollar futures.
Eurodollar futures are priced as a Money Market instrument. The CME IMM index is used to convert a coupon-bearing instrument such as bank deposit, into a discounted instrument that does not make regular interest payments.
For instance, a futures price of 95.00 implies an interest rate of 100.00 - 95.00, or 5%. The settlement price of a Eurodollar futures contract is defined to be 100.00 minus the official BBA fixing of 3-month Libor on the day the contract is settled.
The 2012 LIBOR Scandal
The LIBOR Scandal was a highly publicized scheme in which bankers at major financial institutions colluded with each other to manipulate the Libor rate. As the scandal came to light in 2012, investigators found that the banks had been submitting false information about their borrowing costs to manipulate the Libor rate. This allowed the banks to profit from trades based on the artificially low or high rates.
A dozen big banks were implicated in the scandal. It led to lawsuits and regulatory actions. After the rate-fixing scandal, LIBOR's validity as a credible benchmark was over. As a result, regulators decided that Libor would be phased out and replaced.
If you want to learn more about the LIBOR scandal, feel free to check out the 2017 bestseller by David Enrich: “The Spider Network: The Wild Story of a Math Genius, a Gang of Backstabbing Bankers, and One of the Greatest Scams in Financial History”.
What is the SOFR
In 2017, the Federal Reserve assembled the Alternative Reference Rate Committee to select a Libor replacement. The committee chose the Secured Overnight Financing Rate as the new benchmark for dollar-denominated contracts.
The daily SOFR is based on transactions in the Treasury repurchase market, where firms offer overnight or short-term loans to banks collateralized by their bond assets ,similar to pawn shops.
Unlike LIBOR, there’s extensive trading in the Treasury repo market, estimated at $4.8 trillion in June 2023. This theoretically makes it a more accurate indicator of borrowing costs. Moreover, SOFR is based on data from observable transactions rather than on estimated borrowing rates, as was the case with LIBOR.
The Federal Reserve Bank of New York began publishing the SOFR in April 2018. By 2021, SOFR has replaced most of the LIBOR-linked contracts. The LIBOR committee officially folded up on June 30, 2023. Chairman Gensler apparently chose this day to post his RIP LIBOR video to mark the end of an era.
The difference between Fed Funds Rate and SOFR
Fed Funds Rate is set by the Fed’s FOMC meeting, and SOFR is published by the NY Fed. However, they are very different.
• Fed Funds Rate is considered a risk-free interest rate, and only member banks have access to this ultra-low rate through the Fed’s discount window.
• SOFR is a commercial interest rate where banks charge each other. The NY Fed publishes the rate based on transactions in the US Treasury repurchase market.
SOFR is similar to LIBOR because they are both commercial interest rate benchmarks. On the other hand, Fed Funds Rate is a policy rate set by the US central bank.
CME SOFR Futures and Options
CME Group launched the 3-month SOFR futures and options contracts in May 2018. The contracts were based on the SOFR Index, published daily by the New York Fed.
SOFR futures contracts are notional at $2,500 x contract-grade International Monetary Market (IMM) Index, where the IMM Index = 100 minus SOFR. At a 5.215 IMM, for example, each contract has a notional value of $13,037.50. CME requires a $550 margin per contract. An interest rate move by a minimum tick of 0.25 basis point would result in a gain or loss of $6.25.
At the beginning, SOFR contracts traded side-by-side with the Eurodollar contracts. By 2021, Eurodollar liquidity has transitioned to SOFR contracts. By April 2023, All Eurodollar contracts were delisted, and the transition was completed.
For all intended purposes, you could think of the SOFR futures as the same as the legacy Eurodollar contracts, with the only notable exception being the settlement index switched from LIBOR to SOFR.
On June 30th, the daily trading volume and Open Interest of SOFR contracts were 4,443,245 and 9,310,433 contracts, respectively. On the same date, CME Group total volume and OI were 23,769,103 and 104,221,083, respectively.
On the latest trade day, SOFR accounts for 18.7% of CME Group’s trade volume and 8.9% of its total open interest. Indeed, SOFR has successfully replaced Eurodollar as new No. 1 contract at CME and is arguably the most liquid derivatives contract in the world.
Where We Are at the SOFR Market
On June 30th, the JUN SOFR contract (SR3M3) expired and settled at 94.785. This translates to the JUN SOFR rate of 5.215 (100-94.785).
SEP 2023 (SR3U3) is now the new lead contract. It settled at 94.595 and implied a forward SOFR rate at 5.405 (100-94.595). This shows that the futures market expects a rate increase in the next Fed meeting.
Like Eurodollar futures, rising futures price will confer to declining SOFR rate, as rate is equal to 100 minus futures price. Similarly, a decline in futures price equates to a rising SOFR rate.
Happy Trading.
Disclaimers
*Trade ideas cited above are for illustration only, as an integral part of a case study to demonstrate the fundamental concepts in risk management under the market scenarios being discussed. They shall not be construed as investment recommendations or advice. Nor are they used to promote any specific products, or services.
CME Real-time Market Data help identify trading set-ups and express my market views. If you have futures in your trading portfolio, you can check out on CME Group data plans available that suit your trading needs www.tradingview.com

[ PMI ] Red Folder News Scenario's 🔥/ Eurusd For PMI data I'm favoring a continued push up throughout NY Session. If this does not happen then i anticipate the volatility to create the High of the day then slowly faded off the highs back to support at 1.08743. It is Monday and the market is setting up for the rest of the week so beware of that. On My last publishing I detail a potential fakeout on the Daily timeframe after the Friday candle Closed back inside the range last week above 1.0892 which is now our weekly support level. I'm looking for price to return to 1.096 daily resistance this week with the fakeout market structure. The Daily candle was bearish all day today and has only just recently flipped back bullish as we coincide with PMI data in 7 minutes. I took a buy and just TP with majoirty of my position., holding on to some during news with SL at B.E. Update : Price shot into profit and my runner position I took Profit at +25 Pips

Fake-Breakout coming out of last week ↗️ 🌞PCE news last Friday took price back inside the range between 1.08919 Weekly Support level and 1.09859 Daily Resistance Level. The Friday daily candle retraced nearly the whole Thursday candle that contained GDP and unemployment claims data. I'm looking for this price behavior to continue into the early trading of this new week. The Idea is that we should have continued down last friday towards 1.07821 Daily S/R Zone. We didn't and instead we Eurusd has spring itself back in the range. A Fake breakout or Fakeout. I can see us returning to the top of the range basically. The Monthly candle closed Bullish for June. Looking for the same during July with the first target for July being 1.11. The second target being 1.11853. Price has been consolidating so far this year on eurusd. However, the market structure is consolidating upwards. The 3 month candle jsut closed a 3rd consecutive bullish candle. Why not more bullish?

EUR/USD Setting Up?OANDA:EURUSD
Looks like a prime 1H Breaker Block set-up on the 15m time frame
We shall see how this plays out...
EURUSD TradeAfter the take of sellside liquidity and the change in the character of the market we will see a reversal of the price to fill FVG then the continuation of the upward trend towards the liquidity of the high it's just idea

EUR/USD Daily Chart Analysis For Week of June 30, 2023Technical Analysis and Outlook:
The euro-dollar is moving towards the important Mean Sup 1.080 target after the completion of the Inner Currency Rally 1.096. However, there is a chance for a rebound with the newly established target of Mean Res 1.099 and continue beyond.

Eurusd ; more downside squeeze? 💀The Monthly candle has been pulling back from monthly resistance at 1.10255 since intitially tapping into it last Thursday. The Weekly candle is bearish and is rejecting weekly resistance zone 1.094. The Daily timeframe has confirmed a bearish breakout to the downside since it recently closed below Daily support level 1.0891. This Daily support level has now tunred into a Daily S/R Zone and may act as a resistance area for more downside potential. As stated on Tuesday's publishing " Momentum from Last week , Eurusd whats cooking? " I mentioned this statement --> "Downside target for week is 1.081 4Hr Support zone" . This would be 51 pip drop from the current daily candle and similar to the 49 pips drop that we saw today with GDP and unemployment claims data. Tomorrow we have Core PCE data. Now A few things could happen. 1) We move up prior to news then drop with news 2) We move down to our weekly target 1.081 before news and then shoot up with news 3) We consolidate, then increase back into the Daily range between 1.0891 Support and 1.096 Resistance with bad USD PCE data tomorrow.
** Also we must be aware that the monhtly candle is coming to a close. This could cause some very irrational volatility. It's the end of the week as well. It could be a freaky friday. I'm lowering size and wider SL. I may not even trade we'll see.

Momentum from last week ↘️ // Eurusd what's cooking? 👨🍳We have a fair share of news events this week to shake things up. These news events will be a catlayst for a coniuation of momentum or the cause for a reversal in the short term here. Now the Monthly candle is closing at the end of this week and we must keep in mind that it is closing bullish. I don't anticipate this weekly candle to drop 222 pips but it's not impossible. The Weekly candle from last week closed bearish rejecting Daily Resistance Zone 1.098 and Weekly resistance zone 1.1024. The top wick rejection was larger than the body of the candle denoting a good amount of sell pressure on Eurusd. The Friday daily candle closed bearish taking out all the lows from earlier in the week. Ideally for this week we would like to see the previous weekly candle's bottom wick (Approximately 48 pips ) be filled with momentum carried over from the prior week. 1.09160 is a Daily and 4hr S/R Level and may act as an area for price to distribute and take us to lower prices. If price gets a close above there we have clean traffic back up to 1.09564 4hr resistance zone. Otherwise if price can get a solid candle close below 1.08845 4hr Support zone then we have a nice 30 pip clean traffic range to decrease back to the low of last week at 1.0848 4hr Zone.
Downside target for week is 1.081 4Hr Support zone
If wrong, then expecting a range and possible eventual increase back to highs at 1.09875 Daily Resistance Zone.

Momentum Points South 🐻 We can observe the 4hr candle jsut closed below 1.0882 4Hr support Zone. Price also doesn't seem to care too much about our Daily support level 1.08915. Price retraced during London Session and gathered some liquidity while touching into weekly level 1.094 before coinciding with a drop with better than expected USD news. Also upon the 4hr candle close, it printed an engulfing candle and a siginficant top wick. All signs are screaming more downside to come. It may be after a deeper retrace to around 1.0882 and 1.08915 area but probabilities suggest lower prices to 1.0847 4hr support zone. This zone also happens to be the previous weekly candle bottom wick that we are now going to fill with momentum leftover from last week? we'll see if we get the push and fill the 33 pip range with clean traffic to the left down to 1.0847.

The Cat Eye's a Retrace ? 😾 Or Dump CityOften times I can observe a retrace with London Session. Just as price did yesterday. My thoughts are a potential retrace to 1.09149 4Hr reiestance zone and some consolidation before another bout of Sell Side pressure. Price made leaps and bounds of progress to the downside during the last 2 sessions. I do not think the market is random. Nor am I trying to call a bottom. I am simply analyzing the behavior of this market as I have observed it for quite some time. Price is in close proximity to a Daily Support Level 1.08915 (6 pips away )
We have News tomorrow during NY session which I believe can be a catalyst to pullback a bit more before Inflation data during Friday NY may help provide a continuation of the preceding 1hr trend at that point.
Towards the beginning of the week we were calling out a retrace to 1.0847. Idea was to do a Weekly Wick Fill as price was thought to have bearish momentum coming out of last week after a Bearish candle was printed ( With a larger top wick when compared to the body of the candle) We may see this scenario play out and we would like to see a break and retest after prices closes below 1.08820 on either the 1hr/4hr. Otherwise I observe a pullback for the time being.

💭 Daily Tf Key Level plays Important Role ( 1.0918 )This week 1.0918 Daily Support/Resistance Zone will likely play an important role in the direction of this week's price behavior. This was a Major Support during last week's price action may very well act as a resistance level for the new week's price action. The new weekly candle gapped up but at the end of New York trading we can observe a hold of 1.0918 Daily S/R Zone. We are currently in a tight range to begin the week between this mentioned level and the 4hr support zone 1.0886. If Sellers fail to hold below 1.09180 then entry upon break and retest above it with targets at 1.0958 4hr Zone and the previous week's high at daily resistance zone 1.0986. Otherwise with Sells here we may continue to anticpate momentum to return to the downside. Our weekly target for sells remains at 1.081.
More Analysis : Started off the week taking Sells from our Daily S/R Zone 1.0918 . Earned +.5% on the account about after commissions. It turned out to be the high of the day. Being pro-active with your trading plays an important role in profitability. Trade where it is most uncomfortable and you will likely see your results improve. Not Financial advice this has been and will always be education.

A Volatile Climax in PricePrice did a break and retest above our 1.0918 Daily S/R Zone during Asian trading today and has increased 58 pips since then. The Daily candle reached within 9 pips of the 1.0986 Daily resistance zone formed last week. This return back to the topside of what looks to be a range forming now. Top of the range being 1.0986 Daily resistance zone and 1.08908 Daily support Zone. The NY 4hr candle dipped back to around 1.094 Weekly resistance level where it found support. 1.09435 is also a 1Hr support Zone that was created with the New York session 1Hr candle. 2 4 Hour candles have closed above
1.0957 4hr Zone. Maybe I'm just trading what I think but I prefer selling at these prices. My thoughts are that we are towards to the topside of what could now be a range as previously mentioned on the 4hr timeframe .

EUR/USD -27/6/2023-• The previous decline stopped at the 78.6% level of the rally that led to it
• Current bullish impulse is targeting the 1.10-1.11 area
• Bulls still got some work to do, at least get a strong move and daily close beyond 1.10
• Bullish 20 MA supporting the price today at 1.08280
• First resistance comes at 1.1010 followed by 1.11

Eurusd Shaking out Weak hands?Trading is not complicated once you have a good understanding of whatever your technical approach is to the markets. After that good understanding is achieved you will have reasonable expectations about where price can go and will rarely be surprised. However, trading can become difficult when you throw trading psychology in the mix. Positive trading psychology is the sum of your mindset, discipline, and patience. This is why it's the most fragile and significant portion of your bottom line. Listening to the great traders and reading about their stories it's often mentioned as the most important piece of the puzzle when it comes to long term & consistent returns. It requires inner reflection and a good amount of attention from time to time. I have run into one of these occasions as I have strayed from my bread and butter. I have nonetheless created a rule on my trading plan to save me from any future occasions.

EurUsd is bullish Current daily market structure is bullish on euro! I think we are gonna see a bit of a retrace into the OTE Fibonacci of the latest daily leg!
Then the Tuesday NY session should bring about some volatility towards the upside into the market! Targets are the dol lines on the chart!
Let me know what you think in the comments!
