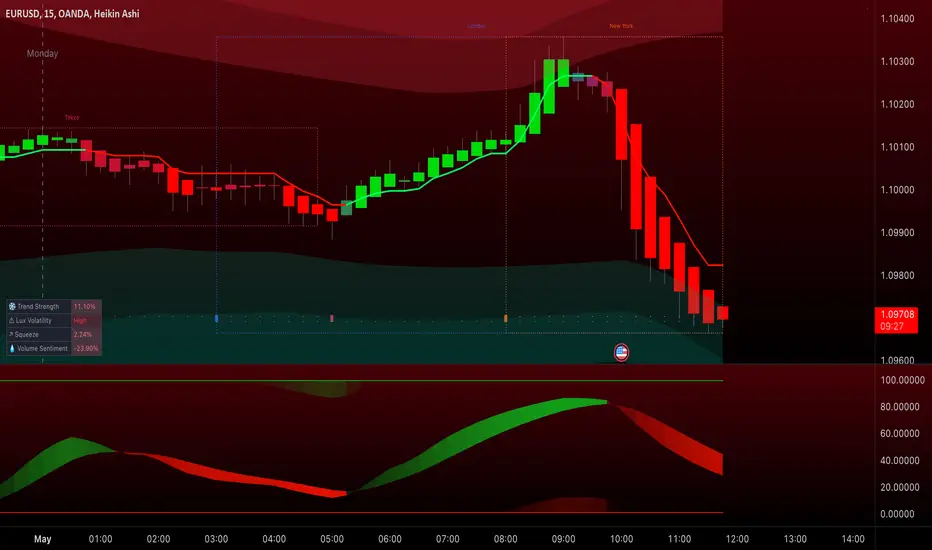
EUR/USD -11/5/2023-• Despite hawkish comments from ECB members, signaling further policy tightening ahead, the Euro has lost about 150 pips in a single week
• USD is showing signs of strength fueled by fears and risk-off mode increasing demand for the Dollar
• Technically, the short term trend is bearish after the bears managed to break the 20 SMA
• Long term, we are still in an uptrend supported by the ascending trend line
• Levels 1.09 ( horizontal support ) and 1.0850 ( trend line support ) are very critical in this scenario
• Bears will try to break below both levels to get the upper hand
• Bulls wish the recent decline is just a market correction and an opportunity for them to re-enter at a better price at the trend line support
• Odds favor a re-test of the trend line and a bounce from there since all the factors in the market are slightly tilted towards an appreciating Euro
Traders, if you like this idea please comment and like ✅
Here to answer all your questions,
Good luck
Eurodollar

Believe in the Gods! -->🔱--< But do not count on them for help Dollar Bulls Take the Win? We have dropped below our Last Daily Zone at 1.09219. I have been talking about dollar bulls Since we had FOMC data coincide with our extreme highs at 1.1095. A Coincidence? I thought this may be Suspicious! And it turned out that way. That was a good tell for the beginning of this descent. FOMC was last Wednesday and dollar bulls have blessed swing traders with 190 Pips in 1 Week. Everyone says EU is Weak in comparison to the # of pips it gives to most other pairs... It Doesn't give that much , heh 😉. It Respects level's very nicely! Very clean price actionnn.
From a Technical Standpoint.. As Long as we stay below 1.09211, only sells for the rest of week. The Price I like are 1.0897 as the next Pit stop. Ultimately with Friday's daily candle I'm liking 1.0866 Weekly Level as mentioned in previous publishing's. Also I like the Daily level just beyond that at 1.08535. As long as NY and our last remaining 4Hr Candle prints below 1.09219, Sells are fantastic. I would prefer that we waste no time and close below 1.09112 4Hr zone.
Trading : Trading today went quite well. Looking at my data.. my Thursdays are typically good. --<< I've seen that remark impact my trading psychology before. The brain is a wonder. Managing trading psychology is a large part of trading.
Given that I am profitable, I still cut my winners a bit short sometimes. Why? Out of Fear. Complicated.. But for now we must stay consistent and discplined to the system. the trading plan.
3 Setups today.. The First one I ran because i was scared and closed for B.E. It would've been a nice +5 Pip scalp. The Second was a great. Just closed a little early. The third was a great! Closed a little early once again.
I can complain because green is green. Profit is profit and we must learn and move onto the next day.
On Thursday's..
1. The Market sets itself up early in the week. By the time Thursday comes around, the weekly candle is ready to extend itself in the preceding direction from Monday/Tuesday Etc.
2. New and Struggling Traders are Tired and Exhausted from trading since Monday. They begin to make mistakes and become sloppy with their execution. Leading to larger losses than are necessary. I have been there.


buy opportunity on EURUSDon the technical side,
-break double bottom
-waiting for a 50% fib retracement
-4h retest double bottom

[ CPI ] : A Catalyst for Optimism? 🏳🟧⬛🟧- The Weekly candle pulled back up after creasing last week's low
- The Daily Candle yesterday closed in between our Daily Level's 1.09715 and 1.09495
- This was good for bulls as I mentioned because we closed above 1.09495
- Either way Eurusd was still technically inside our overarching Daily range between 1.106 Daily/Weekly level and 1.09495 Daily Level
- CPI Coincided with a Bounce off Daily Support at 1.09495! How Beautiful. I mentioned this occurrence in my update on my previous 2 Posts. CPI decreased signaling optimism for markets. Inflation is decreasing and is on a smooth downward projectory.
-Now will we observe a continued change of character with CPI data as the catalyst. We reject our lower prices and bottom part of the range and go back to 1.106 Daily/weekly Level.
-Our first pit stop to the upside being Monda's Daily Level at 1.10226?
-Price is currently at . If the Daily candle closes like this I say yes. But we must observe how the daily candle closes and if there is a follow through after the Initial bounce from CPI on the 1Hr TF.
-The 4Hr Timeframe closed beautifully rejecting our Support areas below
+ We must observe if the 4hr zone which coincides with our daily level at 1.09715 can hold for more upside
+ We must consider that we often see a correction of news price action. It can take 2-3 Hours, 1-3 Trading sessions , or 1-2 trading days. We would observe a correction down to 1.09456
More Analysis: Trading went well as I earned profits with reduced position size due to increased news volatility.
I made a few mistakes but overall I can't complain with a +.65% profit on the session and and similar +.60% gain during yesterday's Asian Session.
It makes up for the tough trading Day I had on Tuesday and plus some.
I do want to learn from my mistakes so I will be doing some further reflecting .

Correlation Dollar IndexTVC:DXY
OANDA:EURUSD
Occurs more often than not...
Look for yourself, and thank me later

Would like to be proven wrong Bulls! Eurusd 💶We have printed two Bullish Monthly Candles back to back.
The first week of this current monthly candle for May 23' has closed as an indecision candle.
I am gravitating towards the Bull side but would not be surprised to see more of a sell off after the May FOMC decision
The FOMC decision to raise rates by 25 basis points coincided with our extreme highs of the Year around the 1.105 Weekly Level
In a way I want to be proven wrong on the Sell Side for EU. I want to see Buyers stay strong around our extreme Highs here in the 1.10's and
not be phased by a short term descent in price as FOMC price action settled after the initial announcement.
I would like to see buyers at 1.09718 and 1.09480 Daily Level's be taken out before any more of an ascent occurs. The Price I'm looking for is 1.09176 Daily Level.
To begin the week before CPI data on Wednesday I will be looking for price to pullback but will be happy if proven wrong instead with price displaying a quick ascent back to 1.1095 and beyond with CPI numbers.

Buyers want 1.1024 4Hr Zone Holdd.. before potential Avalanche ⛄Scalping, Scalpingg. Has taken my heart. Discipline and Patience. Aggressive when it times to be aggressive. Fearless when it's time to be fearless. Trust in thy system and process. And Gold to be attracted to thy pocket with time and accumulate in ever increasing quantities. Will bulls hold 1.1024 4hr Zone? Or as the Daily candle flips bearish at 1.10239 will bears take us back to Support on the daily timeframe once more at 1.09718.
1.10148 Current Daily Low being the current Daily Low -->
1.10148 is a 1Hr Zone and our last potential Support before I see Sellers taking over once again.
The 1hr timeframe and 4hr timeframe have clean traffic to the left hand side and we should mirror those as we go back down.
CPI on wednesday will most definitely shake things up. Early in the week we have seen the market be proped up by Asian session buying.
Will this buying pressure be sustained?
Bulls
+ Monthly Candle is Bullish
+ New Weekly Candle gapped up and is Bullish
+ Friday Daily Candle Closed bullish
+ the first 1hr of our new 4hr candle jsut closed Bullish above 1.104
+ 4Hr market structure is Bullish
+ A bullish Asian session to begin the week. Price has been consolidating since London Session open with 1Hr candles printing in a tight range
+De-Dollarization appears to be more evident than ever
Bears
the 9am GMT 4hr candle closed below 1.104 4Hr Level
Price is still holding steadily below 1.10590 Weekly Level
Price is leaving a Top wick appearing to reject Daily Level 1.1059
The weekly candle last week printed a Lower Low and a Lower High on that timeframe.

Better action on the EUR/USD todayOANDA:EURUSD
Much better this morning
No fancy terms, no fancy commentary, NO fortune telling here from me.
I don't pretend to know how the market makers play everyday, no one can, as we are mostly just home gamers sitting home trying to pay our bills.
AND NO, no one know how the banks trade, if they knew, why are they posting to us home gamers?
I just use some cool tools to help me get some scalps here and there, that is it.
Trade well.
Now to enjoy my day.

SOFR Futures Curve
SOFR (Secured Overnight Financing Rate) is a benchmark interest rate that is based on the cost of borrowing cash overnight, collateralized by US Treasury securities. It is considered to be a replacement for the LIBOR (London Interbank Offered Rate) benchmark, which is being phased out by the end of 2021. SOFR futures are derivative contracts that allow market participants to trade on the expected future values of the SOFR rate. They are traded on the Chicago Mercantile Exchange (CME).
SOFR futures prices are quoted in terms of the expected SOFR rate at the time the contract expires. For example, a SOFR futures contract expiring in March 2023 may be quoted at a price of 98.50, which would imply an expected SOFR rate of 1.50% at that time. These prices are used by market participants to hedge against interest rate risk and to speculate on the future direction of interest rates.
The importance of SOFR futures lies in their use as a benchmark for a wide range of financial products, including loans, mortgages, and derivatives. As such, movements in SOFR futures prices can have significant implications for the broader financial markets. Traders and investors can use charts of SOFR futures prices to identify trends and patterns in the market and to make informed trading decisions. The ability to analyze and interpret these charts is therefore a valuable skill for anyone involved in the financial markets.
Futures curves are a series of futures contracts for a specific underlying asset with different delivery dates. The SOFR futures curve represents the market's expectation of future SOFR rates over time. It shows the current market pricing for SOFR futures contracts with different maturities. Each point on the curve represents a future SOFR contract with a specific expiration date.
Reading the SOFR futures curve can provide important insights into market expectations about the future path of interest rates. The shape of the curve can provide signals about market sentiment and economic conditions. In a typical yield curve, a steep upward slope suggests the market expects interest rates to rise in the future, while a flat or inverted curve suggests the opposite. The same principles apply to futures curves.
The SOFR futures curve is particularly important for markets as it serves as a benchmark for pricing various financial products, such as swaps and interest rate derivatives. Changes in SOFR futures prices can have a significant impact on the broader financial markets and the economy as a whole. As such, traders, investors, and policymakers closely monitor the SOFR futures curve to gain insights into the market's outlook for interest rates and to inform their investment and policy decisions.

EUR/USD - WhoopsOANDA:EURUSD
It was really slow today, as the world watch and celebrated the new King.
Closed out a really small scalp and called it a day, but looking back, my entry triggers worked outa few times...
What am I going to do? No FOMO here, don't care, i'm + on the day.

EUR/USD DOA - NothingOANDA:EURUSD
HUGE nothing
Took a few short positions, hoping for some fireworks, but nothing.
Closed out at 6pips ahead of my usual TP
Oh well
Better than falling down the stairs....

Got mine, happy Friday, doneOANDA:EURUSD
Took a short scalp before news and TP hit
Nice way to end the week, a good week....

Asian session slow grind, But NY gave me a quickyOANDA:EURUSD
Entered during slow Aussie session, Asian slow grind, took hours and hours to move 10 pips my way.
Then NY after news release, took the pullback re-entry for 10pips.
Now I enjoy the rest of my day.

EURUSD BREAKS OUT TO NEW HIGHSThe daily chart seemed to have put in the low for the month of May. Additionally, yesterday's daily candle closed above the daily resistance level of 1.10500 -- as drawn on the chart below. Therefore, for this trade, I'm looking for a BUY after a retest of the broken resistance level for a potential 8:1 reward/risk ratio. A close below 1.10500 would invalidate this trade. Also, we are approaching a key level 1.11200 -- keep an eye on that. Good luck!
~ Happy Trading, Cheers! 💰

That's it for meOANDA:EURUSD
Got mine, 10p scalp
Now we get the popcorn out, and wait and see.
EVeryone's a fortune teller now, LOL

EUR/USD -3/5/2023-• Euro Dollar is trading in a tight range between 1.09 and 1.11
• Bulls and bears are in balance, awaiting this week's key rate decisions for fresh impetus
• Technical setup is pointing towards a breakout soon and odds are 50 50
• We can see an ascending triangle and the price action is shrinking as we move through the cradle of the triangle
• This pattern is questionable since we usually see an upward preceding move before the triangle formation which is not the case here
• Whether the triangle formation is valid or no, we got an ascending trend line which has been tested in March and a resistance area between mid 1.10s and 1.11
• Bulls are trying to break above 1.11 from current levels, and might see a better opportunity if the price re-tests the trend line support.
• Bears need a clear break below the 20 MA and the trend line in question to flip the odds in their favor
• Two factors can negate the long term bullish trend:
1- Breaking below the ascending trend line with a clear confirmation ( several daily closes below with an increased volume )
2- Trading below mid 1.05s which breaks the higher lows series that's been forming since last November.
• This week is full of key events and economic data: FED and ECB are gonna release their rate decisions along with their forward guidance on the path of tightening policy
• NFP report on Friday
• Markets are expecting 25 bps from both central banks but keep in mind that surprises can always occur, just like the surprise rate hike from RBA last night
Traders, if you like this idea please comment and like ✅
Here to answer all your questions,
Good luck

Prepare to sell EUR within next 2 monthsTechnical Analysis:
- In weekly, EURUSD is doing wave ((4)) in black
- In short term, EURUSD is doing wave 2 in red
- H1 right side is turning down
- H4 right side is up
- Weekly right side is down
Technical Information:
- If you're a Swing Trader, you can sell wave ((4)) in red around 1.16
- If you're a Position Trader, you must wait for wave ((5)) in black around 0.93 to buy

EUR/USD - Got itOANDA:EURUSD
Got my 10 pips on this slow grind short move.
Now we wait for the party tomorrow.

EUR/USDHello Guys!
I always found complicated to track two economies for one use. But here is even more complicated due to the fact that Euro can be affected by 19 members.
Now everyone knows that all Euro area member states suffer under strong inflation and that's a fact. (example: 1 baked local croissant went from 0.2 euro to 1.9 - my experience :) )
It all started even before the conflict between RU and UKR. But this point just increased the speed of what had to come in the near future.
As a fact we have FED which is trying to reduce the speed of Inflation in the US, and we have the EU which is giving subventions for PV installation on your roofs. :)))) In any case, USD even if it's the second one in the pair EUR/USD he is the trendsetter. As I said in a previous post about NQ all this tragedy is just an artificial maneuver to wash some money.
If you want to learn more about the market you must learn about the political parties that run the public administration.
1. Trump ran the Republicans Party
2. Biden running the Democrats
Why am I saying this? (With All respect we do not consider Bush a Republican) Republicans are interested to grow the economy while Democrats have their own old fashion style. As a fact when Trump did what he did, he showed the best performance (in the 21st century) for the economy and Financial market he never went into conflicts, only Cashing out. And he did it in a very simple way. The dollar was cheap, friendly, and accessible to all types of investors in the world. Now unfortunately actual Administration made a mess or it was a script and they've been forced to increase Interest rates to slow down the inflation which made USD hella expensive. But no one can go against nature and Toyota cant cost like Bentley. I'm pretty sure that is one of the best long-term investments on the table right now and after this mess will be sorted for the next 10-15 years you won't see EUR/USD so low (of course if we will be alive) despite all the rumors we have now I consider they only barking and they will not bite.
You can wait till the first interest rates cut, you can start to add it to your portfolio. And maybe you will thank me later...


EURO/USD 🔴 SHORTIn the euro-dollar currency pair, divergence can be seen in the RSI, by breaking the trendline, I am looking for its short positions.
up to Fibonacci zones ✌️
Make money 🤘
