ridethepig | EURUSD 2020 Macro Map + Flow BreakdownAfter failing to clear 1.12xx before Christmas it is a good time to update the infamous macro chart. The floor is showing signs of permanently raising higher and with markets itching to play the reflation theme in H120, USD devaluation entering into play via Fed
flooding USD supply side and we are going see a sharp reversal triggered here with momentum on the channel break in Q120.
Lets start by digging deeper into how we got here; those who have followed my post since 2018 will remember the Long Term EURUSD chart:
After an exhaustive 2nd wave via protectionism fuelling trade war outflows and causing European macro numbers to ran out of steam, we FINALLY started to find a floor via ECB Tiering :
For those with an understanding in waves, you will notice the picture is a lot clearer on the weekly :
Although expensive with rollovers the lows have been very tradable, a loud well done all those who caught the initial breakout which we traded live here:
Support for USD is starting to run out... with all roads leading to weakness the highs in DXY are likely set for a very long time. We are trading the very highs in the range on the monthly chart, it's crunch time.
The USD 2019 Macro Chartbook:
We are sitting at the loading zone for year-end, for the flows and target-wise I am aiming for 1.16xx in Q420 and beyond 1.20xx into 2021. Invalidation for the trade will come in below 1.095xx and reassessment of the bullish view will only be necessary if we break through the gap from 2017 French Elections (both are highly unlikely to test now as USD devaluation has already begun via repo crisis).
Plenty of resistance above the market, I would expect chop to continue into January and with liquidity dry we can look to add to our longs when participants return to their desks on 27th. Good luck to those trading EURUSD in 2020 and already in longs or for those waiting patiently on the sidelines for the breakout to form.
As usual thanks sooo much for keeping your support coming with likes and jumping into the comments!
Europe

Brexit FUD is over. Labour party worse result since 1935!I am so proud of the UK. In the 1930s they rejected the growing populism in the world, and in 2019 they did the same.
All the propaganda, all the demonizing, and the forces of anti-freedom still lost, but a huge margin!
And if europe falls, we shall go on to the end. We shall fight in France, we shall fight on the seas and oceans, we shall fight with growing confidence and growing strength in the air, we shall defend our island, whatever the cost may be. We shall fight on the beaches, we shall fight on the landing grounds, we shall fight in the fields and in the streets, we shall fight in the hills; we shall never surrender.
The short sellers got scammed hard. "Oh no the GB economy will collapse if they leave". Those shorts have started to burn.
Their will be suckers rally, which I intend to join.
But I see the pound going up in general (different pairs may have different results at least the GBP against the EURO will I am nearly certain, continue to skyrocket).
Bears are getting their faces ripped off...
The perfect move would look like this:
We need a desperate attempt by GBP bears to get filled at a high RR in a high probability area.
What is good for us, on tradingview, Boris Johnson said he wanted the UK to be a world leader in tech innovations and finance.
They totally understand and support what we do, and want more of it.
I think the UK is going to be pretty safe from extremism as it has always been.
I wonder what deal they're going to get and how things will be for Ireland, and what will happen in Scotland, for some reason alot want to stay in the EU.
The experiment is about to fall apart, they should at least wait a few years before making emotional decisions...
There are so many medium sized and small countries in europe but a huge block like what it become is too much.
Different cultures languages etc... Did they think they could create something like the United States?
Germany Austria and Hungary could merge, maybe a little more, and being bigger like this would make them more relevant, Belgium the Netherlands and Luxembourg could merge to not be as small, Denmark Sweden Norway maybe Finland, Estonia Latvia Lithuania could merge.
I think it would be beneficial to them to make unions of 3 to 5 countries, rather than have all these tiny places, who knows or cares about Slovenia seriously?
Instead of 35 irrelevant countries in Europe, it could be a place with a few large federations or unions.
Right now to me Europe is: UK - Portugal - Spain - France - Italy - Germany - Poland - Ukraine - Romania - Greece - (Sweden) - (Turkey) - (Maghreb) - (Russia) - The Rest
In () the places that are peripherical to "main" europe.
Europe maybe made sense right after WW2, but this does not make as much sense anymore (also, we built a huge empire around germany to keep their conquest ambitions tamed?).
Europe is too ambitious and makes little sense. It's so big that it doesn't work and no one outside of it takes it really seriously. The place could have around a dozen merged states instead of 35+ and they would all have a certain importance, it would make european countries more relevant and recognizable, China would speak to the Polish Lithuanian commonwealth and take them seriously, but you think they care about Latvia and Belarus? Does anyone in the USA Or SEA have any clue Belarus even exists?
Poland + Lithuania + Latvia + Estonia + Belarus + Ukraine have a combined population of 100 million and a GDP of 900 billion, close to 1 trillion, which could bring them to the table with the big boys. They would actually be in the top 20 and a force to be reckoned with not some collection of "third world dumps".
But by themselves even the biggest ones - Poland and Ukraine - bring smile to people, no one takes them seriously.
Poland lmao, it's even a joke in west europe to call someone Polish.
Europe has to fall for european countries to grow together and bloom? Because why consider some alliances if you can just join europe.
Would also be nice to be able to trade some relevant (and uncorrelated) currencies because mini currencies like the Polish Zloty let me tell you they suck!
And low liquidity, high spreads... The currency doesn't even move by itself according to its own country economy...
We live in an open world, earth is much bigger than europe, so tiny countries do not make much sense anymore. This doesn't mean they should go for the complete extreme with an union of 25 countries that speak different languages...
As usual, people are only able to think in extremes, and it failed. AS IT ALWAYS DOES. Good riddance. Long live the queen.

EU: Daily long setupAfter waking up to about 30 requests for the Euro , here's the TA. We started the week neutral with the bias set because of the amount of confulneces on each side. Fundamentals sinc ethe markets opened have shown a bullish bush from that price, however the market still is yet to remain to display apparent and straight forward price action. Trading the Euro right now is tuff until we can get a lower price for an entry.

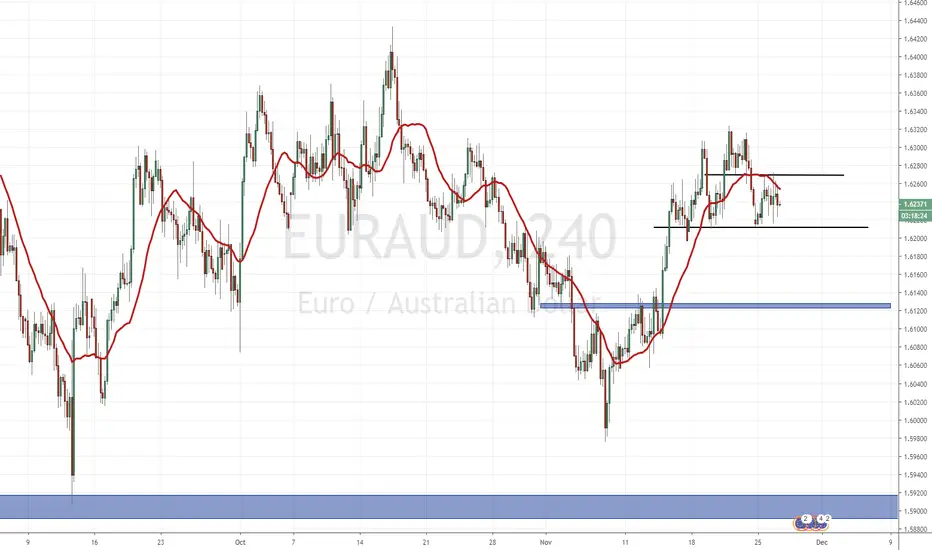
EURAUD Reversal PatternThis idea is similar to my GBPAUD idea which is still valid. Awaiting the break and close is our trigger.
EURAUD hit a resistance zone at 1.6320. We have been in an uptrend, but one factor which goes against this idea would be the swings, or higher lows, are not very prominent. However, there are 2 swings in the trend which is good for our trading.
We can see the bounce to make another higher low has been sold. It appears we will be making our FIRST lower high with the break of the 1.6210 zone.
This is the zone I am watching for a break.
1.6120 is a previous flip zone and 1.6095 is a demand zone both of which we can target.
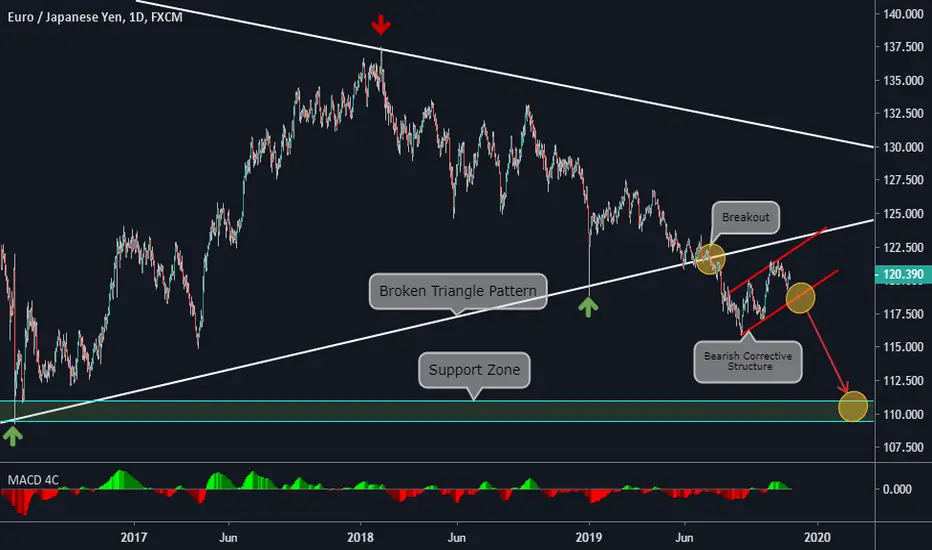
"EURJPY: potential down move" by ThinkingAntsOkDaily Chart Explanation:
- Price the Weekly Triangle.
- Price is currently on a Bearish Corrective Structure.
- If price breaks the Structure, it has potential to move down towards the Support Zone.
Weekly Vision:
Updates coming soon!
SHORT EURJPYDAILY TREND LINE HAS BEEN HIT, AND WE HAVE BANKS HOLDING 81% SHORTS, SO WE CAN EXPECT A BEARISH MOVE TO THE MIDDLE BAND, i will be selling below 120.078


"EuroStoxx: at an important Resistance Zone" by ThinkingAntsOkDaily Chart Explanation:
- Price bounced from the Support Zone and went towards the Resistance Zone where it is now.
- Bearish Divergence on MACD.
- If price starts its down move from here, it has potential to go towards the Support Zone one more time.
- We are looking for sell setups on lower timefremes.
Weekly Vision:
Updates coming soon!

DAX: Wolve Wave Target reached soon - Last upburst before SHORT!I am testing this finding. It it works then you can add it to your tool arsenal. I wonder when this opportunity will occur again though.
The more knowledge you have, the better.

Possible EUR/AUD Short position !!SMP TRADING
SELF DEVELOPMENT/METHODOLOGY/PSYCHOLOGY
SMP Strategy
Chart time frame - H4
Timeframe - 1-3 Days
A – Activating Event
Market will meet resistance in zone @ current levels - ... . In order to enter into this trade, the pair MUST be in line with my Entry Procedure....
B – Beliefs
Market will move towards the first Target 1 level @ 1.621
C - Fundamentals that may affect the pair
AUD Unemployment Rate on the 17th Oct @ 10:30 AEST
D - Trade Management
Entered @ .....
Stop Loss @ .....
Trailing Stop Loss@.....
Target 1 @ 1.621
Target 2 @ ....
Risk/Reward @ 2.5.1
Happy trading :)
Follow your Trading plan, Remain disciplined and Keep learning !!
Please Follow, Like,Comment & Follow :)
This information is not a recommendation to buy or sell. It is to be used for educational purposes only!


[LONG] EURUSDFor my personal perspective. Long Position for this pair, as it was not dropping on it demand zone already. Be careful on the Bull Trap on the 1st Supply Zone, TA would get on it.
Trade on your own risk.


DAX: Testing the possibility of a reversal?By Andria Pichidi -October 7, 2019
The growth outlook continues to deteriorate. While German officials await confirmation that the economy is not just experiencing a short correction that will leave capacity utilisation still at relatively high levels, markets are positioning for a prolonged and serious decline in German and Eurozone growth.
Today’s data strengthen the market’s positions, after weaker than expected German orders data at the start of the session and the German Sentix investor confidence, which came out at the lowest level since 2009, added to signs that global trade tensions and Brexit jitters will push the German economy into deep recession.
The German manufacturing orders declined -0.6% m/m in August, more than anticipated,while the German Sentix investor confidence fell back to -19.4 in the October reading, from -12.8 in September. The dip to the lowest level since 2009 highlights mounting risk of a deep recession, rather than the technical correction that the Bundesbank and the government are still factoring in. The overall Eurozone reading fell back to -16.8, which adds to signs that the weakness that started in the German manufacturing sector is spreading to other sectors and countries.
Following the data and as the trade optimism fades, the European stock markets were lower in the European open, with GER30 down by 0.5% from Friday’s close. Even though it holds above Thursday’s low, the heavy losses seen last week have not been recovered yet, keeping the overall outlook negative. As the data continue to back the recession narrative, the only event that could support GER30 is the ECB’s asset purchases resumption.
Although in terms of bias, the asset holds for a 3rd consecutive day to the upside, holding above the 200- and 50-day SMA, at the same time it remains below the 38.2% reversals from the 12,495 high. While intraday, the asset posted few upsides today, the momentum remains neutral, as MACD and RSI hold close to neutral zone, suggesting consolidation in the near term.
On the flipside, the overall volatility presents signs of an abating of the DAX, as the asset remains close to the lower Bollinger Bands pattern, with BB extending lower, MACD readying to turn below zero and RSI at 44, both presenting negative bias.
Having this in mind, the recent recovery looks like a correction to the overextended decline seen last week, outside of the BB range. Only a big move above 12,200 could turn the focus back to the mid-12,000 area.
Against that background, ECB speakers this week will likely continue to reflect a diverging range of opinions, although chief economist Lane in particular will defend the move, while repeating the increasingly urgent call for fiscal support as economic growth slows.
Click here to access the Economic Calendar
Andria Pichidi
Market Analyst
Disclaimer: This material is provided as a general marketing communication for information purposes only and does not constitute an independent investment research. Nothing in this communication contains, or should be considered as containing, an investment advice or an investment recommendation or a solicitation for the purpose of buying or selling of any financial instrument. All information provided is gathered from reputable sources and any information containing an indication of past performance is not a guarantee or reliable indicator of future performance. Users acknowledge that any investment in Leveraged Products is characterized by a certain degree of uncertainty and that any investment of this nature involves a high level of risk for which the users are solely responsible and liable. We assume no liability for any loss arising from any investment made based on the information provided in this communication. This communication must not be reproduced or further distributed without our prior written permission.

"EuroStoxx moved exactly as expected" by ThinkingAntsOk4H Chart Explanation: "What happened?"
- Price broke the Descending Trendline.
- It started its up move after bouncing on the Support Zone .
- There was a Bearish Divergence on MACD .
- Price reached our target on the Resistance Zone first. After that, it faced a correction towards the Support Zone .
Now, we are waiting to see a new clear setup. Updates coming soon!
Weekly Vision:
Daily Vision:


ready to breakout? Lyxor STX600 Chemical, with its inverted head and shoulder (bullish continuation pattern).


"Eurostoxx: moving as expected" by ThinkingAntsOk4 Hour Chart Explanation:
- Price broke the Descending Trendline.
- It started its up move after bouncing on the Support Zone.
- Bearish Divergence on MACD.
- Price has potential to reach our target on the Resistance Zone. After that, it should face a correction towards the Support Zone.
Weekly Vision:
Daily Vision:

Apple Receives $14B Tax Order From EURecently, Apple received an order from the European Union to pay 13 billion euros ($14 billion) in back taxes. And then, the tech giant launched a legal challenge against the 2016 ruling.
Moreover, the U.S. company cited that the executing European Commission is using its authority to fight state aid to retrofit changes to national law. In effect, trying to alter the international tax system, and it is starting to create legal uncertainty for businesses.
The six-strong delegation to the court, led by Chief Financial Officer Luca Maestri, will have five judges. And they will hear the arguments of both sides, as well as Ireland, Poland, Luxembourg, and the EFTA Surveillance Authority, over two days.
Daniel Beard, a lawyer of Apple, stated that the Commission wanted the iPhone maker firm to attribute all of its profits from all its sales outside America. And put it in the two branches in Ireland. “The activities of these two branches in Ireland simply could not be responsible for generating almost all of Apple’s profits outside the Americas,” he said.
Apple Vs. EU
Furthermore, the Commission cited in its decision about the 0.005% tax rate paid by the main Irish unit of Apple in 2014. However, Beard quickly dismissed the criticism by saying the regulator was just probing for headlines by quoting tiny numbers.
As of now, the tech giant pays a global tax rate of 26%. And it is the largest taxpayer around the world. Its payment hits 20 billion euros in U.S. taxes on the same profits that the Commission said should have been taxed in Ireland.
Aside from that, Apple expects revenue to hit $61 to 64 billion in its current financial quarter. And for its gross margin, it is anticipating for 37.55 to 38.5%
On the other hand, Ireland is also challenging the Commission’s decision.

FX Trading | USDJPY SELLSl: 108.34 | -0.34%
TP 1: 106.88 | +1.01%
TP 2: 105.86 | +0.95%
50% close on target 1 at 106.88
50% close on target 2 at 105.86 with changing the stop loss to break even at the buying price

“EuroStoxx: going up as expected" by ThinkingAntsOk4H Vision Explanation:
- Price broke the Descending Trendline and started its up move.
- Price reached our first target at the Resistance Zone .
- Price has potential to move up towards our main target at the Major Resistance Zone .
- However, the Bearish Divergence could be indicating a pullback to the Support Zone before going up.
Take a look at our Weekly and Daily Analysis!
Weekly Vision:
Daily Vision:
Updates coming soon!
