FX Day Trading | GBPUSD BUY PositionAhead of the Parlement decision and debate today, the market has recovered to the level 1.2261 where I believe the uptrend will be extended till the final vote outcome been released, much such as in the event where no confident motion was voted for against the previous government, at the time where Theresa May have been a PM. except for this time, the motion isn't a no-confidence motion and it is more of stoping a no-deal scenario whereas in case the motion passed by majority may signal a possible general election as been said by the former PM Boris johnson.
Europe

Medium Term Long, Long Term ShortMy predicted moves for EURUSD,
Some expected relief in euro area, an Trump's monetary easing pressure may have an effect.
But big problems are around the corner in europe, with threats of fragmentation, which will drag the euro once more to historic lows...
Low probability both to come true.

FX day trading | GBPUSD Sell PositionThe level of TP and Sl are shown in the chart, A potential break to level 1.1931

Day Trading | Forex AUDCAD shortingA shorting position on AUDCAD by the levels in the chart, target on support S1

EURUSD - LOOKING FOR THAT GAP FILLThe euro recorded a low today just below $1.1035 with more risk to the downside.
I believe we still have the gap to fill (red lines) before we have any big bull moves which will coincide with some stimulus from the ECB.
For me consolidation as has been until we fill that gap and only then would I look at longs.
Sorry for the messy chart! :)

Day Trading | EURCHF shorting (SELL)Target 1: 1.0837
Target 2: 1.0771
Exit 50% at the first target then move the stop loss for the rest of 50% to break even, having a zero free risk trade for the second target.

German DAX Head and ShouldersCheck out my opinions on my last post on the Spanish IBEX. The same macro and fundamental analysis applies.
The German Dax is also showing us an interesting head and shoulders pattern and a potential break out here.

Spanish IBEX Head and ShouldersAlready outlined on how central banks will HAVE to keep stocks propped up. This is due to pensions and also the fact that central banks have forced money into stocks as yields were suppressed. A decade ago, you could retire with 1,000,000 and buy government bonds yielding 6-8% making 60,000-80,000 a year...enough to live off of in retirement. Now a days, you would make less than 30,000. In fact, bonds are now being used to trade rather than for yields!
Pensions funds are heavy in bonds and fixed income. They are not making the 8% required per year. In Canada, or pension funds have had to go into stocks and real estate. American social security is still 100% in fixed income...
Now, in some places, even real estate cannot be purchased for 1,000,000 meaning stocks are the only place to go for yield! There is nowhere else to go. Plus, stocks can be liquidated quickly which is important in this environment.
Expect central banks to prop stocks up because they have to in order to keep system propped up. Yes, a geopolitical situation can change this. Watch China for this. But you need to remember, central banks will keep stocks up. Cutting rates means you can only go to stocks for yield. Stimulus will also be reintroduced (very soon imo) but cannot be called QE. When stimulus comes back online there will be a CONFIDENCE CRISIS as people realize we are in 0 rates and fake/managed markets for life.
Check my other posts on these topics.

EUR/USD Still bearish.EU Banks still in touble. EU economy overall is still bad with no signs of recovery . So i'm still shorting every bounce. It's that simple

Euro Bank Index | 7 Year Trendline BrokenEuropean bank index has broken a 7 year trendline that ECB has long defended. Result? Failure. Breaking 76.7 on the EuroStoxx will give full bears control.
Our trade idea from last year:

BTC/USD - 1H RiseWith 1000 SMA on the support side, Its' Strong Support. Taking decision around there would be a good Idea.

FTSE 2 hour ideaSimilar to my Dax idea just posted, a lot of world equities are bouncing...remember central banks can still cut rates and do QE/stimulus which means there will be nowhere to go for yield except the stock markets. The party might not just be over yet.
Similar description to the FTSE as with the DAX, a prolonged downtrend and basing at a support zone. We had a wedge and broke above the resistance zone and even the previous lower high swing.
7375 zone is a flip zone you should watch and then 7575 above.

German Dax 2 hour set upBeen in a prolonged downtrend on the German Dax...world equities really, and it seems we began to bottom out here. We stopped making lower highs and lower lows.
We hit a support one and from there have gained some bids. Seems we got what appears to be a wedge/triangle break above a resistance zone on the 2 hour followed by higher highs and higher lows. A good risk vs reward trade.
Watching the 11920 zone as an interim target, and another zone at 12050 zone.
I still think central banks can cut rates and go back to QE/stimulus so markets can still remain propped...wall street can keep the party going a little longer.

EURNZD Hi Traders
This is my idea about Euro/New Zealand Dollar all things clear in chart . Wait for price to reach 1.7300 .
Enter Point : 1.7280 - 1.7320 ( Short )
Target : 1.70
Stop loss : Breaking 1.73 Zone Completely ( Not only Shadow or Fake break )
*Please consider Money Management and Risk Management and follow your rules . this is only my opinion.
if you have any question you can ask it in comment .
If this analysis was helpful to you please Like & Follow.
Join my Telegram Channel for more signals and analysis : t.me

Et tu DAX?Like the big US Indices DJ:DJI and SP:SPX we got a MASSIVE bearish divergence and a an ascending wedge on the 2 Months chart.
The German Economy really does not exude confidence since the creation of the Euro. As we know the EZB is already on an interest rate of 0% and there is no mild exit anymore from this state of economy in the Eurozone. Soon we will see the price they will have to pay, it does not look cheap..

Euro Stoxx BreakdownEuro Stoxx Index is also showing signs similar to my CAC40 idea (link below). Again, be wary with the Fed tomorrow. Cutting rates, and future rate cuts, means that there will be nowhere to go for yield other than the stock market. Central banks are attempting to keep stocks propped. This is their new mandate: to keep assets propped.
You can see a some what of a double top as Euro Stoxx tried to break out. Failed to and you can see the long wick and large engulfing red candle. We then created a lower high and have broken below a support/ flip zone. A strong break as well.
Looking to the flip zone at the 3415 zone...although be wary of 3437 too. Would expect one more lower high swing.

EURNZDI will wait for price to goes up and i will take a Sell Position .
Enter Point : 1.6825 - 1.68 ( Sell Position)
Take profit : 1.662 - 1.66
Stop loss : Breaking 1.68 zone completely on 1 Hour timeframe.
*Please consider Money Management and Risk Management and follow your rules this is only my opinion .
Telegram Channel : t.me

EURAUD SELL 1ST TARGET 1.61000WHERE PRICE IS TODAY @1.63500 WE HAVENT HAD A DAILY OR WEEKLY CANDLE CLOSURE ABOVE THIS LEVEL SINCE THE BEAR MARKET OF THE 2009 RECESSION CRASH.
ABOVE MY PURPLE KEY LEVEL IS UNKNOWN TERRITORY WHICH HAS BEEN REJECTED MULTIPLE TIMES
WITH AXY WEAKNESS WE MAY SEE CONSOLIDATION BEFORE SELL OFF
TREND LINE BREAK & RETEST HAS TAKEN PLACE
1.6100 IS ALWAYS RETESTED ON BACK TESTING THE LAST 12 MONTHS ONCE CURRENT PRICE IS FULFILLED

Short term reversal for GBP/USD
Good Morning,
Even though I dislike taking risks in trading currencies that are in economical war, but I noticed a pattern. I see that the pound has completed the head and shoulder pattern that was formed between Feb and May 2019, plus a reversal bar on the daily close, has given me the courage to take a long positions @ 1.2650 with a take profit @ 1.2795 and a stop loss @ 1.2590.
Good luck


EURJPY Buy after breakoutThe EUR/JPY currency pair is likely to continue its upside swing.
Wait for a breakout and confirmation.
support level at 120.80
Target at 123.53 region.
Buy after breakout and a confirmation.
Good luck everyone!

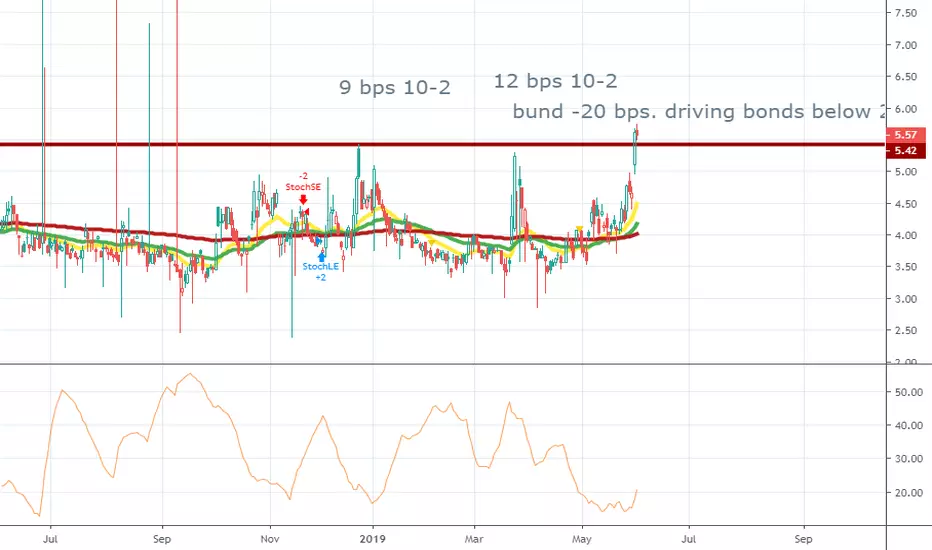
ZIRP-unintended consequences--fisher international effectbased on interest rates and the importance of the euro and USD for global trade. we're seeing an irrational shift thats artificially effecting equity volatility. ZIRP or zero interest rate policy in euro zone. is driving demand for USD and us treasuries vs eurozone risk off assets. this flow is exploiting an already dramatic difference in interest rates globally. when bonds rally equities tend to fall. the bund last week hit an all time low of -20% yield on the german 10 year. aint that crazy people are dumb enough to buy an asset that has a 20% premium attached. thats right people are so afraid theyre willing to buy something and receive 20% less afterwards.. that being said people are choosing to go to US risk off USD and treasuries instead where they actually have a chance of making money. that transition is causing volatility. equity volatility is non-exsistant, but bond flows are overpowering flows.. INVESTORS MUST REMEMBER THE DISCOUNTING MECHANISM FOR FUTURE VALUE AND GROWTH IS.. THE RISK FREE RATE (US 10 YEAR YIELD) if the risk free rate is falling like a rock.. what is that saying about risk in US assets vs the world? thats exactly why im beyond bullish
STOXX50 - H&SH&S pattern forming on the daily of STOXX50.
Target ~3120. Stop at top of right shoulder at ~3445.
Dashed lines: support / resistant zones.
