SX5E – Going to the topEuro Stoxx 50 is a leading blue-chip index for the Eurozone, providing a representation of the leaders in the region. The index covers 50 stocks from 8 European countries.
Technically, following the coronavirus crash in February-March 2020, the price has formed an uptrend that we think will reach the resistance area of 3840-3880. If the price corrects deeper before going to the top, the targets for continuation are the 3400 rectangular area and the blue trendline that connects the low of March 2020 with the retracement of October 2020.
Trade with care.
Best regards,
Financial Flagship
Disclaimer: The analysis provided is purely informative and it should not be used as financial advice. Remember that you need a plan before you start trading; so, take this knowledge and use it as a guidebook that will ultimately help you understand the market and easily predict your next move.
Eurostoxx50

Eurstoxx lowerThe rising wedge off a strong rally Eurostoxx50 shows us that the momentum on the higher is declining and inability to push to higher highs as easily.
Market closed below support signalling to further bearishness in the market.
This is a good entry however a pullback is also likely


EURO STOXX 50 #RRR 1:4 Short Setup LL and LHHI BIG PLAYERS,
on EURO STOXX 50 I found a nice LL and LH signal for shortsetup.
In 1 h chart the last low breakdown the previous low and in the 15 min chart it seems also like a lower low and a lower high.
The RRR (Risk-Return-Ratio) would be 1:4.
Kind regards
NXT2017

EUROSTOXX 50: next week overviewPrice reacted very good to the 2925 impulse. Now we're expeting a push to the high.
3110 coul be a good level to short

The European giant is continuing to drop downThe market continued to drop down from the beginning of this week making it one of several market that fell during week. We might see more dropping of the market due to France's foreign policy and its conflict with the Arab world specially since France monopolizes the biggest part in the Eurostoxx50 which negatively affected the rest of the participating countries in this giant stock market.

The Giant continued its collapse todayAfter the fall of yesterday, the.Eurostoxx50 continued to move downward especially after crossing the 3112 barrier that the price retraced from, giving the bears the leads to take market down being supported with high volume that confirmed fall.

ridethepig | Stoxx 50 into the elections and beyond📌 STOXX 50
The purpose of the operation here is a clean and simple 5-3-5 sequence to the downside which means the lows are still exposed to another flank attack from those accompanying bears.
This is a very important few weeks and months for volatility and in a roundabout way we must take full advantage of this while it takes place. I don't consider the manoeuvre here to be any different from the elementary operation we took at the beginning of the year in European Equities as we are in the same complacent environment with covid escalating out of control.
As we have discussed together before, the herd must always be wrong and recognising this and the misconception of the v-shapers can only lead to an eventual test of previous support. To the topside, invalidation will come via a closing breach of 3490/3500 as this is the level which is protected via its own barrier.
Thanks as usual for keeping the feedback coming 👍 or 👎

We're moving forward to reach our targetAs i said earlier, once the price breaks the 3169 zone it may move forward giving us more profits. Stay in your trade and keep an eye on market.

The European Giant may move upward heavlyThe market started strong by pushing down as the bears entered the market with high volumes to put a great impact on the market, but the bulls have squeezed the sellers at 3138 giving a feeling that the market may reverse go heavily upward. But the price should break a very important area in order to continue its way upward which is 3169, and if the price could break it we may see a beautiful long trade.

A strong bullish move of the giantI see a strong inclination of the market to go bullish since it already broke a resistance zone at 3227 and it is supported with a significant awakening in the volume. Once the green volume explodes, we will see a beautiful long trade but you should watch for the resistance zone at 3255 that might reverse the market.

The market is showing an inclination to go bearish this morning!I see that market has given a good bearish signal with a significant volume that is superior to its previous volume, but i also see an support zone at 3198 that the price should break before taking off downward. When the price breaks the support line, you should definitely sell the market.

We might see a slight bullish move so soon.As you can see, the market has finally approached the resistance zone and is trying to break it! When we see that breaking happen we will see a strong move upward! Please make your profit at 3227 so you may exit there! Happy trading.

A strong volume explosion showing a potential bearish big move!As you can see in the chart, the Eurostoxx50 showed a big volume explosion indicating an intention to move down yet there is no confirmation unless it breaks the support area at 3171. I showed a consolidation area in the rectangle and what made me assume a soon bearish move is the breaking of the rectangle. On the other hand, if the market changes direction and breaks the resistance area at 3217, we will see a strong bullish move taking the market to a higher price.

The Euro Stoxx50 Is trying to trap the traders.I see that the market is trying to trap some trader as it is trying to show a fake move to the bottom where there is a tremendous support are at 3189 that pushes the price up no matter what! On the other hand, there is also a strong resistance area at 3217 and i see there is high probability that it will break it and move up. So, when the price breaks that resistance area, you definitely should buy the market.

The Euro Stoxx is showing a potential strong bearish move!The market is preparing to break the support area that is moving toward it now and if it breaks it you should definitely sell the market. But if it bounces back we have to wait and see if it will break the resistance area at the top and if it breaks it, the market will go high.

The Market is trying to go Bullish on the 30M chartWhen the price crosses the resistance line at 3201, you definitely should buy the market as the volume is creating a strong momentum and the bulls are entering heavily to buy the market.

The Euro Stoxx 50 is showing a probable Bullish move on the 30MSince the market could not break the strong resistance area at 3169, the market will keep going bullish. But if the market breaks the support area with a strong bearish candlestick, then the market may go bearish. We will have to wait and see.

A very strong sell Signal on the 30M chart!After studying the chart of this morning, i saw a very strong signal confirmed by the break of the resistance area at 3169. The market retested the area and showed a strong momentum towards the bottom. The market is still heading towards the strong support area at 3126. You may exit there but if it breaks that area, you should sell the market as it may collapse.

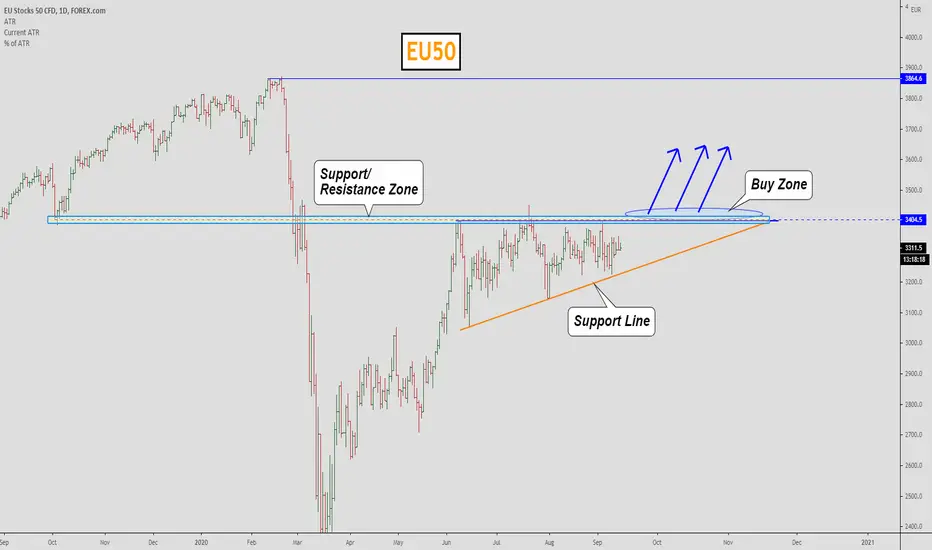
EU50, Waiting for the breakout!I will open Buy if the price will cross the Support/Resistance Zone and fix above it.
A huge accumulation below can give a strong impulse.
Push like if you will trade it also!
Write your comments and questions here!
Thanks for your support!
ridethepig | Stoxx 50📌 Eurostoxx 50 is in question here and we have a good illustration of the ABC outpost. The main target 3,489 is still open for a test but a breakdown here will seal it for the year.
In a nutshell, this is a chart speculating that we are in the very early days of the "C" leg down.
It is the same opening move in play for German Equities, DAX:
This leg down in European Equities will be considered painful for the late buyers; the weakness of the real economy is shown via the following charts.
Unemployment Claims:
US 2's 5's:
Sharp speculators are adopting a wait-and-see policy, the fate of the moves in Eurostoxx depends on the range settlement. Sellers breaking through 3,200 will 'protect' the highs and because of the technical damage done, the flows will finally commit towards +/- 2,475.
As usual...thanks for keeping the feedback coming 👍 or 👎

EU50 - EURO STOXX 50Hello Traders, if you agree with my idea put a like and feel free leave a comment to link your trading ideas.
Follow me for weekly analysis of swing trading support/resistance , fibonacci retracements, COT data.
For informations feel free to contact me.
Thanks for your support!

