VOLKSWAGEN AG (VWAGY) Bullish Breakout & Continuation
VWAGY broke and closed above the important decision range on 4H.
the market has retested the range and showed a posilitive bullish reaction to that.
now bullish rally is expected.
next goal:
18.0
Eurostoxx50

Markets Across the world are ready to push like never before.Looking at charts from across the globe we found a very similar setup, triangle formations that are forming across the board in a timely manner.
If we look deeper into what is going on we are going to get a pretty nice surprise. Let's start of with the Nikkei.
The Nikkei has been on a consolidation pattern since the start of June and has just resolved within a clear break around it exactly one month after. This paired with global optimism that a second wave has been avoided in Asia thanks to great control sounds the bull bell, we might still see a deeper correction that could signal a potential long term buying opportunity. If we see the price of the Nikkei Holding above 22600 we could be up for a move towards 24k in the rest of the year.
Exactly the same is going on across the board. Let's check Europe for an instance:
For instance, the DAX is doing exactly the same being in a triangle consolidation pattern since the 3rd of June that has now broken above and is showing strength if it holds above 12.600. if things start to look clearer from here we might be looking at a potential move towards previous all-time-highs. Coincidence? Not really.
Not confident enough? let's get to the juicy part, let's try and dig deeper into the abyss and look at what is going on in the US Markets. after all, EEUU markets drive most of the money flows right?
A quick glance at the S&P500 might give you the chills. Why? Well, the market is exactly doing the same, but wait there is more to come, we are just getting started.
Looks pretty familiar right? well, I can't say I didn't warn you. Global Markets took a hit and it hurt, but recovery is around the corner. Central banks are doing almost everything they can, Governments are supporting people like never before. and let's face it. A second wave is something bad but we are going to live with COVID-19 for a long time, we might just make it a profitable one.
Not buying it yet? well, let's look at something even more interesting... What about the Dow Jones? is it anything closer to this? I mean what sector can be worst off in a pandemic right?
Well, that's pretty much a very compelling view of global markets. However let's not take a pause and bring the big guns, as I said, we might as well just save the best for the end. Because it is yet to come.
The dollar is breaking lower and this is just the cherry on top, we might as well just close here but not everything needs to be technical. Fundamentals are coming in stronger in the last few weeks, rates are lower than ever and the sentiment for the virus is shifting towards more "lets live with it and make the most of it" than rather being scared and locked down at home.

You know when it is so bullish 1% down feels we are upEurostoxx 50 futs reversing right on the 200 day average. To buy the dip or not to buy it here?


Could Euro Stoxx and Bitcoin Signaling Warning?Well that was an eventful weekend. With less than 10 hours to go before the Bitcoin halving, the cryptocurrency markets are attempting a set up for a relief rally. In other news Federal Reserve Chairman Jerome Powell will speak on the current issues facing the U.S. economy later this Wednesday. Heading into this speech, it is difficult to bet against the market. I am conflicted though. There are warning signs. The Bitcoin and Euro Stoxx 50 charts could be providing hints.
Relief into Halving?
Over the weekend Bitcoin suffered a set back as it attempted a breakout above 10,0000. The weekly close will likely result on the rally officially ending. The proof : The weekly candle (not shown) ended in a doji reversal on spot exchanges and exhibited the highest volume since the March 16 weekly candle. Furthermore, the two month old bullish ascending trendline that supported that rally was finally breached (see daily chart below).
Price can absolutely rally in the interim. A reason would be the ridiculous CME Gap that many traders have already pointed out. See the 4-hour Bitcoin Futures CME chart below.
The picture on lower time frames is an absolutely mess unless you turn the noise off. Here I have the 1-hour line chart of Bitcoin. The king of crypto is exhibiting signing of an inverse head and shoulders pattern reversal. Given that the pattern is on lower time frames, I give it a lower probability in completing and/or reaching its measured target. Trade this pattern with caution, as the risk is still to the downside.
Bitcoin is poised to rebound from whatever low it posts in the short term. So it is very difficult for me to be bearish on the short term. However, that being said I will continue to emphasize that Bitcoin could be in for a lengthly consolidation prior to making any new highs. BTFD and sell the rallies. Bias: BTFD .
Europe Showing Sign of Weakness
Above is the chart of the Euro Stoxx 50 (EU50), an index that is made up of the 50 largest and most liquid stock in the European zone. After a 50% rally off the March low, the EU50 has not been able to reclaim its high. Europe could be signaling a warning for stock market investors and traders that the high may be in. Its a chart to watch! Bias: Bearish.
Stars Aligning for Rally to End
Not calling any top here, but I do think it is time to rethink the upside on the tech driven rally. With Bitcoin and now Europe exhibiting weakness, the warning signs are there that the rally is nearing an end. Until then, I'll be playing the relief rallies and promising set ups. Happy trading and talk to you all soon!

EURO STOXX. The EU lighthouse...EURO STOXX 50 INDEX is the "lighthouse" of all the other EU index.
It's a little bit too early to speak about Elliot Wave Pattern but:
if confirmed we wait for it to 2560 Area. So all the other index.
#DAX first of all.


Euro Stoxx BreakdownEuro Stoxx Index is also showing signs similar to my CAC40 idea (link below). Again, be wary with the Fed tomorrow. Cutting rates, and future rate cuts, means that there will be nowhere to go for yield other than the stock market. Central banks are attempting to keep stocks propped. This is their new mandate: to keep assets propped.
You can see a some what of a double top as Euro Stoxx tried to break out. Failed to and you can see the long wick and large engulfing red candle. We then created a lower high and have broken below a support/ flip zone. A strong break as well.
Looking to the flip zone at the 3415 zone...although be wary of 3437 too. Would expect one more lower high swing.

When Trump Made America Great Again - SPXSP:SPX
TVC:SHCOMP AMEX:VEU
TVC:SX5E
AMEX:VEU
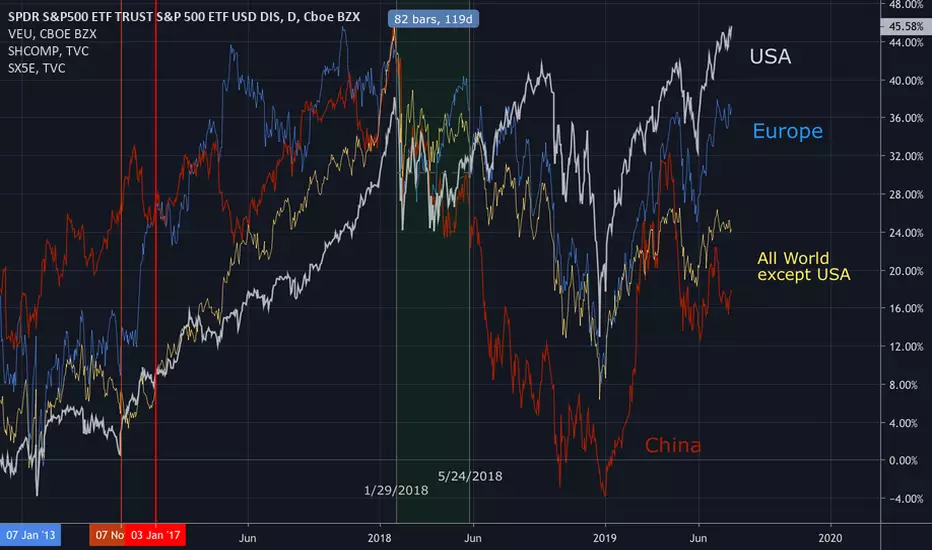
1, Vertical lines: Thin Orange is Trump wins election. Thick Orange is start of Trump presidency
2. Chart Lines:
White is USA stock market, S&P500
Blue is the European “Dow Jones”, Euro Stoxx 50
Orange is the market cap weighted index of the entire planet’s stock markets (the 44 countries with capital markets), except the S&P 500. “All World minus USA” ETF.
Red is China stock market.
Summary:
Between January 29th and May 24th, 2018, The U.S. went from lagging the World’s stock market to clearly leading the Earth’s stock. I propose this is a direct result of the announcement and implementation of Tariffs. 1st with $50B of tariffs on China on March 22nd, 2018.
- I had initially thought this was due to Brexit (Britain exiting the European Union), However, the Brexit vote happened in June 2017, and actually seems to have boosted their markets.
- For symmetry, and to compare apples 2 apples, this chart is in log percentage format.
Flag at EUROSTOXX 50 ?Flag at eurostoxx 50? maybe good money in it., im short in usoil as well, it can drive the markets down a bit more.

"Top and Bottom Analysis" EUROSTOXX (EU50EUR) by ThinkingAntsOk4H CHART EXPLANATION:
Main Items we observe on the Chart:
- Price broke the Ascending Channel and, then, bounced on the Resistance Zone.
- If price breaks the Ascending Trendline at 3381, it has potential to move down towards the Support Zone at 3300.
We are looking for Sell Setups on lower timeframes.
MULTI TIMEFRAME VISION:
- Weekly
- Daily

SHORT EUSTX50 @ 3475 Global markets are turning to bearish due to Trump's tariff twitter. For short, I believe Eurostoxx 50 is a nice object today. A strong bearish bar has broken the structure. Just wait for a step-back opportunity and sell it.
Entry: 3475
Stop: 3516
TP1: 3434 (We can trail it for more profit.)

"Top and Bottom Analysis" EUROSTOXX 50 by ThinkingAnts4H CHART EXPLANATION
- Price is currently on an Ascending Channel and, after bouncing on the bottom of it, theres potential to move towards the top.
- Price is above the previous resistance, trying to mark new max. It is currently in a Bullish Corrective Structure to continue the up move.
- If price breaks 3457, the target prices are determined by Fibonacci Levels (3502 and 3556,8).
Updates coming soon!
MULTI TIMEFRAME VISION:
- Weekly
- Daily


SHORT Euro stoxx 50 approaching resistance, potential dropEuro stoxx is approaching our first resistance at 3262.6(horizontal swing high resistance, 61.8% & 50%Fibonacci retracement, 100% Fibonacci extension ) where a strong drop might occur below this level pushing price down to our major support at 3134.7 (38.2% Fibonacci retracement , Horizontal overlap support, 61.8% Fibonacci extension )
Stochastic (55,5,3) is also approaching resistance where we might see a corresponding drop in price.
Trading CFDs on margin carries high risk. Losses can exceed the initial investment so please ensure you fully understand the risks.

SHORT Euro stoxx 50 approaching resistance, potential drop!Euro stoxx is approaching our first resistance at 3262.6(horizontal swing high resistance, 61.8% & 50%Fibonacci retracement, 100% Fibonacci extension ) where a strong drop might occur below this level pushing price down to our major support at 3134.7 (38.2% Fibonacci retracement , Horizontal overlap support, 61.8% Fibonacci extension )
Stochastic (55,5,3) is also approaching resistance where we might see a corresponding drop in price.
Trading CFDs on margin carries high risk. Losses can exceed the initial investment so please ensure you fully understand the risks.

Euro stoxx 50 approaching resistance, potential drop!Euro stoxx is approaching our first resistance at 3262.6(horizontal swing high resistance, 61.8% & 50%Fibonacci retracement, 100% Fibonacci extension ) where a strong drop might occur below this level pushing price down to our major support at 3134.7 (38.2% Fibonacci retracement , Horizontal overlap support, 61.8% Fibonacci extension )
Stochastic (55,5,3) is also approaching resistance where we might see a corresponding drop in price.
Trading CFDs on margin carries high risk. Losses can exceed the initial investment so please ensure you fully understand the risks.

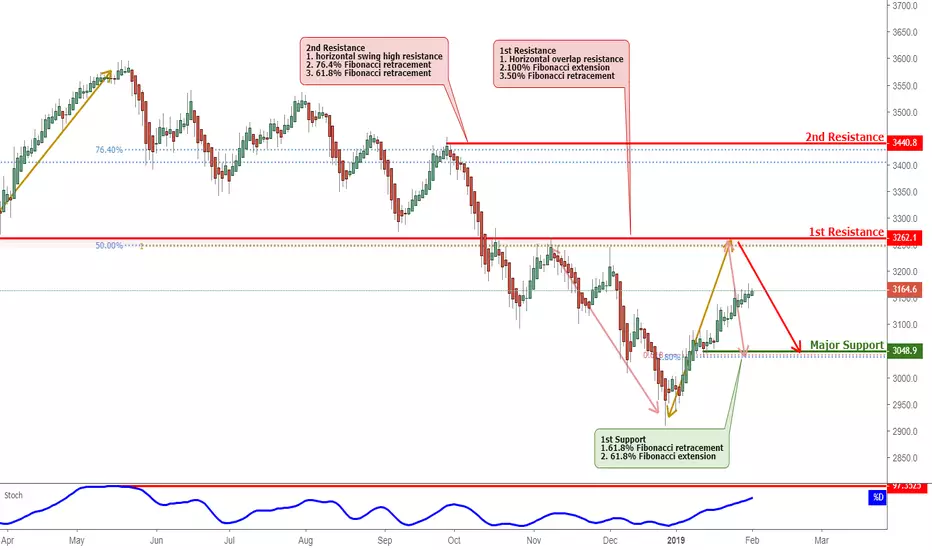
SHORT SHORT Euro Stoxx 50 approaching resistance, potential droEuro Stoxx 50 is approaching our first resistance at 3262.1(horizontal overlap resistance, 50% Fibonacci retracement ,100% Fibonacci extension ) where a strong drop might occur below this level pushing price down to our major support at 3043.7 (61.8% Fibonacci retracement ,61.8% Fibonacci extension )
Stochastic (89,5,3) is also approaching resistance where we might see a corresponding drop in price.

SHORT Euro Stoxx 50 approaching resistance, potential drop!Euro Stoxx 50 is approaching our first resistance at 3262.1(horizontal overlap resistance, 50% Fibonacci retracement ,100% Fibonacci extension ) where a strong drop might occur below this level pushing price down to our major support at 3048.9 (61.8% Fibonacci retracement ,61.8% Fibonacci extension )
Stochastic (55,5,3) is also approaching resistance where we might see a corresponding drop in price.
Euro Stoxx 50 approaching resistance, potential drop!Euro Stoxx 50 is approaching our first resistance at 3262.1(horizontal overlap resistance, 50% Fibonacci retracement ,100% Fibonacci extension ) where a strong drop might occur below this level pushing price down to our major support at 3043.7 (61.8% Fibonacci retracement ,61.8% Fibonacci extension)
Stochastic (89,5,3) is also approaching resistance where we might see a corresponding drop in price.

Time to short European indicesIn a prevalent potential or on-going bear market, sharp countratrend rallies and 50% retracements are usual.

Make or break ? Confluence of support just above the psychological level of 3000...
waiting for the candle to close...

make or break ? Confluence of support just above the psychological level of 3000...
Waiting for the candle to close.
