EUR/GBP Technical Analysis – Range-Bound Structure EUR/GBP Technical Analysis – Range-Bound Structure with Potential Rebound
The pair is currently trading within a well-defined horizontal channel between:
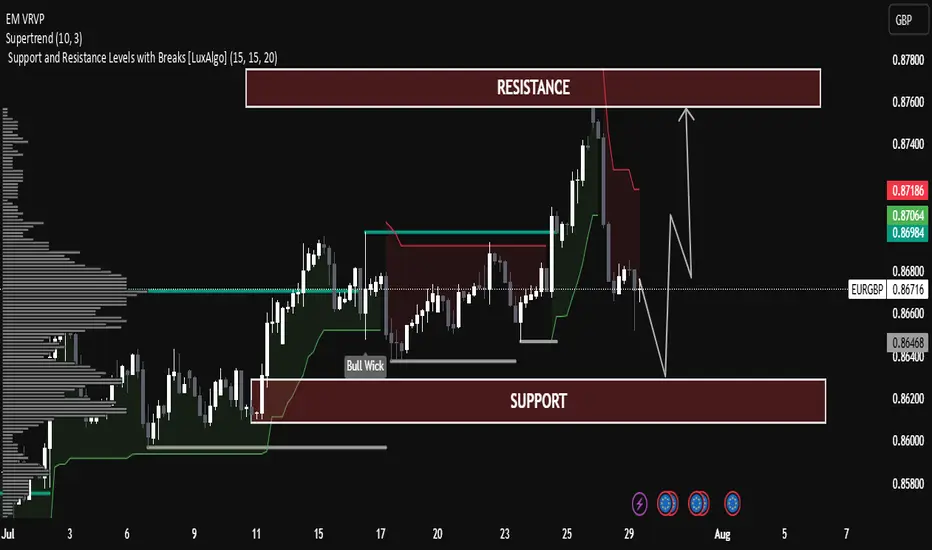
Support Zone: 0.86400 – 0.86200
Resistance Zone: 0.87800 – 0.87600
Price is currently near the mid-level (0.86756), showing consolidation after a rejection from resistance.
Supertrend Indicator:
The Supertrend (10,3) is currently bearish (red line above the price), indicating short-term downward pressure.
Price recently broke below the Supertrend line near the highs, suggesting a correction is underway.
Volume Profile (Left Side):
Significant volume has been transacted around the current market range (Point of Control).
This indicates strong interest and fair value, often leading to sideways movement before the next breakout.
Bull Wick Highlight (Mid-July):
Indicates buying pressure from lower levels, acting as historical demand near 0.86400.
🔄 Price Projection & Scenario Planning:
✅ Scenario A: Bullish Rejection from Support
If price retests the support zone (0.86400 – 0.86200) and forms a bullish rejection (e.g., pin bar or engulfing), a bounce is likely.
Target: Resistance zone 0.87600 – 0.87800
Confirmation: Bullish candle + break of 0.86900 resistance.
❌ Scenario B: Bearish Breakout Below Support
A break and close below 0.86200 may trigger a deeper correction.
Next possible downside target: 0.85800
Volume drop and strong red candles would support this.
🔧 Technical Summary:
Indicator Status
Structure Sideways / Range-bound
Supertrend Bearish (Short-term)
Support Zone 0.86200 – 0.86400
Resistance Zone 0.87600 – 0.87800
Bias Neutral-to-Bullish (above support)
🧠 Educational Note:
This chart is a great example of range trading—where traders look to buy near support and sell near resistance, especially when there is no strong trend. Patience and confirmation signals (like wick rejections or volume spikes) are key in such setups.
Eurousd
EUR/USD Short from the nearby 1hrI’m currently more confident in EU’s bearish setup compared to GU, as price is nearing a clear point of interest (POI) that aligns well with the developing downtrend. The 2hr supply zone has already caused a CHoCH (Change of Character), and price has been approaching it slowly and with reduced momentum — often a strong indication of an upcoming reaction.
While price isn’t near a demand zone yet, I’ll be keeping an eye on the 7hr demand zone below. If price reaches that area, I’ll be looking for a high-probability buy setup in line with the broader market context.
Confluences for EU Sells:
Price has tapped into a 2hr supply zone that caused a CHoCH to the downside
Bearish pressure remains strong, supported by DXY strength
Clean liquidity to the downside that needs to be swept
Slowing momentum and signs of distribution as price approaches supply
P.S. If price continues lower from this point, I anticipate another break of structure, which could form a new supply zone to work with later this week.
Let’s stay patient, follow the flow, and execute smart. 🔥📉💼

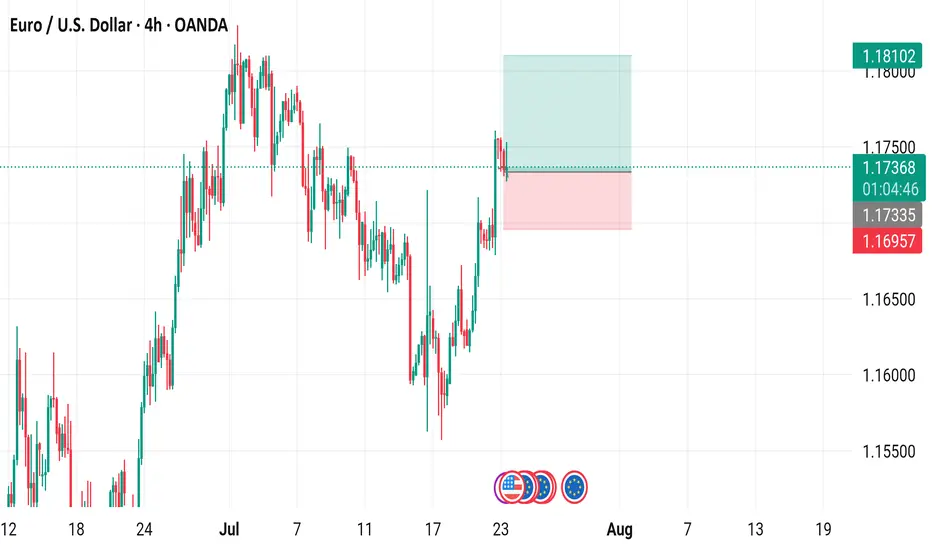
EUR/USD 4-Hour Candlestick Chart (OANDA)4-hour candlestick pattern for the Euro/US Dollar (EUR/USD) currency pair on the OANDA platform, covering the period from mid-July to mid-August 2025. The current price is 1.17358, reflecting a 0.16% decrease (-0.00186). Key levels include a sell signal at 1.17350 and a buy signal at 1.17366, with a highlighted resistance zone around 1.18102 and support near 1.16957. The chart includes technical indicators and price movements over the specified timeframe.
Educational EUR/USD Chart Breakdown – Price Action at Key LevelsEducational EUR/USD Chart Breakdown – Price Action at Key Levels
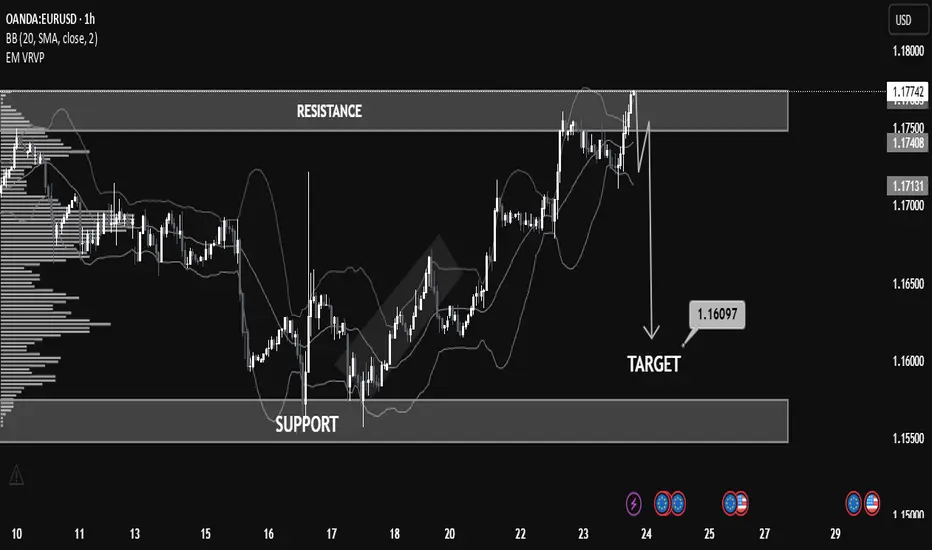
This EUR/USD (1-hour) chart provides a great example of how support and resistance zones, combined with price action and indicators like Bollinger Bands, can help anticipate market moves.
🔹 Resistance Zone Tested:
The pair recently approached the 1.17500–1.17800 resistance zone. This level had previously acted as a supply zone, and price once again showed rejection here, indicating selling pressure.
🔹 Bollinger Band Overextension:
Notice how the price extended beyond the upper Bollinger Band—this often signals that the market is overbought in the short term, leading to a potential reversal or correction.
🔹 Bearish Reaction & Target:
After rejection from resistance, the chart outlines a bearish move with a target at 1.16097. This level lies just above the next strong support zone (1.15500–1.16100), offering a realistic area for price to stabilize if the downtrend continues.
🔹 What to Learn:
Support & Resistance: Prices often react at key zones; previous resistance can turn into support and vice versa.
Confluence Tools: Use indicators like Bollinger Bands with price structure to increase confidence.
Target Planning: Identify likely reaction zones for risk management and profit-taking.
📚 Summary
This setup is a clean example of trading within a range and using technical confluence to plan entries and exits. If price breaks below 1.17130 with strong momentum, the probability increases for the market to reach the 1.16097 target.
"EUR/USD Technical Blueprint: Bullish Continuation EUR/USD Technical Blueprint: Bullish Continuation Patterns and Strategic Price Zones Explained
🔹 Market Structure & Trend
The chart shows a clear shift from a ranging phase into a bullish breakout:
Price previously consolidated in a broad horizontal channel, with a strong demand zone (support) established between 1.16000 – 1.16600.
Following a deep liquidity grab on July 17-18, the price bounced sharply from support, creating higher highs and higher lows – a classic bullish structure.
Current momentum shows bullish continuation, as the price broke above local resistance around 1.16645 and is now forming a potential bull flag or bullish pennant pattern.
🟢 Bullish Momentum Confirmation
Price is currently retesting the broken resistance (now acting as support at 1.16645).
If the support holds and bullish momentum continues, the measured move target projects a price move toward 1.17331, the next significant resistance level.
This is also supported by increased volume activity in the breakout zone, as seen on the VPVR.
📊 Key Technical Levels
Level Type Description
1.16000 Major Support Historical demand zone + liquidity grab
1.16645 Support Zone Previous resistance, now retest area
1.16926 Current Price Bullish consolidation forming
1.17331 Resistance Bullish target based on breakout projection
1.17700+ Extension Potential continuation level if momentum persists
🧠 Volume & Volatility Insight
Bollinger Bands are expanding post-breakout, indicating increasing volatility and a potential trend continuation.
VPVR shows a high-volume node around 1.166, confirming it as a strong demand zone.
🔎 Outlook & Strategy
✅ Bullish Bias
As long as the price remains above 1.16645, buying dips could be a favorable strategy.
A break above 1.17000 with strong volume could open a path toward 1.1733 and higher.
❌ Invalidation Level
A strong close below 1.16600 would invalidate the bullish setup and could return price to the lower support around 1.16000.
📌 Conclusion
EUR/USD is displaying strong bullish momentum after breaking a key resistance level and forming a solid support base. A breakout above 1.17000 may lead to a continuation toward 1.17331 and potentially higher. This setup favors bullish positioning with tight risk management.

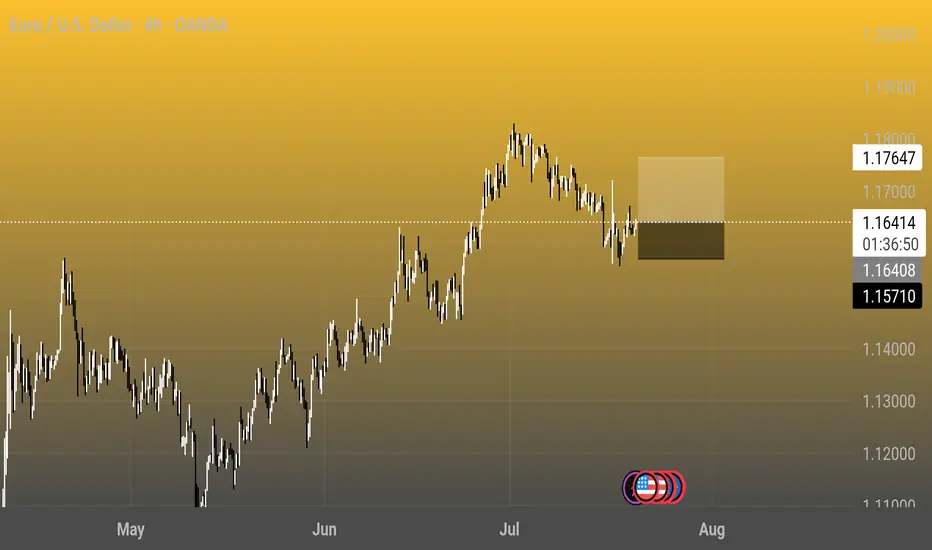
Euro / U.S. Dollar 4h Chart - OANDA4-hour candlestick chart showing the exchange rate between the Euro (EUR) and the U.S. Dollar (USD) from May to August 2025. The current rate is 1.16416, with a 0.14% increase (+0.00161). The chart highlights a peak around late June to early July, followed by a decline, with notable support and resistance levels marked at 1.17647 and 1.16416, respectively.
EUR/USD) bearish chochy Trend Read The captionSMC trading point update
Technical analysis of EUR/USD (Euro vs. U.S. Dollar) on the 4-hour timeframe. Here’s the breakdown
---
Technical Breakdown:
1. Market Structure Shift (CHOCH):
The chart highlights a Change of Character (CHOCH), signaling a bearish reversal after a previous uptrend.
This is confirmed by lower highs and lower lows forming after the CHOCH point.
2. New Resistance Zone:
The previous support (yellow box) has now turned into a new resistance level around 1.16400–1.16700.
Price has rejected this area after the breakdown, validating the resistance flip.
3. 200 EMA Breakdown:
Price is now trading below the 200 EMA (1.15928), which reinforces bearish sentiment.
The EMA may act as dynamic resistance on any pullbacks.
4. Target Zone:
The projected target is the key support zone around 1.14582, where price consolidated before the last major bullish move.
This level has historical significance and aligns with a clean support demand zone.
5. RSI Indicator:
RSI is not yet oversold, sitting in a neutral-to-bearish range, indicating further downside potential.
Mr SMC Trading point
---
Trade Idea Summary:
Bias: Bearish
Entry Zone: On breakdown and rejection from the new resistance area (~1.16400–1.16700)
Target Zone: 1.14582 (key support)
Invalidation: A break and close above the resistance zone
Confluence: CHOCH confirmation + support-turned-resistance + 200 EMA breakdown
---
Please support boost 🚀 this analysis)

Euro/U.S. Dollar (EUR/USD) 4-Hour Chart - OANDA4-hour performance of the EUR/USD currency pair. The chart shows a recent upward trend peaking around 1.16241, followed by a sharp decline to approximately 1.15452. Key levels include a high of 1.17245 and a support level around 1.16478, with a highlighted area indicating a potential consolidation or reversal zone.

EUR/USD 2-Hour Chart (OANDA)2-hour performance of the Euro/U.S. Dollar (EUR/USD) currency pair on the OANDA platform as of July 10, 2025. The current exchange rate is 1.17225, reflecting a slight decrease of 0.03% (-0.00032). The chart includes buy (1.17234) and sell (1.17216) prices, with a highlighted resistance zone and recent price movements over the past month, showing fluctuations between 1.16500 and 1.18000.

EUR/USD Pulls Back from Yearly HighsThe EUR/USD pair has depreciated by nearly 0.5% over the past three trading sessions, favoring the U.S. dollar. At the moment, this appears to be the prevailing short-term trend, marking a new and steady bearish bias that has started to weigh on the euro. The current selling pressure has remained consistent, as the U.S. dollar shows renewed strength. The DXY index, which measures dollar performance, has been rising toward the 98 level, showing a solid recovery that could further intensify downward pressure on EUR/USD.
Sustained Uptrend
In recent weeks, the euro has shown consistent bullish momentum, maintaining a dominant uptrend on the long-term chart. So far, the recent bearish corrections haven’t been strong enough to break the structure, making it the key technical formation to watch in EUR/USD. However, the dollar’s current recovery appears to be gaining traction, and if that trend continues, it could put the existing uptrend at risk.
Technical Indicators
MACD: The MACD histogram is oscillating near the neutral zero line, suggesting that momentum from the moving averages remains balanced. If this continues, price action could consolidate into a more defined neutral range in upcoming sessions.
ADX: The ADX line remains above the 20 threshold but is starting to slope downward, which, if sustained, may lead to a more neutral price structure in the near term.
Key Levels to Watch:
1.18068 – Key resistance: This level marks the yearly high for EUR/USD. A breakout above this point could reinforce the current bullish trend.
1.15299 – Nearby support: A recent neutral zone. A breakdown here could trigger a stronger bearish bias and threaten the prevailing uptrend.
1.13177 – Distant support: Corresponds to a consolidation zone formed in May. If price drops to this level, it may activate a fresh and meaningful bearish trend.
Written by Julian Pineda, CFA – Market Analyst

EUR/USD 2-Hour Chart - OANDA2-hour performance of the Euro/U.S. Dollar (EUR/USD) currency pair on the OANDA platform as of July 08, 2025. The current exchange rate is 1.17365, reflecting a 0.24% increase (+0.00279). The chart includes a recent sharp decline highlighted in a shaded area, with buy and sell signals at 1.17375 and 1.17357 respectively. Key price levels are marked, ranging from 1.1500 to 1.1850, with a focus on the recent market movement.

EUR/USD BULL RAID: Quick Profit Heist Before the Drop!🏴☠️ EUR/USD "The Fiber" HEIST ALERT: Bullish Loot Before the Trap! 🚨💰
🌟 Greetings, Market Pirates & Profit Raiders! 🌟
Hola! Oi! Bonjour! Hallo! Marhaba! 🤑
🔥 Thief Trading Strategy Activated! 🔥
Our bullish heist on EUR/USD is LIVE—time to swipe the loot before the bears set their trap! 🎯💸
📈 Entry (Vault is OPEN!):
Buy Limit Orders preferred (15M/30M swing levels).
Alert up! Don’t miss the breakout.
🛑 Stop Loss (Escape Route):
Nearest Swing Low (1.15200) on 30M TF.
Adjust for your risk & lot size—no reckless robberies!
🎯 Target (Profit Hideout): 1.16400
Scalpers: Stick to LONG only—trail your SL to lock gold!
Swing Traders: Ride the wave or split the haul.
⚡ Why This Heist?
Bullish momentum + weak bears = perfect robbery conditions.
Overbought? Yes. Risky? Absolutely. But thieves thrive in chaos!
📢 Pro Tip:
Avoid news spikes (volatility = jail time for unprepared traders).
Trailing SL = Your Getaway Car.
💥 BOOST THIS PLAN!
Hit 👍, share 🔄, and let’s drain this market together! More heists coming—stay tuned! 🚀🐱👤
(Disclaimer: Trade smart. We’re thieves, not gambleers.)

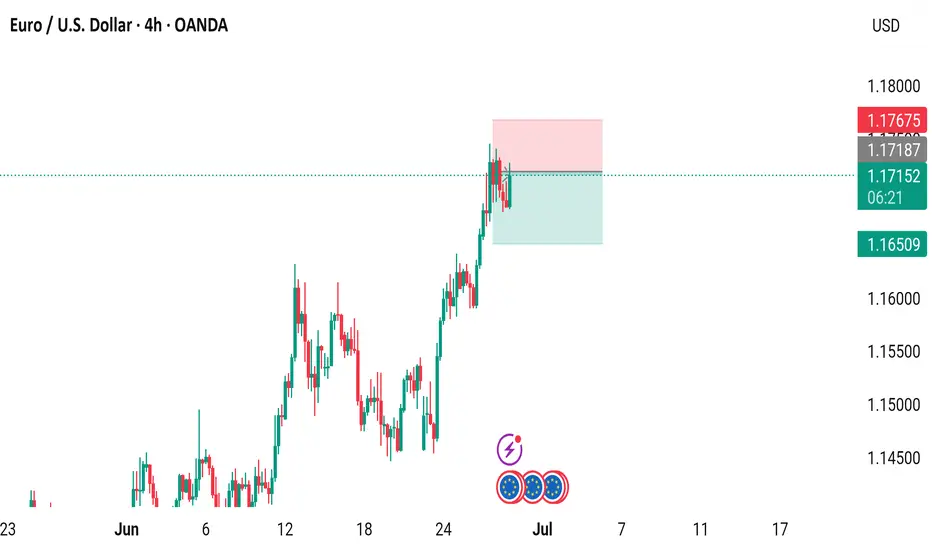
EUR/USD 4-Hour Chart (OANDA)4-hour performance of the Euro/US Dollar (EUR/USD) currency pair, sourced from OANDA. The current exchange rate is 1.17152, reflecting a 0.12% increase (+0.00136). The graph shows a recent upward trend, with a highlighted resistance zone around 1.17187, where the price has approached but not consistently broken through. The timeframe spans from late June to early July 2025, with key price levels marked on the right side ranging from 1.14500 to 1.18000 USD.
EUR/USD 4-Hour Chart (OANDA)4-hour price movement of the Euro/U.S. Dollar (EUR/USD) currency pair from OANDA, covering the period from June 19 to July 11, 2025. The current exchange rate is 1.16787, reflecting a 0.16% increase (+0.00189). The chart highlights a recent upward trend, with a notable price range between 1.15990 and 1.17335, and includes candlestick patterns and a highlighted resistance zone.

EUROUSD updates chartEUR/USD Sell Setup Active 🔻
Pair rejected key resistance zone near 1.0740 – entering sell position now.
📉 Short-term momentum favoring bears.
🎯 Target: 1.0650 → 1.0600
🛑 Stop Loss: Above 1.0755
🕰️ H1/H4 confluence confirms downside pressure.
Trendline + RSI divergence = high-probability short!
📌 Plan the trade. Trade the plan.

EUR/USD 1-Hour Chart - OANDA1-hour period, provided by OANDA. The current rate is 1.16038, reflecting a 0.22% increase (+0.00252). The chart shows recent price movements, with a notable upward trend and highlighted resistance (1.16095) and support (1.15574) levels. The time frame spans from 13:00 to 28:00, with candlestick patterns indicating market activity.

EUR/USD) back to bearish Trand Read The captionSMC trading point update
Technical analysis of EUR/USD pair on the 2-hour timeframe. Here's a breakdown of the idea behind the analysis:
---
Trading Idea Summary: EUR/USD Bearish Reversal Setup
1. Rejection at Resistance Zone
Resistance Level (~1.1600): Price has tested this level twice (red arrows) and faced strong rejection, suggesting it’s a firm supply zone.
This double top near resistance signals potential downside pressure.
2. Bearish Market Structure
Price action shows a break in short-term bullish momentum.
Bearish trend arrows and structure indicate expected continuation to the downside.
3. EMA Resistance
The 200 EMA (blue line) at 1.14356 is above the key support zone, acting as dynamic resistance, reinforcing the bearish outlook.
4. Target Levels
First Target: 1.13694 (Key Support Level)
Previous structure zone with strong historical price reaction.
Final Target: 1.12025 (Major Support Zone)
Larger demand area where buyers previously stepped in.
Mr SMC Trading point
---
Conclusion
This analysis suggests a potential short setup with confirmations from:
Repeated resistance rejection
Bearish price structure and trend arrows
EMA as added confluence
Clear downside targets: 1.13694, then 1.12025
> Bearish bias remains valid unless price reclaims and closes above the resistance zone (~1.1600).
pelas support boost 🚀 this analysis)

EURO-USD BUY STRONG 1. "EUR/USD Strong Buy Alert 🚀 | Key support zone holding firm – bulls eyeing the next leg up!"
2. "Strong Buy Zone ✅ | EUR/USD showing bullish momentum from this support level – eyes on 1.09+"
3. "EUR/USD Reversal Zone 💥 | Buyers stepping in strong – potential rally ahead!"
4. "Watch this zone! EUR/USD strong buy setup forming – bullish confirmation underway 📈"
5. "EUR/USD bouncing from key demand zone 🔥 | Technicals align for a strong buy signal!"

EUR/USD) Bearish breakout analysis Read The ChaptianSMC trading point update
Technical analysis of EUR/USD on the 1-hour timeframe, likely projecting a short-term downward move. Here’s a breakdown of the technical analysis and the trade idea:
---
Key Elements in the Chart:
1. Bearish Rejection from Resistance:
Price was rejected twice near the 1.14400 resistance zone (highlighted in yellow).
The red arrows mark double rejection at this level, suggesting strong selling pressure.
2. Break of Rising Channel:
Price was previously moving inside a rising channel.
Recent price action shows a clear breakdown below the lower trendline, indicating trend reversal.
3. 200 EMA (Exponential Moving Average):
EMA is around 1.13188 and price is below it, reinforcing bearish momentum.
EMA also acted as dynamic resistance after the channel breakdown.
4. Target Zone – Support Area:
The yellow support zone around 1.10911 is the target point.
This was a previous area of price consolidation and demand.
5. RSI (Relative Strength Index):
RSI is near 51, hovering around the neutral zone.
Not strongly bearish yet, but room remains to drop toward oversold if the downtrend continues.
---
Trade Idea Summary:
Bias: Bearish
Scenario:
Price has broken a key structure and is retesting the breakdown.
Expect continuation toward the 1.10900 support zone.
Entry Zone:
Near current price (~1.13400–1.13500), ideally on a retest of the EMA or broken trendline.
Target:
1.10911 (highlighted support level).
Stop-Loss (Invalidation):
A break and close back above the resistance zone (~1.14000–1.14200).
Mr SMC Trading point
---
Conclusion:
This is a high-probability bearish setup following a structure break, retest, and double top rejection. It targets a move back down toward a previously strong support level, with a favorable risk-to-reward ratio.
Pales support boost 🚀 analysis follow)

"STOXX50/EURO50" Index Market Money Heist (Day / Swing Trade)🌟Hi! Hola! Ola! Bonjour! Hallo! Marhaba!🌟
Dear Money Makers & Robbers, 🤑💰✈️
Based on 🔥Thief Trading style technical and fundamental analysis🔥, here is our master plan to heist the "STOXX50/EURO50" Index CFD Market. Please adhere to the strategy I've outlined in the chart, which emphasizes short entry. Our aim is the high-risk Green MA Zone. Risky level, oversold market, consolidation, trend reversal, trap at the level where traders and bullish robbers are stronger. 🏆💸"Take profit and treat yourself, traders. You deserve it!💪🏆🎉
Entry 📈 : "The heist is on! Wait for the MA breakout then make your move at (4500) - Bearish profits await!"
however I advise to Place sell stop orders above the Moving average (or) after the Support level Place sell limit orders within a 15 or 30 minute timeframe most NEAREST (or) SWING low or high level for Pullback entries.
📌I strongly advise you to set an "alert (Alarm)" on your chart so you can see when the breakout entry occurs.
Stop Loss 🛑: "🔊 Yo, listen up! 🗣️ If you're lookin' to get in on a sell stop order, don't even think about settin' that stop loss till after the breakout 🚀. You feel me? Now, if you're smart, you'll place that stop loss where I told you to 📍, but if you're a rebel, you can put it wherever you like 🤪 - just don't say I didn't warn you ⚠️. You're playin' with fire 🔥, and it's your risk, not mine 👊."
📌Thief SL placed at the nearest/swing High or Low level Using the 4H timeframe (4800) Day/Swing trade basis.
📌SL is based on your risk of the trade, lot size and how many multiple orders you have to take.
Target 🎯: 4200 (or) Escape Before the Target
"STOXX50/EURO50" Index CFD Market Heist Plan (Day / Swing Trade) is currently experiencing a Bearish trend.., driven by several key factors.👇👇👇
📰🗞️Get & Read the Fundamental, Macro, COT Report, Geopolitical and News Analysis, Sentimental Outlook, Intermarket Analysis, Index-Specific Analysis, Positioning and future trend targets... go ahead to check 👉👉👉🔗🔗
⚠️Trading Alert : News Releases and Position Management 📰 🗞️ 🚫🚏
As a reminder, news releases can have a significant impact on market prices and volatility. To minimize potential losses and protect your running positions,
we recommend the following:
Avoid taking new trades during news releases
Use trailing stop-loss orders to protect your running positions and lock in profits
💖Supporting our robbery plan 💥Hit the Boost Button💥 will enable us to effortlessly make and steal money 💰💵. Boost the strength of our robbery team. Every day in this market make money with ease by using the Thief Trading Style.🏆💪🤝❤️🎉🚀
I'll see you soon with another heist plan, so stay tuned 🤑🐱👤🤗🤩

CONSOLIDATIONConsolidation.
The EURO/USD consolidates over the recent news about tariff concerns. The EURO/USD is trading in a box range as you can see. I believe we are poised fo a bullish breakout! What do you think? Post comments below and thank you for reading.

EuroDollar : When Does the Dust Settle? Tariffs 25'Rather quiet to begin the week as the EuroDollar remains unchanged during the Initial 3 sessions of the week. A "Doji" Daily Candle printed, informing us those of us more technically minded to write off the day's price behavior and look to preceding candles for indication of future direction. It is important to note the longer top wick of 38.5 pips versus the 23.5 pips bottom wick. We can observe yet another daily candle wicking into the Weekly level 1.087. This Price remains very important in the short term because it may facilitate a pullback on EurUsd to the downside. This follows a historic Week of volatility for the EuroDollar as Trumps Tariffs shook the markets to say the least.
If we are considering Bullish targets for the week, Daily Level 1.093 , or even Daily Level 1.098 which would be the most generous for buyers. When fundamentals are this strong, it's more difficult to discount those larger, irrational moves that you see in the markets sometimes. So although one could argue how over-extended the EuroDollar is, we must remember the game we are playing.
In Considering Bearish targets, a retest of Daily Support level 1.0786 seems reasonable. A Deeper retracement could see price around 1.0694 , the beginning of Last Tuesdays very clean bullish NY session. A pullback seems technically sound, considering the outlier and extent of last weeks upside move.
Job Openings on Tuesday is the appetizer to the
Inflation CPI data on Wednesday which will surely see some volatility rock these already rattled markets.
CPI/Inflation is forecasted to Cool for the Dollar which technically supports more strength for the Euro and a further upside push for this pair.
Please Leave a rocket or comment if you enjoyed this Analysis. Have a good trading week !

EUR /USD) bearish trand analysis Read The ChaptianSMC Trading point update
This chart presents a technical analysis of the EUR/USD pair on a 1-hour timeframe. Here's the breakdown and idea behind the analysis:
Chart Analysis Summary:
1. Trend Structure:
The price was in a downtrend, moving within a descending channel.
Recently, the price has rejected the upper boundary of the channel (noted as "down reject").
There's a 200 EMA (Exponential Moving Average) acting as dynamic support around the 1.09086 level.
Mr SMC Trading point
2. Support Zone:
A strong demand zone (highlighted in yellow) is visible near the 1.08183 area.
This zone aligns with previous structure support and a potential reversal point.
3. RSI Indicator:
RSI is around 49, showing a neutral to slightly bearish momentum.
No overbought/oversold signals yet, suggesting room for further downside before a reversal.
4. Projection Idea:
The analyst expects a possible short-term drop into the yellow support zone (target: 1.08183).
After reaching the target, a bullish reversal is anticipated, aiming for a breakout above the downtrend with a rally towards the 1.10500+ zone.
Trading Idea:
Short-Term Bearish Move: Sell toward 1.08183 if price confirms rejection of the trendline or 200 EMA.
Medium-Term Bullish Reversal: Watch for bullish confirmation (e.g., engulfing candle, RSI divergence) at the 1.08183 zone to go long toward higher highs.
Pales support boost 🚀 analysis follow)
