"EUR/USD Technical Blueprint: Bullish Continuation EUR/USD Technical Blueprint: Bullish Continuation Patterns and Strategic Price Zones Explained
🔹 Market Structure & Trend
The chart shows a clear shift from a ranging phase into a bullish breakout:
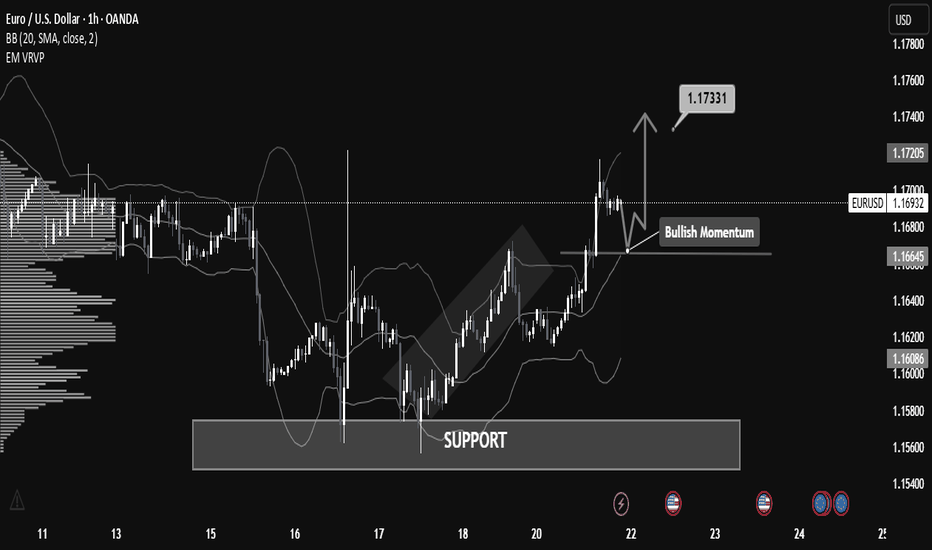
Price previously consolidated in a broad horizontal channel, with a strong demand zone (support) established between 1.16000 – 1.16600.
Following a deep liquidity grab on July 17-18, the price bounced sharply from support, creating higher highs and higher lows – a classic bullish structure.
Current momentum shows bullish continuation, as the price broke above local resistance around 1.16645 and is now forming a potential bull flag or bullish pennant pattern.
🟢 Bullish Momentum Confirmation
Price is currently retesting the broken resistance (now acting as support at 1.16645).
If the support holds and bullish momentum continues, the measured move target projects a price move toward 1.17331, the next significant resistance level.
This is also supported by increased volume activity in the breakout zone, as seen on the VPVR.
📊 Key Technical Levels
Level Type Description
1.16000 Major Support Historical demand zone + liquidity grab
1.16645 Support Zone Previous resistance, now retest area
1.16926 Current Price Bullish consolidation forming
1.17331 Resistance Bullish target based on breakout projection
1.17700+ Extension Potential continuation level if momentum persists
🧠 Volume & Volatility Insight
Bollinger Bands are expanding post-breakout, indicating increasing volatility and a potential trend continuation.
VPVR shows a high-volume node around 1.166, confirming it as a strong demand zone.
🔎 Outlook & Strategy
✅ Bullish Bias
As long as the price remains above 1.16645, buying dips could be a favorable strategy.
A break above 1.17000 with strong volume could open a path toward 1.1733 and higher.
❌ Invalidation Level
A strong close below 1.16600 would invalidate the bullish setup and could return price to the lower support around 1.16000.
📌 Conclusion
EUR/USD is displaying strong bullish momentum after breaking a key resistance level and forming a solid support base. A breakout above 1.17000 may lead to a continuation toward 1.17331 and potentially higher. This setup favors bullish positioning with tight risk management.
Eurousdlong
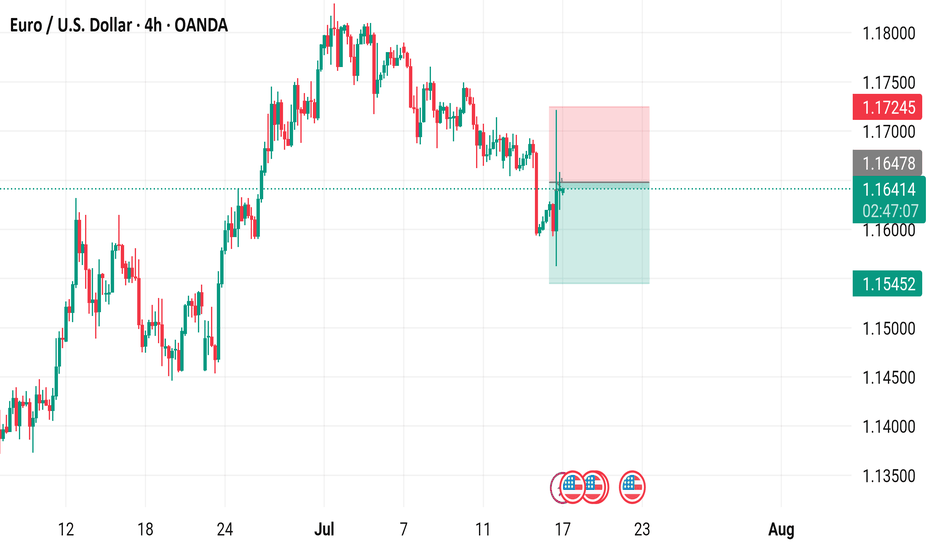
EUR/USD 4-Hour Chart - OANDA4-hour performance of the Euro/US Dollar (EUR/USD) currency pair on the OANDA platform as of July 17, 2025. The current exchange rate is 1.16408, showing a slight decline of 0.01%. Key levels include a buy signal at 1.16417 and a sell signal at 1.16399, with recent price action ranging between 1.1452 and 1.17245. The chart includes candlestick patterns and shaded areas indicating potential resistance and support zones.
"STOXX50/EURO50" Trading Plan: Ride the Wave or Get Trapped?🚨 EUROPEAN INDEX HEIST: STOXX50 Breakout Robbery Plan (Long Setup) 🚨
🌟 Hi! Hola! Ola! Bonjour! Hallo! Marhaba! 🌟
Attention Market Bandits & Index Robbers! 🏦💶💸
Using 🔥Thief Trading tactics🔥, we're targeting the STOXX50/EURO50 for a clean breakout heist. The plan? Go long and escape before the MA trap snaps shut. Overbought? Yes. Risky? Absolutely. But real thieves profit when weak hands panic. Take your cut and run! 🏆💰
📈 ENTRY: TIME TO STRIKE!
Wait for MA breakout at 5460.00 → Then move fast!
Buy Stop Orders: Place above Moving Average
Buy Limit Orders: Sneak in on 15M/30M pullbacks
Pro Tip: Set a BREAKOUT ALARM - don't miss the action!
🛑 STOP LOSS: DON'T GET CAUGHT!
For Buy Stop Orders: Never set SL pre-breakout - amateurs get burned!
Thief's Safe Zone: Recent swing low (5300.00 on 4H chart)
Rebels: Place SL wherever... but don't cry later! 😈
🏴☠️ TARGET: 5680.00 (OR ESCAPE EARLY!)
Scalpers: Long only! Trail your SL like a pro
Swing Traders: Ride this heist for max gains
💶 MARKET CONTEXT: BULLISH BUT TRAPPY
Fundamentals: Macro data, COT reports, Quant analysis
Market Sentiment: Intermarket flows, positioning
Full Analysis: Check our bio0 linkss 👉🔗 (Don't trade blind!)
⚠️ WARNING: NEWS = VOLATILITY TRAP!
Avoid new trades during high-impact news
Lock profits with trailing stops - greed gets you caught!
💥 SUPPORT THE HEIST!
Smash that Boost Button 💖→ Stronger crew = bigger scores!
Steal profits daily with the Thief Trading Style 🎯🚀
Next heist coming soon... stay sharp! 🤑🐱👤🔥
EUR/USD) Big Support level Analysis Read The ChaptianSMC Trading point update
Technical analysis of EUR/USD on the 1-hour timeframe. The idea centers around a potential reversal from a major support zone, aiming for higher resistance targets. Here's a detailed breakdown:
---
1. Big Support Level
A strong horizontal support zone is highlighted around 1.1275–1.1290.
Price is currently reacting off this level, suggesting a potential bullish reversal.
2. EMA 200 as Resistance
The 200-period EMA (~1.1346) is above current price, possibly acting as a dynamic resistance.
A break and hold above it could confirm bullish momentum.
3. Resistance Levels & Target Points
The first target is the 1.14367 resistance level, a clear supply zone.
The second target point is around 1.15622, aligned with a previous major high and strong resistance zone.
4. RSI Indicator
RSI is at 44.02, indicating neutral to slightly oversold conditions—this supports a potential bullish move, especially from support.
5. Forecast Path
The chart projects a likely pullback and breakout pattern:
Rebound from the support zone.
Break through EMA 200 and minor resistance.
Rally toward first and second targets.
Mr SMC Trading point
---
Summary of the Idea:
This is a trend-reversal-to-continuation setup, with EUR/USD expected to rise from a key support area toward 1.14367, and potentially 1.15622, provided price holds above the support and breaks the EMA 200.
Pales support boost 🚀 analysis follow)
EUR /USD) bullish flag Analysis Read The ChaptianSMC Trading point update
This is a bullish technical analysis on the EUR/USD pair (2-hour chart), projecting a long opportunity based on price action and market structure.
---
Key Elements of the Chart:
1. Strong Key Support Zone:
Marked around 1.09273, acting as a critical base.
Price previously reacted strongly from this level, confirming it as a high-probability support area.
2. Bullish Channel:
The pair is moving within an ascending parallel channel.
Price is currently rebounding off the lower channel trendline, suggesting upward continuation.
3. Breakout & Retest Pattern:
A small flag/pennant correction is shown after a strong bullish impulse.
Expected breakout from this flag will lead to continuation toward the upper resistance.
4. Target Zone:
1.12977 is marked as the final target point, around 2.55% (281.4 pips) away from the current price.
Previous high structure adds confluence to this target.
5. RSI (14):
RSI is hovering around 50.5, indicating neutral momentum but room for upside.
No clear divergence, but aligned with a possible bullish continuation.
6. 200 EMA (1.08501):
The price is above the 200 EMA, supporting the bullish bias.
Mr SMC Trading point
---
Conclusion/Idea:
This analysis suggests a long setup on EUR/USD, with:
Entry idea near the key support (1.09273),
Bullish flag breakout in progress,
Target near 1.12977,
Risk management advised below support or lower channel.
Bullish Bias: Price structure, EMA support, and trend channel favor a long setup.
---
Pales support boost 🚀 analysis follow)
EUROUSD TRADING POINT UPDATE > READ THE CHAPTIAN Buddy'S dear friend
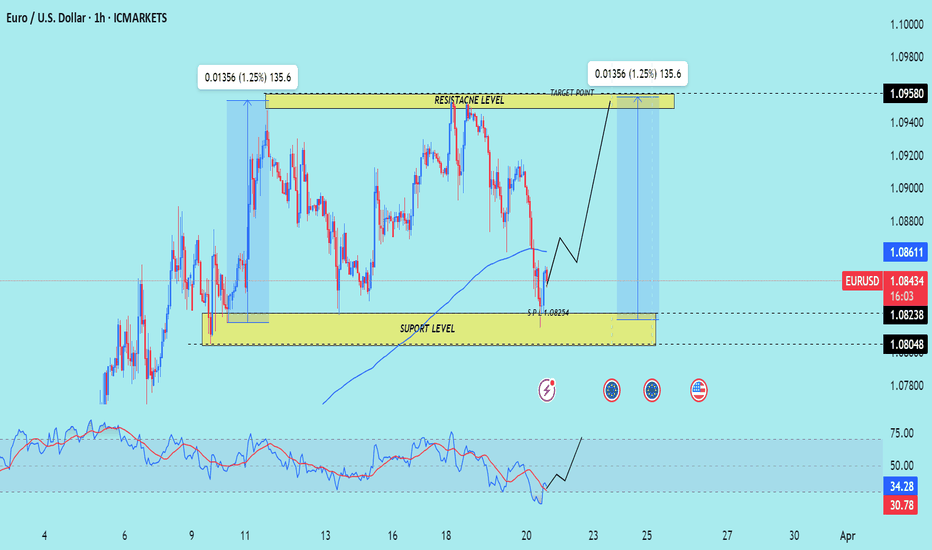
SMC Trading Signals Update 🗾🗺️ Euro USD Traders SMC-Trading Point update you on New technical analysis setup for Euro USD ) Euro USD Technical patterns support level pullback up trend 📈🚀 1.08254 strong 🪨 support level target 🎯 point Resistance level 1.09580 good luck 💯💯
Key Resistance level 1.09580
Key Support 1.08254
Mr SMC Trading point
Palee support boost 🚀 analysis follow)
EUROUSD TRADING PINT UPDATE >READ THE CHPATIAN Buddy'S dear friend
SMC Trading Signals Update 🗾🗺️ SMC-Trading Point update you on New technical analysis setup for Euro USD) Euro USD) Technical patterns choch looking for Bullish patterns support level 1.0866 Resistance level 1.09361 ) good luck guys 🤝
Key Resistance level 1.09361+ 1.09483
Key Support level 1.08802 - 1.08666
Mr SMC Trading point
Pales support boost 🚀 analysis follow)
EUROUSD 4H LONG (3 Targets DONE)Re-opening in the specified block after confirmation of the level of $1.03744 brings 3 targets for the position.
Considering the current formations on the 1D TF, the probability of price growth to the current maximum increases multiple times. Locally, I expect to see a price correction (a rollback next week) and preferably with a depiction of a bullish imbalance. After which, you can work long for a whole month until 1.12758
EUROUSD TRADING POINT UPDATE> READ THE CHAPTIN Buddy'S dear friend 👋
SMC Trading Signals Update 🗾🗺️ Euro USD Traders SMC-Trading Point update you on New technical analysis setup Euro USD breakout of MA 200 ) Now 👍 Looking start with bullish trend 📈 🚀 analysis setup update fisrt I look short 1.04918- 1.04322). That' is good buying zone ☺️) target point 1.5540)
Key resistance level 1.05215 +1.05540
Key support level 1.4500 1.043222. .104107
Mr SMC Trading point
Support 💫 My hard analysis setup like And Following 🤝 me that star ✨ game 🎮
EURUSD - The Time has Come!I'm a little late to the trade because I missed the retest of the 1.095 Bi-monthly level, but a new setup above 1.103 is still valid.
The monthly trend has just issued a bullish signal. This is something that hasn't happened since Nov '20 so I think it is worth the risk after so many attempts to break out of this range.
Will love to see this close above 1.10375 for the month of August. This will add a lot more conviction for the breakout play.
💥EUROUSD) next move 💥🚀🚀hello trader’s what do you think about Eurousd ) analysis ideas 💡??
…………………………………………………🧐
Euro 💶 usd …………………………….🧐
Analysis …………………………………🧐
Support levels………1.08789———🎚️
Support levels………1.07500———🎚️
Resistance levels__1.09500———🎚️
Resistance levels—1.10145———. 🎚️
Resistance levels—1.10963———-🎚️
Trader’s follow support and resistance levels 👍🏻💡…………………
Plaes like 👍🏻 and comment ⚙️🙏)🙏 FX:EURUSD
EURUSD in UpwardUpward after retracement.
Upward after retracement
Upward after retracement
Upward after retracement
Upward after retracement
Upward after retracement
Upward after retracement.
Upward after retracement
Upward after retracement
Upward after retracement
Upward after retracement
Upward after retracement
Upward after retracement.
Upward after retracement
Upward after retracement
Upward after retracement
Upward after retracement
Upward after retracement
Comment if you agree
EUROUSD GBPUSD Daily Timeframe analysisOANDA:EURUSD FX:GBPUSD Daily timeframe analysis
Trendline break and strong consolidation
Bullish Structure confirmed after forming LL-LH-HL and candle closed 0.618 level 1.06265
RSI Bullish Exaggerated Divergence (Candle Equal Low but RSI formed HL-HL) confirmed before break of 0..618 level.
We can see upcoming targets as shown in chart.
Comeback After Being Wiped Out From Trading News Indeed my timing was off... I was long already and didnt time the drop well and went full margin and got wiped out. High risk trader as i like to capture moments using high risk. The news was already anticipated, but my timing was off. im learning. so after being wiped out instantly, I said no, im not going out like that. i see a clear opportunity that presented itself despite being taking me out, i stayed calm and reloaded margin and strike back. They could call it revenge trading but that's only when the profit you make is not enough to take anymore which is a problem most of us can relate to. Losing money isnt fun but think about it, we have the skill to unlock wealth. worry for what!
Also with DXY retracing, it was destined. As long as we follow our rules and dont break it we will be good. In the video i covered why I have a "reference point" and how it's my spesho number. I pointed out many things and a sauce of mine so if you agree please send confirmations cause i believe the universe never lied once. this my passion.
to the top.
EURO long for longer period of time..EURO i may take position as market open and keep it for month "Hope fully" :D if SL dint hit.
Double bottom in daily/4hr time frame
weekly demand zone,,,, (support area)
Forming morning star in weekly time frame at the weekly demand zone and near to support range
in 15min H&S breakout is there
💵Euro/U.S.Dollar💵Analyze !!!Euro moved in Descending Channel more than one year, and these days we saw that the Euro was able to break lower line of Descending Channel , from my idea, this break can be a fake-out and Euro will back again to its channel.
I have some reasons for this fake-out : Euro is at my TRZ (Tiem Reversal Zone) + Junction between 61.8% Fibonacci line of Pitchfork and 25% Fibonacci line of Pitchfan + Cluster of Fibonacci ( PRZ (Price Reversal Zone)) + Also we can see support zone and an Important Support Line under the current price of Euro .
🔅 Euro can go UP from the Current Price at least until the lower line of Descending Channel , and in the next step can touch the middle line of the Pitchfork .
🔅 Euro/U.S.Dollar Analyze ( EURUSD ) Timeframe 4h ⏰
🟢 Price Reversal Zone ( PRZ ): 1.0907$ until 1.0894$ =Cluster of Fibs
🟢 Support Zone : 1.0776$ until 1.0725$
Do not forget to put Stop loss for your positions (For every position that you want to open).
Please follow your strategy , this is just my idea, and I will be glad to see your ideas in this post.
Please do not forget the ✅' like' ✅ button 🙏😊 & Share it with your friends; thanks, and Trade safe.


