Euroyen


EUR/JPY H4 SETUPPrice is currently at an H4 bullish order block and I expect it to reverse to the upside. Given the hawkish tone of the Fed this morning, its advisable to wait for a M15 break of structure before entering. Good Luck!

EURJPY Currency Market Is BullishEURJPY. Bullish Engulfing Candlestick On The 4H Chart. Euro Yen Market Remains Bullish.

EURJPY Target Price 130.6962H Chart (Candlestick Closed Above Level)
4H Chart (Bullish Engulfing Candlestick)
Watch For Bullish Price Action Signals At The Support Levels. Watch for signals at the EMA 10 Level, EMA 20 Level, Trend Line Level, and Horizontal Line Level.

EURJPY buy ideaNot much analysis to go over with this potential trade, we are currently trading within a range where the resistance is signifacntly strong meaning any bullish momentum beyond this could be a continuous move to the upside.
The key here is to watch out for potential fakeouts that we have seen over the past few trading days, the market is having a blast with fakeouts in ranges so it is important we only take trades with high probability set-ups.
As always, if you like this potential idea and have any feedback, please leave and like and comment. If you have any requests for pairs or suggestions feel free to let me know, I'll be happy to get back to you :)

EUR/JPY_4H_ShortShort Position has taken. Price broke a demand zone in 4H timeframe and it did a pullback.
It is a Short-term bearish target. The tp is the next demand zone.
R/R = 1:1.63

EUR/JPY_4H_LongThe long position taken. The price broke a monthly resistance and also in Daily timeframe and 4H timeframe is bullish.
The TP is the level of komu. ( it is a conservative TP, cause I can put it on last week high).
R/R = 1:2.12

Euro/Yen Bearish ABCD Here on the yen we have a Bearish ABCD Pattern. Price Rocketed up to the completion point. now we will be keeping an eye out for what the RSI will do we are looking for a test of the 50 line and then return to the extreme. when it does we enter when the RSI is on its way out of the extreme again!

EURJPY - To Break HigherEURJPY has been rangebound over the past few days.
Price appears unable to break the support level at the 133.600-133.700 area, and so I am expecting a break to the upside to continue the overall bull trend.
Entering at the support level offers a good risk:reward ratio with a small stop loss should price happen to break lower.

EURJPY - BullishLooking for a quick 60 pips on EURJPY as I anticipate it to make a bullish push through it's current zone, to revisit the 2021 highs.
The 100 EMA offers support for price to move higher.

EUR/ JPY (Euro/ Yen) Here on the Euro Yen we have a bearish bat pattern on the 4H. The two oscilitators on the right are currently not looking like there is going to be any movement at the moment. were gonna be looking for some type of movement into the extreme levels. the pattern completed in a strong area of resistance on the daily. we will be looking for a good push into the resistance and then a strong rejection. Putting a limit order below the resistnce level might be the best way to pproach this pattern. Becasue i do feel it will be a strong rejection like we saw on Pound Yen where price just rocketed out of the area. This is the oppritunity for a good long Swing/ position trade as a much larger Bearish ABCD attern has completed on the Daily Chart. So, either take your profit on the 4H pattern or scale your profit on the much larger pattern on the Daily! We are looking for a 700+ pip move on the Daily pattern! Sorry for not going into more detail im a bit behind on some school work. I am currently working on some courses including teaching harmonic patterns based on the writings of Scott Carney along with a myriad of other topics. Once the courses become active I will be upgrading my membership here on TradingView to Premimum to advertise them. So, be on the look out; moreover, like I said earlier im a bit behind in school at the moment but once im eirhter caught up or finished with the semester I will complete them.

EURJPY breakout setup targeting 132 handle...Here's what's cooking in the forex front. Just waiting for a confirmed breakout here.
Measured move to 131 handle and a second target near the 132 handle which is a weekly resistance level.
Not trading advice.
DYOR. TAYOR!

EURJPY attempting to break higher? Key level to watch.Watching that 127.00 as a potential support for a move higher to that 129.30 level.
Needs a confirmed breakout signal first.


EURJPY Short Opportunity for +/- 80 pipsEURJPY Short Opportunity
Confluences:
1) Price has been rejected many times from the top half of a 3-month range
2) In the Weekly timeframe and 1H; 9 EMA is crossing the 21 SMA to the downside
3) Big bearish engulfing candle closed last week
4) In the Daily chart; price broke the 100SMA last friday
5) Price broke the bottom support of the said range
and has already confirmed it for 2 times as now a strong resistance
------------------------------
I wish BIG profits to you ALL!!!
-----
I am grateful to have been taught by God and myself on trading.
My money grows every day in increasing quantities on a continuous basis.

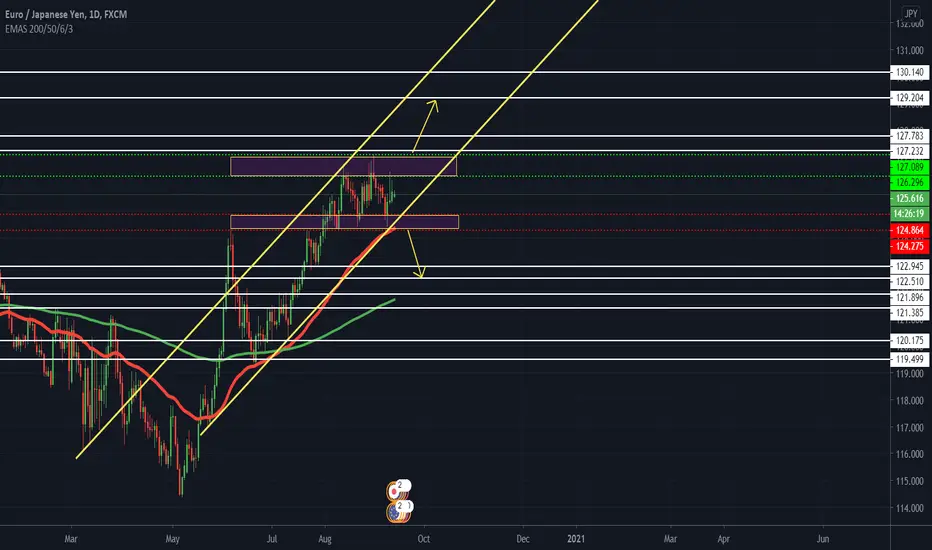
EURJPY - Where to go next?! EURJPY - Stuck within a range.
At this current moment of time, if you look at the pairs of the majors EURO and YEN, They both actually in a range combining the minor pair EUR/JPY this makes sense to be in a range as well.
Fundamentally, we do have the FOMC this week on Wednesday, which could increase the volatility towards these pairs majors and the minor pair of EUR/JPY. Overall, the most important factor that comes out of FOMC this week will be the AIT - I've been stating since last FOMC meeting as there wasn't much information needed but as time as came and they have announced they aim the target of 2% inflation target, give or take below or higher usually they would increase rate hikes but that isn't the case this time that's an important factor to keep in mind. However, it's all good saying they want 2% target but we need clarity. Key question I want out of this FOMC meeting - HOW are they going to reach 2% target? It's getting near to the time where we need answers.
If they execute correctly giving clarity perspective on how they will achieve the AIT - I expect the market response Equities, precious metals to rise and T notes to decline. Vice versa if there is no defined plan I expect the opposite to occur.
Technical aspects: EUR - Range JPY - In Pennant - Indecision for both Major pairs. EUR/JPY - Indecision
Within the daily, we are within the range, to state it more clearly I've put red lines to show under where the bears would be in control and the green lines on where the bulls are in further control and keep an eye on the 50 EMA If we passed below with perhaps a bear candle closing below - bears are in control. To make it easier for trading you could always add alerts or orders in either direction. EUR/JPY is a great sentiment for when there is risk on/off.
Overall, be careful trading this week with the FOMC on tap.
All the best,
Trade Journal
(Just a trade idea, not a recommendation)
EURJPY ShortPrice has formed a double top pattern on the weekly resistance level and has already broken out of its neckline. A retest or pullback at the neckline would be a good entry for shorting this pair.

EURJPY | Trendline Breakout Done ..!!#EURJPY (Update)
In Daily Chart, Trendline Breakout Done & Now Heading towards the Major Resistance (121.00) But Before that It Might Retest the Trendline (119.20)
Please like the idea for Support & Subscribe for More ideas like this and share your ideas and charts in Comments Section..!!
Thanks for Your Love & Support..!

EURJPY Could be Ready to Fall! SHORTI'm noticing the EURJPY is running into the overall daily downtrend right now and could be ready for a short if conditions are right.
I'm being relatively cautious about this one because it it could turn on me and push up to daily resistance around 121.4. Additionally, although this is a short, I'll only be looking to take profits down to the 61.8 fib mark, incase it's merely a retrace before heading higher.
Engagement:
I'm waiting for 2 things here:
1 - Break in recent Trend Line
2 - Break and close below support at 119.383
TRADE SPECIFICS:
ENTRY - 119.383
TAKE PROFIT 1 - 117.625
TAKE PROFIT 2 - 116.673
TAKE PROFIT 3 - 115.489
STOP LOSS - 120.371 (Need it a little high to clear some wicks)
RISK : REWARD - 2.68
If you like my ideas, please LIKE and FOLLOW me! :-)
Reminder - this is not financial advice, simply an idea. Please do your own research before entering any trades and ensure you use risk management such as stop losses.
Remember, there is only 5 outcomes when you enter a trade:
1. Break Even
2. Small Win
3. Small Loss
4. Big Win
5. Big Loss
Eliminate #5 from your future options.
Happy Hunting!

EURJPY - Break to Daily low?EURJPY downtrending on higher TF with yesterday's daily candle (spinning top) indicating slowing momentum from last Thursday's bull run (up from a 3 year daily low) and a potential reversal. Further indication of this is the observed rejection of the D1/H4 downtrending TL.
On H1 we observe price being supported at the 116 psychological level. I am anticipating a break and potential retest of this level to go short.
Targeting the daily low for a potential 150 pip move.


EURJPY Long Trade setup | Triangle breakoutbuying some below 118.490 for 0.25% to 0.50% target only 30 min candle close above trend line
else wait for trade to complete
