FOREX ANALYSIS : EURAUDFX:EURAUD
The blue and red lines mean: I think prices can return in these areas.
Green lines mean: I think the price can reach these areas. They are therefore known as transaction targets.
If you want to use this deal, please risk only one percent of your account balance.
Eurshort

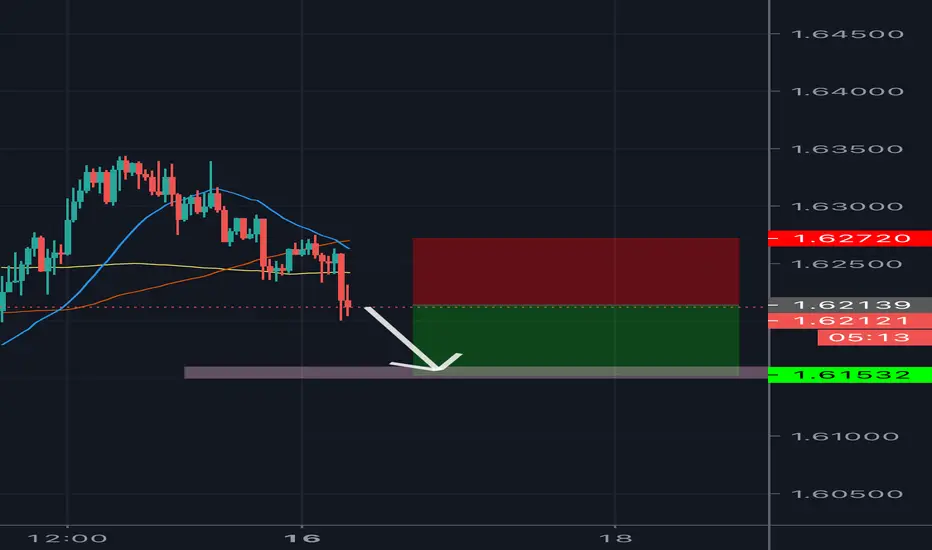
FOREX ANALYSIS : EURGBPFX:EURGBP
The blue and red lines mean: I think prices can return in these areas.
Green lines mean: I think the price can reach these areas. They are therefore known as transaction targets.
If you want to use this deal, please risk only one percent of your account balance.

FOREX ANALYSIS : EURAUDFX:EURAUD
The blue and red lines mean: I think prices can return in these areas.
Green lines mean: I think the price can reach these areas. They are therefore known as transaction targets.
If you want to use this deal, please risk only one percent of your account balance.

EUR/USD Analysis - Federal Reserve & Interest Rates - SELLAhead of this week's Federal Reserve interest rate decision.
We look at why the markets are turning hawkish on their expectations for the U.S Central bank to raise rates to deal with the high inflation.
We look at why this will cause EUR/USD to continue its downtrend when we look at U.S Bond Rates relative to European Bond Rates and how the differential drives the direction of the currency pair.

EUR/USD Re-distribution Wyckoff, potential short. Hi Traders,
See above my video explaining my thoughts around EUR/USD and wyckoff for a potential short.
Please leave a comment and let me know your thoughts.
TH from RT-Trading.

Sell Signal for EurJpyHello, I'm looking to sell this trade after it breaks that HH that is on lower time frames.
Last week there wasn't much for me to trade or that I felt sure so I took a break.. I did trade on AUDCAD for 50 pips in the last couple of days but decided to not post it.
This has been super bullish for the past week I'm looking for this reversal but again I'm only going to enter if BOS occurs.
This is a Trade that I'm looking to BUY or SELL:
BUY/SELL: SELL
ENTRY: EurJpy
Lot size: 2-3%
Stop Loss:133.500 (20Pips SL)
TP1:132.900
TP2:132.540
TP3:(SWING)
*Disclaimer:
Futures, Options, and Currency trading all have large potential rewards, but they also have large potential risk. You must be aware of the risks and be willing to accept them in order to invest in these markets. Don’t trade with money you can’t afford to lose. Past profits do not guarantee future results.***

EURUSD ShortEURUSD has reached support(red), but since DXY has been making higher highs on the daily I am bearish on EU so I am expecting it to breakdown from the red key level then the green support level and finally go retest the orange trend line to form a lower low. Please let me know what you think in the comments and follow me if you want to see more of my simple but profitable setups


EURJPY - Bearish PA broke out of ascending channel, while also struggling to clearly break out of 129.800 level. To add confluence we see our LH and LL structure to give our bearish bias. #CrystalFX

EUR/JPY_4H_ShortShort Position has taken. Price broke a demand zone in 4H timeframe and it did a pullback.
It is a Short-term bearish target. The tp is the next demand zone.
R/R = 1:1.63


Russian Ruble - Higher Inflation data to trigger RUBLE Buying Fundamentals
Today's Russian inflation data could increase market bets of an interest rate hike by the Russian central bank in August.
Against low-interest-rate yielding currencies like the U.S Dollar and Euro, we could see a stronger Ruble as long as the risk of U.S sanctions on Russia does not persist.
Key Points:
Russia’s inflation currently stands at 5.50%.
This overshoots the central bank's inflation target of 4.00%
Markets betting on a rate hike by the Russian Central Bank August from 5.00% to 6.00%
Russian 10 Year Bond Yield sits at 7.20%.
Higher Inflation data could push up bond yields are cause the currency to strengthen.
What To Watch
Russian Employment Data & Unemployment Rate
Oil Prices
Inflation Rate
Trade Idea’s
Higher Inflation - Buy RUB
Technicals
RUB at major support levels against EUR @ 88.00
RUB at major support levels against USD @ 72.00
ATR Volatility
USD/RUB 5.64%
EUR/RUB 5.17%


EURUSD, non stable short now (correction done).Hi friends. EURUSD want going upper for a small distance i think 1.2162 is good chance for bulls. But now we will have a subcorrection for thi small growth and will see what can bring market future ... Target for bears 1.2110, 1.2077. Target for bulls - transit level 1.2162.
Levels thanks to X-Lines script. Follow me. I will update trade can change in any time.

EURUSD, short continue. Bears going to 1.2110 and 1.2077.Hi friends. EURUSD wont to stop at 1.2135 and solds continue. Next target for bears are 1.2110 and 1.2077 in near future. Exchange sold too big volume above 1.2162. Levels thanks X-Lines script. Follow me.

EURUSD, short to 1.2065. Correction or trend revers.Hi friends. "Earned" script show big volume of solds above 1.2110. I think its chance to go down to 1.2065 again. Levels thanks to X-Lines script. I will update.

analysis EURUSD#107
sell range: 1.21367
Targets: 1.21252- 1.21137- 1.21022
Stop loss The first goal: the profit to loss ratio is 1: 1 (1.21482)
If the first target is touched (close one third of trades)
Stop Losses Second and Third Objectives: 1.21367(Entry Range)
, If the second target is touched (close another third of trades)
And if the third target is touched (close the deal)

SELL EURUSDEURUSD looks like a nice sell at this price point. Its due a rejection and can retest my upper zone in which I have placed a 26 pip stoploss, any further than that then my short idea is probably wrong.

analysis EURUSDSales range: 1.18950
Targets: 1.18780-1.18610- 1.18440
Stop loss The first goal: the profit to loss ratio is 1: 1 (1.19120)
If the first target is touched (close one third of trades)
Stop Losses Second and Third Objectives: 1.18950(Entry Range)
, If the second target is touched (close another third of trades)
And if the third target is touched (close the deal)

analysis EURUSDSales range: 1.18549
Targets: 1.18232-1.17915- 1.17598
Stop loss The first goal: the profit to loss ratio is 1: 1 (1.18866)
If the first target is touched (close one third of trades)
Stop Losses Second and Third Objectives: 1.18549(Entry Range)
, If the second target is touched (close another third of trades)
And if the third target is touched (close the deal)


analysis EURUSDsell range: 1.18181
Targets: 1.18061- 1.17941- 1.17821
Stop loss The first goal: the profit to loss ratio is 1: 1 (1.18301)
If the first target is touched (close one third of trades)
Stop Losses Second and Third Objectives: 1.18181(Entry Range)
, If the second target is touched (close another third of trades)
And if the third target is touched (close the deal)
