EURCAD good setup for shortLook at chart.
1.On resistance zone.
2.Touched Trendline
3.61.8% FIB's
-------
Looking for breakout counter trendline and short.
| cover your's profit |
Goood luuuck!)
Eurshort

Fading Short Entry EURUSD DailyEURUSD extended to the top of its trading range, the 127.20% extension reached and the higher Warning Line on this Schiff met. Seemingly this pair is done painting its second corrective bull leg. Bears will try to have a go at it, bulls will take some profits and that can result in this pair reaching the 1.1600 area. Selling short 1.1750 with a 70 pip stop above 1.1820 and looking for 1R-2R targets here seem reasonable.

EURCHF SHORT, join the wave downi am expecting this FX:EURCHF to go down and breakthrough
the line now. thou it might make a correction
but it should now be going down
please like and follow.
thanks

EURUSD, DOWNTREND TENDENCYIts look like the price might be still going down.. best area to go short is at supply area. Always watch the price movement and wait for signal. (price action, break minor uptrendline at lower timeframe, or canddlestick pattern). Look for early entry point at lower timeframe. Always use good MM. ex: minimum risk reward ratio = 1:1.5


EUR USD - Where will go next?Hello everyone ! Let me show you my opinion about EUR - USD today , is moving into a triangle since a few weeks , i would try to open a short operation around 1.17400 with a tight SL and a little size . Then if will follow my idea will increase my position. Remember NFP friday.
Entry : 1.17400
SL : 1.17700
TP1 : 1.16500 TP2: 1.15700 TP3: 1.15300
See you next time , have a nice and profitable day traders.

EURUSD - Possible bearish outlookLooking at the 1hr chart the EURUSD has a few setups that look increasingly bearish:
1. Triple top reversal earlier in the session
2. Failure to create bullish break of longer term consolidation triangle
3. MA cross into bearish
4. Previous redbound on 4hr 100 MA being testing - awaiting confirmation
5. 'Threes a crowd' - Price down test into MA bearish cross
6. Testing 38.2 retracement from the low to triple top high area
6. MA on daily crossed into bearish earlier in the week
A lot of arguements for the bearish position, keeping the risk to minimum and trading what is seen with a logical stop location. If all the technicals are right theis should setup a limit risk opportunity with high reward.
Note this is only my personal opinions and NOT trading advice - I do not endorse any use of the above, it is for information only

EURUSD: Pending ShortEURUSD has been churning for 2 months. The triangle consolidation will break. My bet (I'm short) is that it will beak down.
I'm not expecting a clean break, as we are nestling above 2015-2016 resistance-turned-support and the weekly 200MA. This might produce a choppy environment. However, once these supports give way, I would expect a swift move to the lower 1.03-1.07 area.
I'm short and have been playing the range for the last 2 months for pocket money. Payday in EURUSD soon.
Only a move above 2018 high would shift me neutral at this point.

EURUSDHi,
We had an almost successful analyse on EUR last time and now many things are more clear for me in chart.Like we have a bearish pennant in chart and in that pennant we have another triangle formation that made more limits for EUR.
By all of that i think it's time for a short trade in this triangle with 2 target.
Target 1 = 1.163
Target 2 = 1.159
Stop loss = 1.181
Don't forget it's a short-term trade and i have much much lower targets for long-term that i will mention later.
Good Luck

EURGBP - A deeper look on the lower timeframeHere's the chart I've posted about the Short in this pair.
With this chart, I want to give a more in-depth view on the hourly chart, although I only manage my trades in the original chart.
You see the Blocks (orange & red).
These are very often important structures. They have their merit, and we can get useful information from them, supporting our decisions in trading.
The downsloping yellow Fork shows us the most probable path of price.
Now, price reached the CL already.
Then a decent pullback, leaving structure (red Block) on the chart.
After reaching the U-MLH, price got a natural rejection (price is stretched) and then released it's energy to the downside (pink WideRangeBar).
Of course, it must pull-back, just to take out the weak hands, sametime running into the next structure - the red Block.
From here we will see a important decision playing out - Bears vs. Bulls.
Keep in mind that the really important part plays on the higher timeframe. So this is just a more insight into the playground of the madness §8-)
P!

EURGBP Short After WashoutAfter the washout price is pulling back and offering a short opportunity.
Let's see if we can ride to the white centerline.
P!

EURUSD Approaching Support, Prepare For A BounceBuy above 1.2199. Stop loss 1.1999. Take profit 1.2293.
Reason for trading strategy:
EURUSD is approaching its support at 1.2070 (100% Fibonacci extension x2, 50% Fibonacci retracement, horizontal pullback support, descending channel support) where we expect price to bounce and rise to its resistance at 1.2293 (61.8% Fibonacci retracement, horizontal overlap resistance). We do have to be cautious of the intermediate resistance at 1.2199 (61.8% Fibonacci extension, 38.2% Fibonacci retracement, horizontal pullback resistance).
Stochastic (55, 5, 3) is approaching its support at 4.04% where a corresponding bounce is expected.

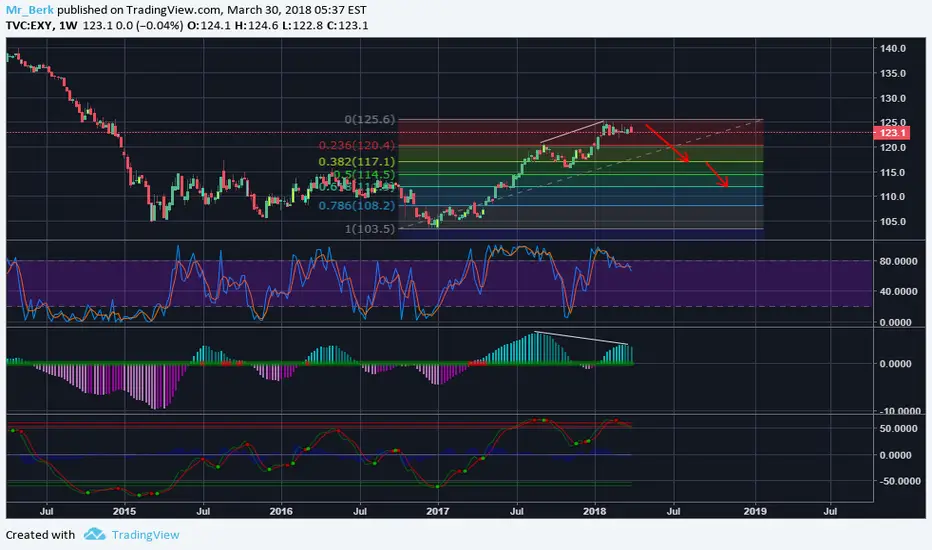
Euro Currency Index (EXY) will lose its power in future!!!Euro Currency Index seems that it will lose some power against other currencies during next weeks.
April and May will be very important for EXY.
Technical Analysis details:
-I observed a divergence on weekly chart which can start a new bearish trend.
-Stoch gives some bearish signals for future.
-Wave Trend Analysis gives some signals that we are at the top of weekly trend.
I hope you enjoyed with my analysis.
If you like my analysis, please follow and share.
Have a nice day.
Berk
EURUSD broke 2017, trend-line heading to 1.2000 zoneIt appears price broke the April,2017 up trendline and price is in a symmetrical triangle, with the green back strengthening it appears price will break the symmetrical triangle to the downside as well. Next logical stop appears to be in between 1.2700-1.2000 RANGE where important fib zone lies along with some strong support.

EURUSD time for a pullback ! Or time to start the long rocket ?Hey Traders :)
We think that EURUSD pullback to the last ascending trendline. If not there is a good possibility for a long setup !


Eurusd Ready for 1.14-1.145 be Alert Eurusd Trading around 1.1605 Level Strong Resistance above 1.17 level now Small support seems around 1.1570 where breakage may call for 1.14-1.1450 soon and if a jump so expected toward 1.1680 then a drop toward 1.14-1.1450 as not closing on Daily chart above 1.1720 be Ready for a drop.
Advice too sell pair in range of 1.1605-1.1680 sl above 1.1750 TP 1.1450

EURJPY SELL THE BREAKS LOWER I am no Bearish on this pair after we have broken out of the Daily channel (ascending wedge)
I was previously long on this pair but that is now invalidated (closed before stop triggered)

Overall ShortWith NFP giving the Euro a little more life against the dollar
We can see a retracement to 1.1845 - 1.187
Previous Post is still valid
Additionally we got a completion of a Bullish Bat Pattern
If one does decided to take a Long Position based on this pattern
I advise to take to 38.2 TP1 only
Will be monitoring PA at 1.1845 - 1.187 for signs of a bearish continuation
Bearish Targets @ 1.5

Everyone's long EUR, but is this a short opportunity?Hmmmm, I get it, long EUR because of current account differentials, QE taper, balance sheet normalisation, US political uncertainty, French elections over, everything rosy in Europe.
But often, the obvious is obviously wrong .
If EUR respects 1.20-1.21 as overhead resistance, then we could be looking at just a 50% retracement of the huge down leg.
Suggesting EUR downtrend will resume.
Why? I have no idea. But put the trade on first , and assess the why later.
Great risk-reward here.

EURUSD to short @ 1.18547Strong downtrend is still intact. I am looking for more downward movement and would like to participate around 1.18547 which is a good confluence area. Once zone will be hit, I will look for reason of entries
Short @ 1.18547
SL:1.19427
TP:1.17178
Follow us for more quality trades. September we had gather 1000+ pips.
*Disclaimer :
This analysis not include personal feeling/opinion, and pure base on technical analysis
Trading foreign currencies and crypto currencies can be risky and potentially profitable opportunity for investors. However, before deciding to trade, you should carefully consider your investment objectives, level of experience, and risk appetite. Most importantly, do not invest money you cannot afford to lose.


EURJPY - Short setup at historical resistance area
Price failing to close above 134.00 on 6 attempts.
Double top at historical support/res area.
We have a closing bearish candle outside the triangle, which gives us another signal to go short.
Target 132.500. Stop loss above 134.200
