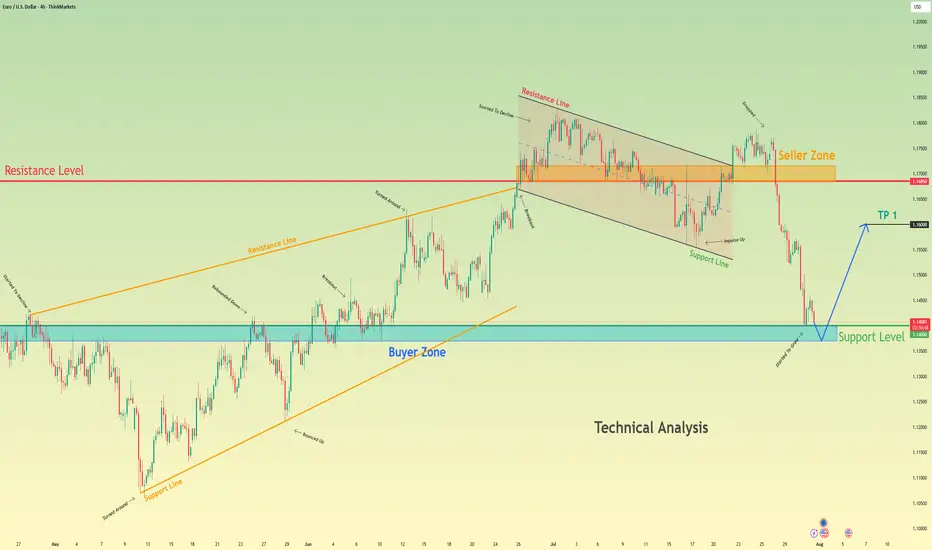
Euro bounce from buyer zone and start to move upHello traders, I want share with you my opinion about Euro. After a prolonged upward trend which formed a large rising wedge, the EURUSD faced a significant rejection from the seller zone near the 1.1685 resistance level. This failure to continue higher marked a key turning point, exhausting the bullish momentum and initiating a new bearish market phase. This new phase has since taken the form of a well-defined downward channel, within which the price has been undergoing a series of downward corrections and impulses. The most recent market action has been a sharp downward fall, accelerating the price's descent towards a critical area of historical significance. Currently, the pair is approaching the major support level at 1.1400, which also constitutes a strong buyer zone where demand has previously stepped in. The primary working hypothesis is a long, counter-trend scenario, which anticipates that the current bearish momentum will be absorbed by the strong demand within this buyer zone. A confirmed and strong rebound from this 1.1400 support area would signal a potential temporary bottom and the start of a significant upward correction. Therefore, the tp for this rebound is logically set at the 1.1600 level, a key psychological and technical point that represents a realistic first objective for a bounce of this nature. Please share this idea with your friends and click Boost 🚀
Disclaimer: As part of ThinkMarkets’ Influencer Program, I am sponsored to share and publish their charts in my analysis.
EURUSD
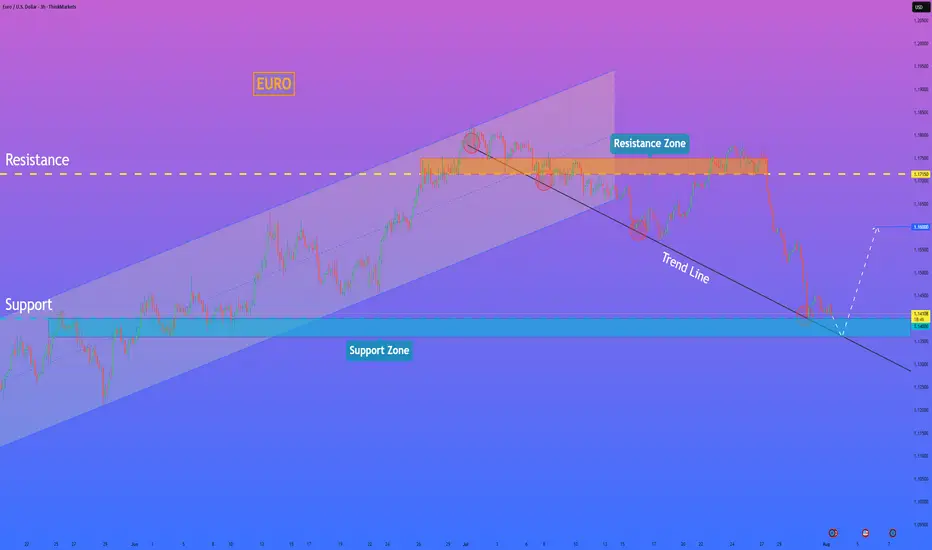
HelenP. I Euro will rebound from trend line to $1.1600 pointsHi folks today I'm prepared for you Euro analytics. A structural review of the chart shows a clear change in market character. The previous long-term upward channel has been broken, and the price has since entered a corrective phase, currently guided by a descending trend line. This decline has brought the asset towards a critical area of interest: the major horizontal support zone between 1.1400 and 1.1360. My analysis for a long, counter-trend position is based on the potential for a strong bullish reaction from the confluence of this historical support zone and the descending trend line. I believe that as the price reaches this intersection, the current selling momentum is likely to be absorbed by significant underlying demand. The main condition for this scenario is a clear and forceful rejection of lower prices from this zone, which would signal that buyers are stepping in to defend this critical level. A confirmed bounce would likely initiate a significant relief rally, and therefore, the primary goal for this move is set at the 1.1600 level, a logical first target for a corrective bounce of this nature. If you like my analytics you may support me with your like/comment.❤️
Disclaimer: As part of ThinkMarkets’ Influencer Program, I am sponsored to share and publish their charts in my analysis.
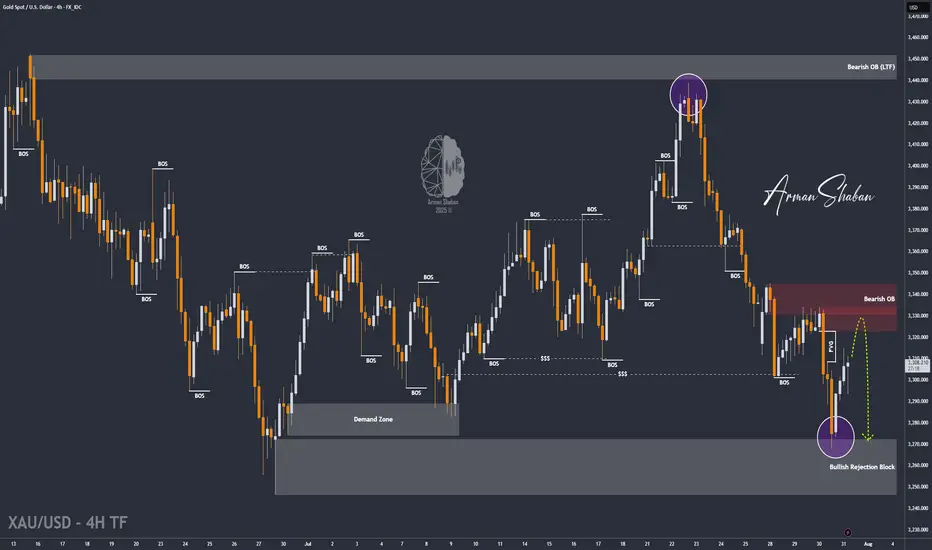
XAU/USD | Next Key Zone: Watch for Rejection at $3334! (READ)By analyzing the gold chart on the 4-hour timeframe, we can see that, just as expected, the price dropped from $3310 to $3288 in the first leg, where it hit a demand zone and bounced up to $3305, delivering a 170-pip rally. The main bearish move from $3333 to $3288 yielded 450 pips, bringing the total return on this analysis to over 620 pips!
In the second phase, gold dropped sharply again to $3268, and once more found demand, currently trading around $3307. If the price holds above $3294, we could expect further upside toward the $3322–$3334 zone. Once gold reaches this area, a strong bearish rejection is likely, with a potential return of 250 to 400 pips.
All key supply and demand levels are marked on the chart — make sure to monitor them closely and study the chart in detail. Hope you’ve made the most of this powerful analysis!
Please support me with your likes and comments to motivate me to share more analysis with you and share your opinion about the possible trend of this chart with me !
Best Regards , Arman Shaban
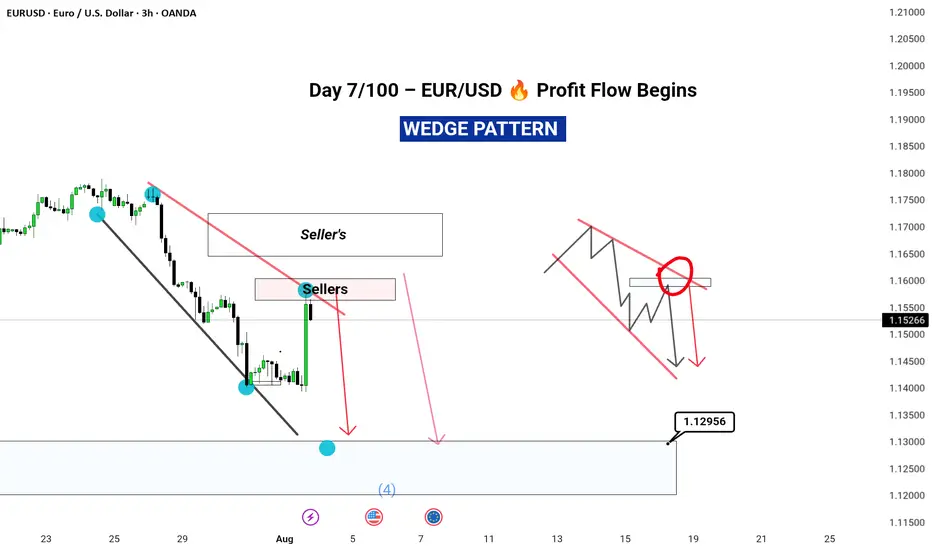
EUR/USD Elliott Wave Count Signals Downside TargetsThe EUR/USD chart is displaying a completed 5-wave Elliott impulse structure, suggesting the potential start of a larger corrective move to the downside. Wave 5 appears to have finished after a classic ending diagonal pattern, with price now breaking below the wave 4 support trendline — a strong confirmation of trend exhaustion.
Currently, price is retracing upward towards the 0.5–0.618 Fibonacci retracement zone of the last impulsive leg, around 1.15912–1.16383, which may serve as the final rejection zone for bears to re-enter. This area aligns perfectly with prior support-turned-resistance and is considered the potential reversal pocket.
If price holds below the 1.17869 invalidation level, the structure supports the beginning of an ABC correction or a larger bearish impulse.
Target 1 (T1): 1.14800
Target 2 (T2): 1.13915
Stop Loss (SL): 1.17869
This scenario remains valid as long as the price does not break above 1.17869. A clean break and close above this level would invalidate the bearish setup and suggest a possible wave extension.

EURUSD Down Trend As dxy is bullish Eurusd will be bearish. I need price to go to my eyeing level in the next couple weeks. we wait and see what price we want to do next week, Wednesday.

EUR_USD POTENTIAL SHORT|
✅EUR_USD has been growing recently
And the pair seems locally overbought
So as the pair is approaching
A horizontal resistance of 1.1632
Price decline is to be expected
SHORT🔥
✅Like and subscribe to never miss a new idea!✅
Disclosure: I am part of Trade Nation's Influencer program and receive a monthly fee for using their TradingView charts in my analysis.

EURUSD: Bears Will Push Lower
Remember that we can not, and should not impose our will on the market but rather listen to its whims and make profit by following it. And thus shall be done today on the EURUSD pair which is likely to be pushed down by the bears so we will sell!
Disclosure: I am part of Trade Nation's Influencer program and receive a monthly fee for using their TradingView charts in my analysis.
❤️ Please, support our work with like & comment! ❤️

“Exactly What I Saw” promises value and transparency.
In today's analysis, I’ve identified a clear completion of Wave D, securing a 3% ROI across just two trades – all before the move unfolded.
🔍 What’s inside this breakdown?
• Multi-timeframe analysis: Weekly ➝ Daily ➝ 4H ➝ 1H
• Elliott Wave structure with confluence zones
• Trade psychology at key turning points
• Exact entry & exit insights explained
• Risk management for consistent returns
---
⚡ Highlights:
Precise reversal spotted before it was obvious
No indicator clutter – just clean, confident price action
Part of my 100-day breakdown series: real, raw, and repeatable setups
---
👣 Day 7 of 100 is just the beginning.
Tap Follow to stay ahead of the market – one wave at a time.
#EURUSD #ForexAnalysis #ElliottWave #Forex #TradingViewUK #SwingTrading #PriceAction #RiskReward #FXMindset #ForexTradersIndia #ForexEducation
EURUSD BUYING CORRECTION AND SHORTThe price is now at a strong support level and if it can be a double bottom it will retest the descending channel line and reach the orange resistance, but in the general direction the price prefers to fall due to breaking the black uptrend line. We also have a more beautiful scenario, which is if it can break the strong support we will go with the downward trend.

EUR/USD Reversal or Trap? 4H Clean Breakdown InsidePrice just tapped into a high-probability sell zone after a corrective Wave 2 structure. With sellers already active at 1.16342 and 1.17635, this setup is not just textbook—but a potential goldmine for swing traders.
🔻 Is this Wave 3 continuation about to begin?
🔍 Liquidity swept. Zones respected. Structure still bearish.
⚠️ Many traders will miss the bigger picture here—will you?
👇 Drop your thoughts:
Are we about to break 1.13000?
Do you agree with the Elliott Wave count?
What’s your bias on DXY?
💬 I personally reply to every comment—let’s build this chart together.
🔥 If you caught the entry, show your entry point and reasoning—let’s level up as a team.

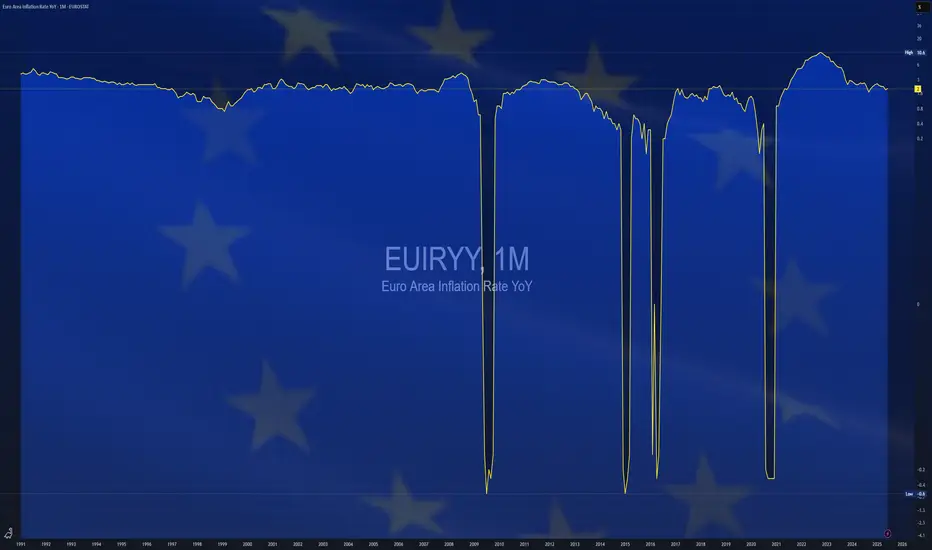
$EUIRYY -Europe CPI (July/2025)ECONOMICS:EUIRYY
July/2025
source: EUROSTAT
- Eurozone consumer price inflation held steady at 2.0% year-on-year in July 2025, unchanged from June but slightly above market expectations of 1.9%, according to preliminary estimates.
This marks the second consecutive month that inflation has aligned with the European Central Bank’s official target.
A slowdown in services inflation (3.1% vs 3.3% in June) helped offset faster price increases in food, alcohol & tobacco (3.3% vs 3.1%) and non-energy industrial goods (0.8% vs 0.5%).
Energy prices continued to decline, falling by 2.5% following a 2.6% drop in June.
Meanwhile, core inflation—which excludes energy, food, alcohol, and tobacco—remained unchanged at 2.3%, its lowest level since January 2022.
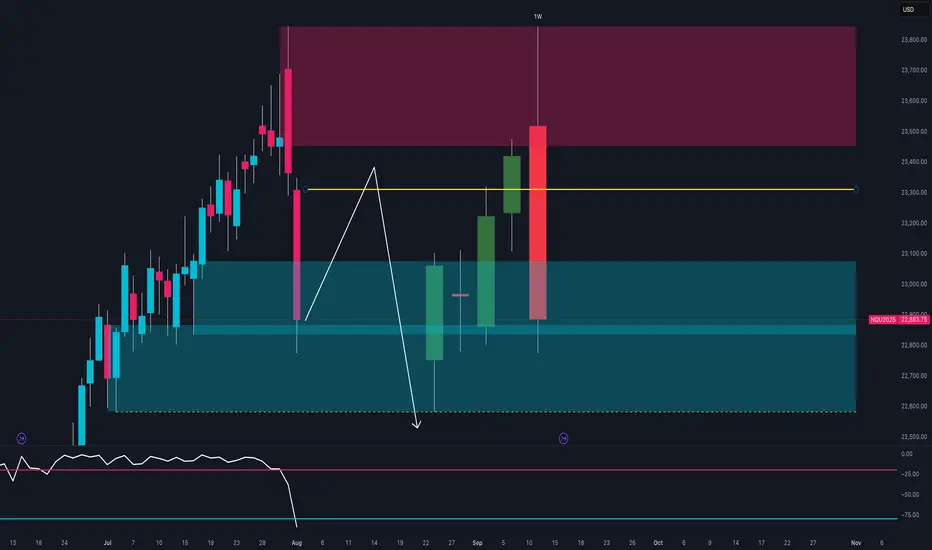
NASDAQ at Key Turning Point 🔍Technical Context
After testing the 23,600–23,800 supply zone, price printed a strong bearish rejection with a weekly engulfing candle.
The RSI broke decisively below the midline, signaling a clear loss of momentum.
Price is now trading back within the weekly demand zone between 22,800 and 22,950.
If a pullback toward 23,200 occurs, it could offer a fresh short opportunity, with downside targets around 22,600.
🪙 COT Report – July 29
Non-Commercials (speculators):
Long: +8,581
Short: +4,355
Commercials (hedging):
Long: +4,955
Short: +8,556
The market remains net long, but commercials are increasingly hedging with shorts.
The current imbalance — 88.6% long vs 11.3% short — suggests excessive bullish positioning, raising the risk of a correction.
🗓️ Seasonality – August
August is historically strong for the NASDAQ:
+222 pts (10Y)
+400 pts (5Y)
+912 pts (2Y)
While the trend is clearly bullish seasonally, caution is warranted:
Tops are often formed during the first half of August, followed by more pronounced corrections in September.
📉 Operational Summary
Primary scenario:
Wait for a retest of the 23,200–23,250 area
Look for rejection signals → enter short
Target 1: 22,800
Target 2: 22,600
Alternatively:
If 22,800 breaks on a strong weekly close, deeper downside scenarios may unfold.
EURUSD: Move Down Expected! Short!
My dear friends,
Today we will analyse EURUSD together☺️
The price is near a wide key level
and the pair is approaching a significant decision level of 1.15337 Therefore, a strong bullish reaction here could determine the next move up.We will watch for a confirmation candle, and then target the next key level of 1.15208.Recommend Stop-loss is beyond the current level.
❤️Sending you lots of Love and Hugs❤️

Major U.S. News Ahead—Will EURUSD Pivot?Good morning, my friends 👋
Here’s my EURUSD market analysis 📉
Currently, the pair is in a downtrend. I expect this downward move to end around 1.14899 or 1.14536, where a potential buying opportunity may emerge. I personally plan to enter a buy position once price reaches those zones 💼
Also, keep an eye on major U.S. economic reports being released today—they could trigger increased volatility 🔔
Every like you send is a huge source of motivation for me to keep sharing high-quality analysis 🙏 Thanks to everyone supporting the channel 💙

EURUSD – Smart Money Short Setup During NFP Friday | ICT Concept
EURUSD is trading inside a well-defined bearish structure after multiple internal liquidity sweeps during the London and Asia sessions.
As we enter the New York Killzone, price has returned to a bearish OB near the NY Midnight Open, with clear signs of exhaustion.
The pair failed to break above the Thursday OB zone, and the 15M chart shows consecutive MSS and BOS patterns, indicating supply is in control.
🧠 Trade Idea (Execution Plan):
Sell Limit: 1.14183
SL: 1.14422
TP1: 1.13877
TP2: 1.13608
TP3: 1.13351
📌 Confluence:
Bearish OB
NY Midnight Open rejection
MSS on LTF
RSI/Williams %R Overbought
📉 Structure: Bearish
🕒 Session: New York (NFP Volatility Expected)
💡 Context: USD is likely to strengthen after deep retracement into DXY OB, targeting 100.5–100.7
If price invalidates 1.14422 with bullish displacement, setup becomes void.
Patience is key during high-impact news – let Smart Money show their hand.

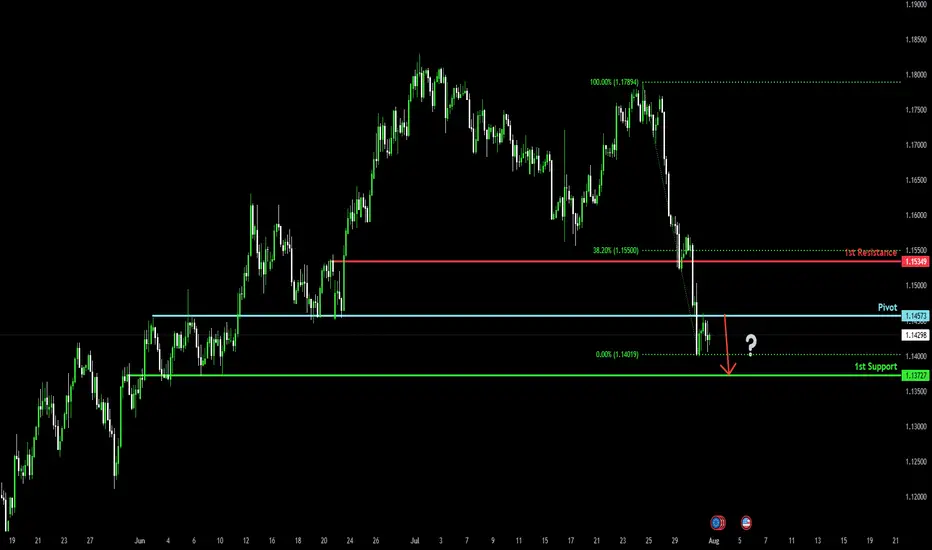
Bearish drop?The Fiber (EUR/USD) has rejected off the pivot and could potentially drop to the 1st support, which acts as an overlap support.
Pivot: 1.1457
1st Support: 1.1372
1st Resistance: 1.1534
Risk Warning:
Trading Forex and CFDs carries a high level of risk to your capital and you should only trade with money you can afford to lose. Trading Forex and CFDs may not be suitable for all investors, so please ensure that you fully understand the risks involved and seek independent advice if necessary.
Disclaimer:
The above opinions given constitute general market commentary, and do not constitute the opinion or advice of IC Markets or any form of personal or investment advice.
Any opinions, news, research, analyses, prices, other information, or links to third-party sites contained on this website are provided on an "as-is" basis, are intended only to be informative, is not an advice nor a recommendation, nor research, or a record of our trading prices, or an offer of, or solicitation for a transaction in any financial instrument and thus should not be treated as such. The information provided does not involve any specific investment objectives, financial situation and needs of any specific person who may receive it. Please be aware, that past performance is not a reliable indicator of future performance and/or results. Past Performance or Forward-looking scenarios based upon the reasonable beliefs of the third-party provider are not a guarantee of future performance. Actual results may differ materially from those anticipated in forward-looking or past performance statements. IC Markets makes no representation or warranty and assumes no liability as to the accuracy or completeness of the information provided, nor any loss arising from any investment based on a recommendation, forecast or any information supplied by any third-party.
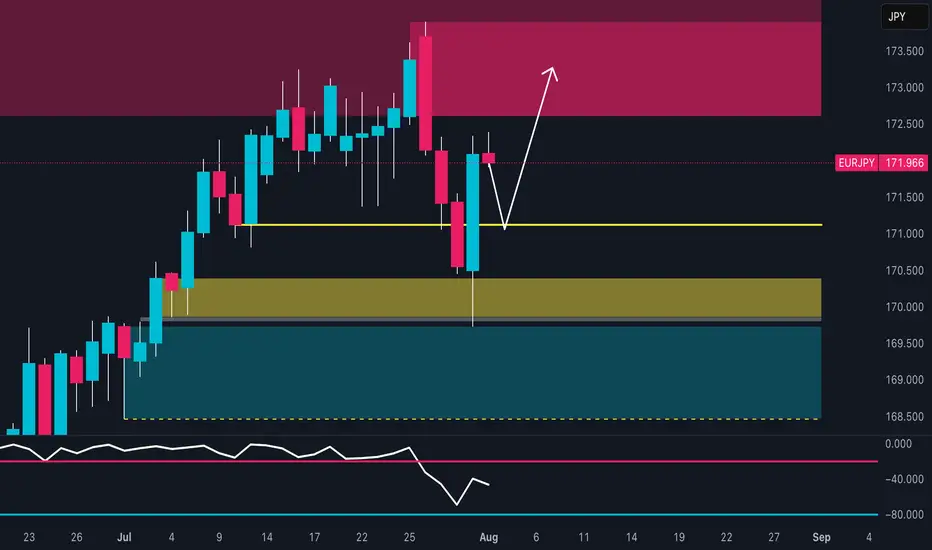
EUR/JPY Setup: Retail is 82% Short – Squeeze First, Drop After?🔹 Technical Context
Price reacted with a strong bullish wick in the 169.50–170.30 demand zone, signaling clear buyer defense. The RSI bounced from weakness but remains subdued, showing limited momentum.
📍 Current price action suggests a potential retest of the 172.50–173.30 area, which aligns with a supply zone, before a possible directional decision is made.
🗓️ Seasonality
Historically, August tends to be bearish for EUR/JPY:
5Y average: -0.48%
10Y average: -0.12%
15Y/20Y averages: -1.3% and -1.2%
📉 Seasonality indicates potential weakness, especially in the second half of the month.
🪙 COT Report (EURO & YEN) – July 22
EURO: Strong long accumulation by non-commercials (+6,284) and commercials (+17,575)
JPY: Net decline in both longs (-1,033) and shorts (-4,096), with a drop in total open interest
🧠 The market is heavily positioned on the Euro, while Yen positioning is fading. This creates a divergence between the two currencies, favoring a short-term technical bounce on EUR/JPY, though downside risks remain in the mid-term.
📉 Sentiment
82% of retail traders are short EUR/JPY
Volume: 1,564 lots short vs 352 lots long
📣 This extreme sentiment imbalance suggests a potential short-term squeeze against retail traders.
📊 Market Mood & DPO
Overall mood: Neutral
DPO at -9.0, Wyckoff score below 50
Momentum remains weak, but not showing a clear divergence.
🧩 Operational Summary
Retest of the 172.50–173.30 supply zone
Likely exhaustion in that area
Ideal setup: rejection + bearish confirmation
→ Targets: 170.30, then 169.00
EURUSD plunges without brakes – The bears take full control!EURUSD continues its steep decline as both macroeconomic and technical pressures mount. A trade deal unfavorable to the EU, combined with the Fed’s hawkish stance, has fueled USD strength and dragged the euro sharply lower. At the same time, strong U.S. labor data and rising employment costs further reinforce the bearish outlook.
On the H1 chart, EURUSD is clearly moving within a descending channel. Key price zones have been broken with no significant bullish reaction, indicating that sellers remain firmly in control. The market is heading toward a psychological support area, with no signs of reversal as RSI stays weak.
I remain biased toward SELL setups on any short-term pullbacks, avoiding countertrend trades in this environment. If downside momentum continues, deeper targets may still be ahead.
In a market dominated by bearish sentiment, trading with the trend remains the smartest and safest approach.

Fiber (EurUsd) Short Idea. Aug 4-8 This Idea wont be precise as my Last Euro Analysis, You can check that out on my Profile.
Now the what do i mean by it not being precise? it means that there is room for upside Movement But it should break that high (Fib high) and the target is Sell-Side Liquidity for this week Key Things in this charts are Liquidity gap, Breaker block IFVG weekly Inverse rejection block.

EURUSD: Strong Bullish Sentiment! Long!
My dear friends,
Today we will analyse EURUSD together☺️
The price is near a wide key level
and the pair is approaching a significant decision level of 1.15859 Therefore, a strong bullish reaction here could determine the next move up.We will watch for a confirmation candle, and then target the next key level of 1.16494.Recommend Stop-loss is beyond the current level.
❤️Sending you lots of Love and Hugs❤️


EURUSD The Week AheadKey Support and Resistance Levels
Resistance Level 1: 1.1716
Resistance Level 2: 1.1817
Resistance Level 3: 1.1885
Support Level 1: 1.1466
Support Level 2: 1.1390
Support Level 3: 1.1338
This communication is for informational purposes only and should not be viewed as any form of recommendation as to a particular course of action or as investment advice. It is not intended as an offer or solicitation for the purchase or sale of any financial instrument or as an official confirmation of any transaction. Opinions, estimates and assumptions expressed herein are made as of the date of this communication and are subject to change without notice. This communication has been prepared based upon information, including market prices, data and other information, believed to be reliable; however, Trade Nation does not warrant its completeness or accuracy. All market prices and market data contained in or attached to this communication are indicative and subject to change without notice.

EUR-USD Bearish Breakout! Sell!
Hello,Traders!
EUR-USD made a bearish
Breakout of the key horizontal
Level of 1.1460 then made
A retest and a pullback so
We are bearish biased and
We will be expecting a
Further bearish continuation
Sell!
Comment and subscribe to help us grow!
Check out other forecasts below too!
Disclosure: I am part of Trade Nation's Influencer program and receive a monthly fee for using their TradingView charts in my analysis.
