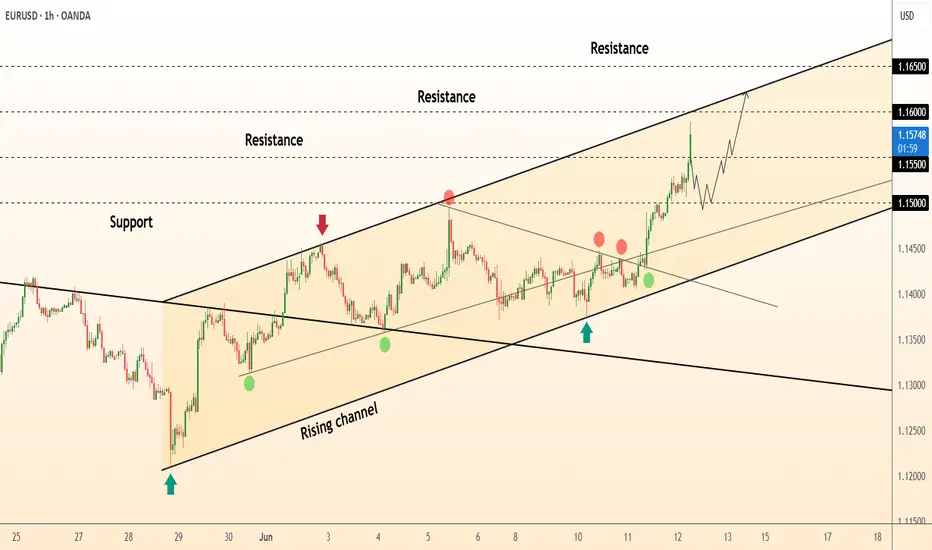
DeGRAM | EURUSD above the 1.15📊 Technical Analysis
● Hourly close above 1.1500 completed a small ascending triangle; price is now hugging the rising-channel’s upper rail after a chain of higher-lows, pointing toward the 1.1600 objective.
● Triangle top and channel mid-line overlap at 1.1500-1.1520; while candles stay above, risk : reward favours a push to the next fib / upper parallel near 1.1650.
💡 Fundamental Analysis
● US core-CPI eased to 0.1 % m/m, driving Treasury yields lower and lifting September Fed-cut odds >70 %, weakening the dollar, while ECB officials talked up a “data-dependent” pause, keeping euro bids firm.
✨ Summary
Long bias while price holds 1.1520; targets 1.1600 then 1.1650. Invalidate on an hourly close below 1.1470.
-------------------
Share your opinion in the comments and support the idea with like. Thanks for your support!
Eurusd-3
EUR/USD - Daily highs taken, now what?Introduction
The EUR/USD made a strong move higher today, establishing a clear uptrend on the 4-hour chart. With this latest push, it swept the daily liquidity above the previous high. The question now is whether the EUR/USD will continue moving higher or if there are opportunities for long entries at lower levels.
Liquidity Sweep
EUR/USD has taken out liquidity above the daily highs, where many stop losses are typically positioned. These stops have now been removed from the market. This area could potentially act as a support and resistance flip. However, if we see a 4-hour candle close below the previous daily high, further downside becomes likely.
Where Can We Look for Buys?
During the recent 4-hour move higher, significant progress was made. This upward movement created a daily Fair Value Gap (FVG) between $1.149 and $1.145. This FVG aligns perfectly with the golden pocket Fibonacci level, drawn from the swing low to the swing high. As a result, this zone forms a strong area of confluence for potential buy positions to target a retest of the highs.
Conclusion
Although we are currently breaking above the previous high, this move has yet to be confirmed as sustainable. Holding above this level is crucial. If a 4-hour candle closes below the previous high, it becomes likely that we will revisit the daily FVG and golden pocket Fibonacci zone.
Disclosure: I am part of Trade Nation's Influencer program and receive a monthly fee for using their TradingView charts in my analysis.
Thanks for your support.
- Make sure to follow me so you don't miss out on the next analysis!
- Drop a like and leave a comment!

USDCHF Bullish or bearish Detail ANAYSISUSDCHF is currently setting up for a classic bearish continuation pattern. After breaking down sharply from the key support turned resistance zone around 0.81500, the pair is now in the middle of a technical retest. Price is currently hovering near 0.81 and showing signs of weakness on lower timeframes. This retest into the previous demand-turned-supply area aligns well with the expectation of a further leg to the downside. As long as the price stays below 0.81500, sellers are likely to dominate, targeting 0.8000 in the near term.
From a fundamental perspective, the bearish pressure on USDCHF is supported by growing market speculation that the Federal Reserve may begin rate cuts sooner than previously expected. With the latest US CPI data confirming disinflationary progress and unemployment claims ticking higher, dollar strength is taking a hit. Meanwhile, the Swiss Franc remains relatively stable as the SNB continues its measured approach, with inflation staying well within target and no immediate pressure to cut rates. This monetary policy divergence favors further downside in USDCHF.
Technically, momentum remains strongly bearish. The recent bounce appears corrective rather than impulsive, suggesting the bears are still in control. If price rejects the 0.81500 zone with a clear reversal candle, we can anticipate a strong continuation move toward the psychological level of 0.8000. This level also aligns with previous demand zones and Fibonacci extension targets, making it a solid downside objective.
This setup is a clean example of trend-following structure with fundamental backing. USDCHF is preparing to complete a textbook retest before its next drop, offering a high-probability short opportunity. If the rejection confirms around 0.81500, sellers can expect a solid move toward 0.8000 with favorable risk-reward. The setup is ideal for short-term swing traders tracking USD weakness across the board.

EURUSD SHORT FORECAST Q2 W24 D13 Y25EURUSD SHORT FORECAST Q2 W24 D13 Y25
PERHAPS THE LAST CHANCE FOR SHORTS- GRAB A THE BEST DISCOUNT !
Professional Risk Managers👋
Welcome back to another FRGNT chart update📈
Diving into some Forex setups using predominantly higher time frame order blocks alongside confirmation breaks of structure.
Let’s see what price action is telling us today!
💡Here are some trade confluences📝
✅Weekly order block
✅15' order block
✅1 hour order block
✅Tokyo ranges to be filled
🔑 Remember, to participate in trading comes always with a degree of risk, therefore as professional risk managers it remains vital that we stick to our risk management plan as well as our trading strategies.
📈The rest, we leave to the balance of probabilities.
💡Fail to plan. Plan to fail.
🏆It has always been that simple.
❤️Good luck with your trading journey, I shall see you at the very top.
🎯Trade consistent, FRGNT X

Fundamental Market Analysis for June 13, 2025 EURUSDEvents to pay attention today:
12:00 EET. EUR - Foreign trade balance
17:00 EET. USD - University of Michigan Consumer Sentiment Index
EURUSD :
EUR/USD interrupted its four-day winning streak, retreating from 1.16310, its highest level since October 2021, and is currently trading around 1.15300 in Asian hours on Friday. The pair is depreciating as the US dollar (USD) gains support as traders shift to increased demand for safe-haven assets due to rising tensions in the Middle East.
Israel has attacked dozens of targets across Iran to eliminate its nuclear programme. Israeli Defence Minister Israel Katz said Israel could face a missile and drone strike after Israel's pre-emptive strike on Iran. Katz declared a special state of emergency in the country, Axios reports.
In addition, White House Secretary of State Marco Rubio issued a statement: ‘Tonight, Israel took unilateral action against Iran. We are not participating in strikes against Iran, and our top priority is to protect American troops in the region.’ ‘President Trump and the administration have taken all necessary measures to protect our troops and are in close contact with our regional partners.’ ‘Let me be clear: Iran should not target US interests or personnel,’ Rubio added.
However, the decline in the EUR/USD pair may be limited, as the US dollar (USD) may face difficulties after US President Donald Trump's new threat to extend steel tariffs from 23 June to imported ‘steel-derived products’ such as household appliances, e.g. dishwashers, washing machines, refrigerators, etc. The tariffs were initially introduced in March at 25% and then doubled to 50% for most countries. This is the second time that the scope of the duties has been expanded.
Trading recommendation: SELL 1.15300, SL 1.15500, TP 1.14400

EURUSD H4 I Bullish Bounce OffBased on the H4 chart analysis, we can see that the price is falling toward our buy entry at 1.14737, which is a pullback support that aligns with the 61.8% Fib retracement.
Our take profit will be at 1.1570, which is a pullback resistance level.
The stop loss will be placed at 1.1400, an overlap support.
High Risk Investment Warning
Trading Forex/CFDs on margin carries a high level of risk and may not be suitable for all investors. Leverage can work against you.
Stratos Markets Limited (tradu.com ):
CFDs are complex instruments and come with a high risk of losing money rapidly due to leverage. 63% of retail investor accounts lose money when trading CFDs with this provider. You should consider whether you understand how CFDs work and whether you can afford to take the high risk of losing your money.
Stratos Europe Ltd (tradu.com ):
CFDs are complex instruments and come with a high risk of losing money rapidly due to leverage. 63% of retail investor accounts lose money when trading CFDs with this provider. You should consider whether you understand how CFDs work and whether you can afford to take the high risk of losing your money.
Stratos Global LLC (tradu.com ):
Losses can exceed deposits.
Please be advised that the information presented on TradingView is provided to Tradu (‘Company’, ‘we’) by a third-party provider (‘TFA Global Pte Ltd’). Please be reminded that you are solely responsible for the trading decisions on your account. There is a very high degree of risk involved in trading. Any information and/or content is intended entirely for research, educational and informational purposes only and does not constitute investment or consultation advice or investment strategy. The information is not tailored to the investment needs of any specific person and therefore does not involve a consideration of any of the investment objectives, financial situation or needs of any viewer that may receive it. Kindly also note that past performance is not a reliable indicator of future results. Actual results may differ materially from those anticipated in forward-looking or past performance statements. We assume no liability as to the accuracy or completeness of any of the information and/or content provided herein and the Company cannot be held responsible for any omission, mistake nor for any loss or damage including without limitation to any loss of profit which may arise from reliance on any information supplied by TFA Global Pte Ltd.
The speaker(s) is neither an employee, agent nor representative of Tradu and is therefore acting independently. The opinions given are their own, constitute general market commentary, and do not constitute the opinion or advice of Tradu or any form of personal or investment advice. Tradu neither endorses nor guarantees offerings of third-party speakers, nor is Tradu responsible for the content, veracity or opinions of third-party speakers, presenters or participants.

EU Daily Chart AnalysisEU Daily Chart Analysis
In D1 Chart, clearly the break out candle is huge and waiting to retest the area to Buy opportunity again

EURUSD, GBPUSD & EURGBP analysisHere's my outlook on the 3 pairs mentioned in the title. Looking for more upside momentum after we have some sort of pullback into the premium discount prices.
Once we get some15min bearish internal orderflow on the lower Time Frames I will look to enter short term sell positions before looking to take longer term buys on the way back up.
Again, if I can be of any assistance please do let me know and I will be happy to help where I can.

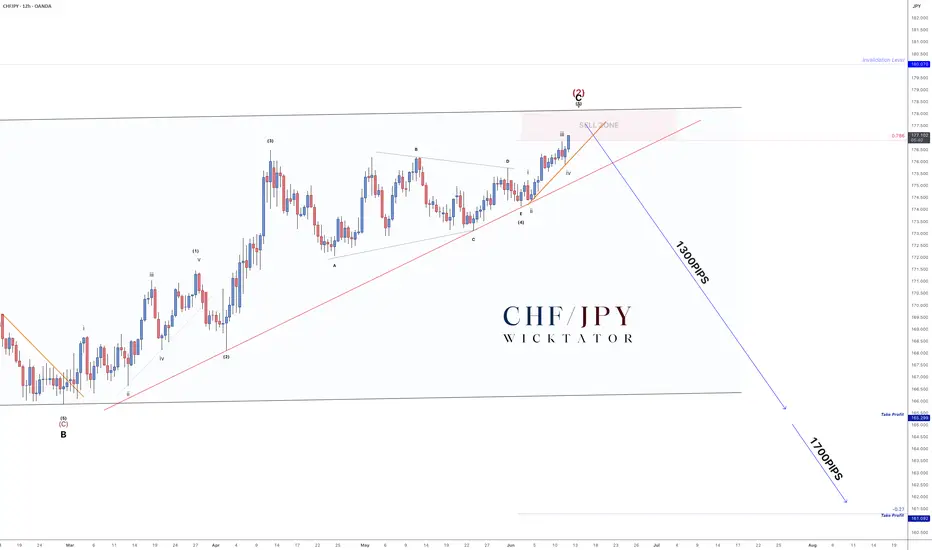
CHFJPY - How To Enter This MASSIVE 1700pip Swing Trade!As promised - here’s the lower timeframe breakdown after hitting 100+ likes.
We’re in wave 5, currently moving cleanly into the swing zone. Since wave 5 typically forms 5 subwaves, all we needed was to connect points 2 and 4 to draw our entry trendline.
Trade Idea:
- Entry on break of the orange trendline
- Stops above recent highs after entry
- Aggressive option: Enter inside the sell zone with stops above invalidation
Targets:
- TP1: 165.00 (≈1300 pips)
- TP2: 161.50 (≈1700 pips)
- Optional: Leave a runner for the longer swing move
Scroll down for the full 4H breakdown.
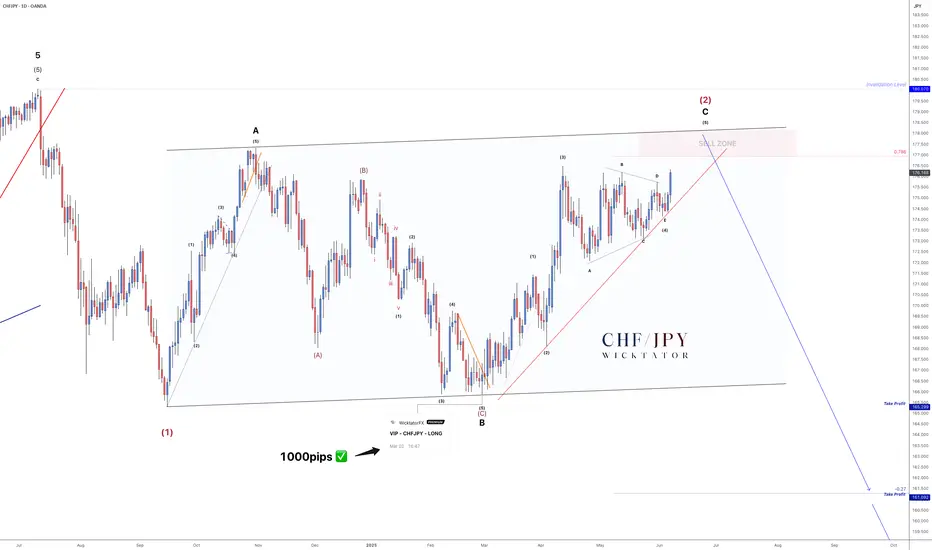
CHFJPY - 1700 Pip Reversal Incoming!The last time we looked at CHFJPY was back in October 2024, where we forecasted a large ABC correction. Fast forward to now - that correction is nearly complete!
We're currently in the 5th subwave of wave C, and everything points toward a massive drop setting up. We expect a move of at least 1500 pips.
On the Daily timeframe, structure is clear:
- Clean 5-3-5 ABC correction
- Price is approaching a key sell zone
- A clear entry trendline is in place — couldn’t ask for a cleaner setup
Trade Idea:
- Watch for rejection within the sell zone
- Aggressive entry: Inside sell zone with stops above invalidation
- Conservative entry: On break of trendline, stops above the break candle
Targets:
TP1: 165.00 (≈1300 pips)
TP2: 161.50 (≈1700 pips)
Optional: Leave a runner for a long-term swing
Let me know what you think in the comments.
See below for our last VIP setup for CHFJPY which played out perfectly. 1000pips secured!
Good luck and as always, trade safe!
Opportunity to buy EURUSDI see an opportunity to buy the EUR/USD pair from the support shown in the image and the target will be 1.16316

EUR/USD AccumulationOn the 5-minute timeframe, buying activity initiates, signaling the potential end of the downtrend. The first indication of upward momentum appears following the formation of a range and a subsequent liquidity sweep. Price then retests the prior low with diminished volume but fails to break below it, suggesting that selling pressure is being absorbed by buyers. This behavior reflects accumulation by informed participants positioning for a move higher. As demand begins to outweigh supply, clear signs of strength emerge
Entry: 1.15765
Take Profit: 1.16279
Stop Loss: 1.15621

EUR/USD remains bullish
💡Message Strategy
The EUR/USD exchange rate continued to rise in the European session, gradually approaching the previous high of around 1.1600. The US dollar continued to be under pressure due to the market's rising expectations for the Federal Reserve to cut interest rates this year and the increasing uncertainty surrounding the US foreign trade policy.
US President Trump recently said that he would send letters to trading partners in the next one to two weeks to notify them of unilateral new tariff measures, which once again plunged the market into a state of worry. In addition, the US CPI annual rate in May was 2.4%, lower than the expected 2.5%, which strengthened the bet that the Federal Reserve will restart the interest rate cut cycle in September.
At the same time, the relatively hawkish signal of "interest rates close to neutral levels" released by ECB President Lagarde, coupled with the market's rethinking of the role of the euro in the context of "de-dollarization", jointly supported the upward structure of the exchange rate. Currently, traders are paying close attention to the US PPI data and initial jobless claims to be released in the evening, which may have a traction on the short-term trend of the US dollar.
📊Technical aspects
Judging from the chart, the current price of EUR/USD is near the upper track of the Bollinger Band (1.1548), and the Bollinger Band is in an expanding state. The width of the Bollinger Band has widened, reflecting the increase in volatility, suggesting that there may be a possibility of a large-volume breakthrough in the future.
In terms of MACD indicator, the DIFF line continues to rise and forms a golden cross with the DEA line. Although the momentum of the bar chart is not strong, it has not turned negative, indicating that the bullish momentum is moderate; RSI is running around 64, close to the overbought area but no divergence is formed. The market momentum is bullish and the technical side is slightly bullish.
Short-term support is at 1.1500 and 1.1440; if it effectively breaks through 1.1600, the upside space may reach 1.17.
💰 Strategy Package
Long Position: 1.1450-1.1550

USD Weakness Persists: Can EUR/USD Target 1.18?
The EUR/USD exchange rate has continued to strengthen, breaking through the psychological barrier of 1.1600 during the intraday session, marking the first time it has reached this level since November 2021. The pair surged to an intraday high of 1.1630, driven by the confluence of a persistently weakening US dollar and enhanced economic resilience in the Eurozone.
Technically, the EUR/USD currently exhibits a robust bullish pattern. If it can sustain above the 1.1600 threshold, it is poised to test the 1.1800 resistance zone. Conversely, a false breakout followed by a retracement below 1.1500 would warrant caution, as it may signal a attenuation of bullish momentum and potential reversal risks.
Humans need to breathe, and perfect trading is like breathing—maintaining flexibility without needing to trade every market swing. The secret to profitable trading lies in implementing simple rules: repeating simple tasks consistently and enforcing them strictly over the long term.

EURO - Price will exit from pennant and then make correctionHi guys, this is my overview for EURUSD, feel free to check it and write your feedback in comments👊
Some days ago price reached $1.0950 level and then made a correction movement, after which started to grow in a pennant.
Price made an upward impulse from support line of pennant and broke $1.0950 level, after which made a retest.
Then price continued to move up and reached $1.1300 level, and soon broke it too, and then made a correction movement.
After this, price rose to resistance line of pennant and then started to decline and soon broke $1.1300 level again.
But later it boucned from support line and backed up, and even now it trades very close to resistance line.
In my mind, Euro can rise a little, thereby exiting from pennant and then make a correction to $1.1300 level.
If this post is useful to you, you can support me with like/boost and advice in comments❤️
Disclaimer: As part of ThinkMarkets’ Influencer Program, I am sponsored to share and publish their charts in my analysis.

The surge in the euro was expected
💡Message Strategy
Since the beginning of this trading week, a number of economic data released by the United States have been weak. Following the decline in the manufacturing PMI, the ISM service PMI for May released on Wednesday fell to 49.9, the first contraction in nearly a year. In addition, the ADP employment data was also far below expectations, with only 37,000 new jobs, far below the expected 115,000, which strengthened the market's concerns about the risk of a US recession, thereby dragging down the US dollar.
At the same time, risk aversion and uncertainty in the United States have not improved significantly, and trade tensions, debt prospects and weak US bond yields have put pressure on the US dollar. Obviously, in the game between eurozone monetary policy and US economic data, the euro wins.
📊Technical aspects
From the daily chart, the exchange rate has maintained a strong oscillation pattern since mid-April, and has generally been running between the middle and upper tracks of the Bollinger Bands. The upper track of the Bollinger Bands is currently at 1.1471, and the lower track is at 1.1118. The Bollinger Bands are slightly open, indicating a rebound in volatility.
The MACD indicator shows that the double lines form a golden cross, and the bar chart turns from green to red, suggesting that the downward momentum is weakening; the RSI indicator remains near 57, slightly in the neutral to bullish area, and has not yet reached the overbought level. The overall technical pattern tends to fluctuate upward. If it breaks through the 1.1500 area, it will continue to rise.
At present, the main idea is still to do more on the callback, and do not blindly chase the short.
Long Position: 1.14450-1.14650

EUR/USD: Euro Pops Above $1.16 in Four-Year High. What’s Next?The dollar wobbles, Trump talks tariffs, and the euro’s got its dancing shoes on.
The Euro Wakes Up, Stretching Its Legs at $1.16
Look who just rolled out of bed and decided to make a scene.
For the first time in four years, the euro has finally leapt out of its slumber and sprinted to $1.16 — all at the expense of the US dollar, which continues to shed value.
The FX:EURUSD isn’t just crawling higher. It’s flexing, fueled by dollar fatigue, political drama, and some very European stubbornness.
So what’s behind the move? Why is the euro soaring while the European Central Bank is actually cutting rates? And what’s the dollar doing? Let's unpack it all — one central bank, one tweet, and one inflation print at a time.
Trump’s Tariff Ping-Pong: Back On, Back Off
Let’s start with the one thing that never quite leaves the headlines: Trump’s trade policy.
Just when traders were catching their breath after some tariff reprieve on China, the market got pulled back into the mess. “WE ARE GETTING A TOTAL OF 55% TARIFFS, CHINA IS GETTING 10%. RELATIONSHIP IS EXCELLENT,” Trump posted on Truth Social late on Wednesday, reigniting fears that the trade war is getting heated up again. Especially after a US squad of negotiators touched down in London and walked away with some promising news .
Markets don’t love confusion. Investors especially don’t love a US trade policy that changes faster than the Nasdaq NASDAQ:IXIC during CPI week. This kind of noise erodes confidence in US economic leadership and — more importantly — in the dollar.
The world’s most important currency is starting to feel… less important, less relevant, and less reliable. And while it’s not collapsing, it’s definitely catching fewer friends at the FX party.
On the other side of the pond, the euro isn’t rising because Europe is crushing it (even though it’s doing pretty well against rival currencies, just check the forex heatmap ) — it’s rising because the dollar is slipping off its pedestal. So yes, the euro’s up. But this isn’t a standing ovation for Europe — it’s more of a polite shrug away from America.
US Inflation Creeps Higher — And That Means a Cut?
US inflation picked up to 2.4% in May but still left the door open for a cut by the Federal Reserve.
So what does the market do? It prices in a cut.
Lower rates mean lower yields on Treasuries, which means less incentive for global investors to hold dollars. And when the yield game turns dull, guess what gets more attention? Gold OANDA:XAUUSD — because if your asset doesn’t yield anything, at least let it be shiny.
ECB Cuts Again, and the Euro Still Rises?
Now here’s the riddle. The ECB last week cut its benchmark rate to 2% , hitting a two-year low. By all textbook logic, a rate cut should weaken the local currency.
Here’s why it’s rising instead:
Markets are forward-looking . The rate cut was expected and already priced in. What matters now is whether more cuts are coming (spoiler: not too many). Traders are betting the ECB is nearing the end of its easing cycle — and may turn neutral soon.
The Fed looks more dovish . Rate differentials still matter. Even if the ECB is cutting, the Fed is expected to cut more over the next 12 months. That narrows the gap between euro and dollar yields, making the euro more attractive in relative terms.
Eurozone data isn’t great — but it’s not falling apart either. While growth in the eurozone isn’t setting any records, it’s been just OK to support the currency. Inflation is cooling in line with ECB targets, unemployment remains low, and key sectors like manufacturing are showing signs of life.
Put it all together and you get a euro that’s rising despite rate cuts — a phenomenon that would make FX professors tear their hair out, but makes perfect sense when you zoom out.
Technicals: This Isn’t a Flash in the Pan
From a chartist’s perspective, the FX:EURUSD breakout above $1.16 was a big deal. That level had acted as resistance since November 2021. Now cleared, a flurry of algo buys and retail FOMO might fuel the next leg in either direction.
From the bulls’ perspective, momentum is picking up, and the euro looks poised to test $1.17–$1.18 if the dollar stays fragile (that said, keep your eye on any hot news coming out of the economic calendar ). RSI is not yet flashing overbought, and MACD is still screaming “more grounds to cover.”
Question is: How long can the euro dance before the music changes? And we’re asking you — share your thoughts on the euro-dollar pair and let’s see who gets it right!

EURUSD Outlook – Long, Medium & Short-Term Analysis🔹 Weekly Chart:
The broader structure remains technically bearish. We've recently seen a trend reset, which could mark the beginning of a fresh downside leg.
🔹 Daily Chart:
A clear bearish trend reversal pattern has formed, accompanied by a manipulation phase. A confirmed break structure is now in place. As long as price remains below 1.15734, short positions remain valid.
🔹 4H Chart:
Currently in a range-bound phase. A confirmed break below 1.1371 will be a key bearish trigger for potential selling opportunities.
🔹 1H Chart:
Still ranging, but a valid Lower Low (LL) has already printed. A second LL below 1.1371 would confirm a short-term bearish continuation.
On the flip side, a break above 1.1495 would open the door for a bullish move in the short term.
📌 Key Levels to Watch:
Bullish above: 1.1495
Bearish below: 1.1371
Critical invalidation: 1.15734
Trade safe and stay disciplined.

EURUSD LongHere is our EUR USD Signal that we posted
As you can see it's running nicely at 258 Pips.
EURUSD Buy
📊Entry: 1.13538
⚠️SL: 1.12594
✔️TP1: 1.14732
✔️TP2: 1.16256
✔️TP3: 1.18194
We have 5 big swing trades running at present, all of which comes from our trading strategy that is solely based on pure maths. So far in 2025 we have hit 1 stop loss from over 100 trades.
My point to this post is to encourage you all to keep trying, don't give up. It took us over 2 years to perfect this strategy, and we know it works.
If you want any help just ask me, and I will help you.


EUR/USD: Weekly PAT + VPA 5/11/2025Trading Analysis EUR/USD - Price Action and Volume Price Analysis
Weekly Structure Analysis: At present, we find ourselves within a bullish weekly range. The lower boundary of this range is 1.07330, established during the week of March 24, 2025, while the upper boundary is at 1.15734, reached the week of April 21, 2025. The price movement from 1.073 to 1.157 has surpassed a swing high, which we will identify as our initial resistance point as we aim to return to 1.15734.
Weekly Price Action Analysis: Analyzing structure and price action reveals similarities. Our confidence in a bullish trend is the anchored weekly bar. The weekly candle from the week of April 7, 2025 serves as this anchor. Following the inside bar, we observed a bearish pin bar, which acts as a Bullish Reacher since its wick exceeded the high of the anchor bar's wick (Wick on Wick). The market shows signs of wanting to rise, but it must first hit a demand zone that weekly traders are keen to engage with.
Volume Price Analysis: The last four weekly candles have demonstrated limited strength in driving the market lower, with support holding at 1.11927 (1.12). As the price declines, trading volume is decreasing, following a sharp upward movement, likely due to profit-taking or repositioning. Volume analysis indicated we should retest 1.15734.
Good luck and happy trading!
OANDA:EURUSD TVC:DXY

EURUSD BULLISH OR BARISH DETAILED ANALYSISEURUSD is showing strong bullish momentum after a clean bounce from the key support zone around 1.12. Price structure confirms higher lows and strong bullish candle formations on the daily chart, suggesting the bulls are in control. This recent move is backed by a textbook retest and rejection from the previous resistance-turned-support zone, giving confidence in a potential continuation toward the 1.19 level. With the current price trading near 1.15 and pushing higher, the market is positioned for a strong bullish wave in the coming sessions.
From a fundamental perspective, the Euro has gained fresh support after the ECB’s decision last week to proceed with a measured and data-dependent rate cut cycle. While the ECB delivered its first cut, the tone was cautious and far less dovish than anticipated, which kept EUR strength intact. On the USD side, traders are pricing in a more dovish outlook for the Federal Reserve, especially with recent CPI and PPI data pointing toward cooling inflation. This divergence in policy outlook continues to favor EURUSD upside in the medium term.
Technical indicators are also confirming the bullish bias. The pair is riding an ascending trendline, and momentum indicators like RSI remain in bullish territory without yet being overbought. A daily close above the 1.1550 area strengthens the case for a continuation move. The price is aiming for the next major resistance around 1.1770–1.19, where bulls are likely to take profit or scale out. Until then, dips are likely to be bought aggressively, as long as the 1.12 support remains intact.
This setup presents a high-probability opportunity in a trending market backed by both fundamentals and technical confluence. As long as the bullish structure holds, I remain long-biased on EURUSD with eyes on the 1.19 zone as the next key level. With increasing market interest, low volatility on the downside, and strong trend-following signals, this pair is set for a continued rally.

DeGRAM | EURUSD held the support📊 Technical Analysis
● Euro holds above 1.137 – 1.140, where the channel’s mid-line meets the old wedge roof, printing a fresh higher-low (green arrow).
● Price is compressing inside a pennant capped at 1.142; flag height projects to 1.156 – 1.160 at the rising-channel median once 1.142 gives way.
💡 Fundamental Analysis
● After the ECB’s “one-and-pause” cut, sticky EZ core CPI (2.9 % y/y) and softer US payrolls narrowed the 2-yr rate gap, keeping flows tilted toward the euro.
✨ Summary
Buy 1.137–1.141; pennant breakout >1.142 targets 1.156 → 1.160. Long bias void on an H4 close below 1.126.
-------------------
Share your opinion in the comments and support the idea with like. Thanks for your support!
