Eurusd-3
EURUSD SHORT FORECAST Q2 W24 D12 Y25EURUSD SHORT FORECAST Q2 W24 D12 Y25
Professional Risk Managers👋
Welcome back to another FRGNT chart update📈
Diving into some Forex setups using predominantly higher time frame order blocks alongside confirmation breaks of structure.
Let’s see what price action is telling us today!
💡Here are some trade confluences📝
✅Weekly order block
✅15' order block
✅4 hour order block
✅Tokyo ranges to be filled
🔑 Remember, to participate in trading comes always with a degree of risk, therefore as professional risk managers it remains vital that we stick to our risk management plan as well as our trading strategies.
📈The rest, we leave to the balance of probabilities.
💡Fail to plan. Plan to fail.
🏆It has always been that simple.
❤️Good luck with your trading journey, I shall see you at the very top.
🎯Trade consistent, FRGNT X

Cocoa Bounce From Demand – Can This Lead to a New 2025 High?On June 11th, price reacted sharply to a key demand block around the 8,880–9,000 zone, which aligns with:
Golden Pocket Fib (0.705–0.78) between 8,420 and 9,006
The midpoint of a previous consolidation range
A liquidity sweep followed by a strong bullish rejection
The RSI is showing a bullish divergence (lower lows on price vs rising RSI), which supports a possible technical rebound.
🟣 Immediate target: 10,400–10,600 (supply zone)
🔴 The bullish bias would be invalidated on a close below 8,850
📈 Commitments of Traders (COT) – as of June 3, 2025
Non-Commercials (speculators): still net long, but reduced their long exposure by -2,006 contracts, and trimmed shorts slightly as well
Commercials: remain heavily net short with over 61,000 contracts (61.4% of OI), indicating ongoing hedging by producers
Open Interest dropped by -1,257 → a sign of general position liquidation
➡️ The reduction in speculative longs likely reflects profit-taking after the May rally, but overall net positioning remains bullish on a medium-term view.
📅 Seasonality – June
On the 20, 15 and 10-year averages, June typically shows a moderately bullish rebound, often following weakness in May.
On the 5 and 2-year views, however, performance is more neutral to slightly negative.
Historically, June acts as a consolidation or pre-rally month, often preceding a stronger uptrend in July–August.
🧠 Operational Outlook
Bias: Moderately bullish in the short term, with potential recovery toward 10,400. Structure still shows signs of broader distribution, so caution remains in the medium term.
🎯 Trade idea:
Aggressive long initiated on the bounce from demand
First target: 10,400
Breakout extension: 11,200
Invalidation on daily close below 8,850

EUR/USD tests three-year ceiling Aside from a brief spike in April, EUR/USD has remained below 1.1500 for over three years.
Sellers again have had to defend the zone following the weaker-than-expected US CPI release. The main resistance zone potentially spans all the way up to 1.1573 (the April high).
Some indicators suggest potential room for further upside. The Relative Strength Index (RSI) has not yet reached overbought territory, and the Daily Moving Average is positively sloped. A break below the 4-hour Moving Average could trigger more selling pressure and a potential correction.

Eurusd Buyprice is bullish on the Daily and 4hr tf. on the 1hr it is exiting the Daily demand zone and recently bounced off the 1hr trendline. price is currently around 4hr poi which may help give us fuel to move to the 1hr poi and above targeting next Daily key level.

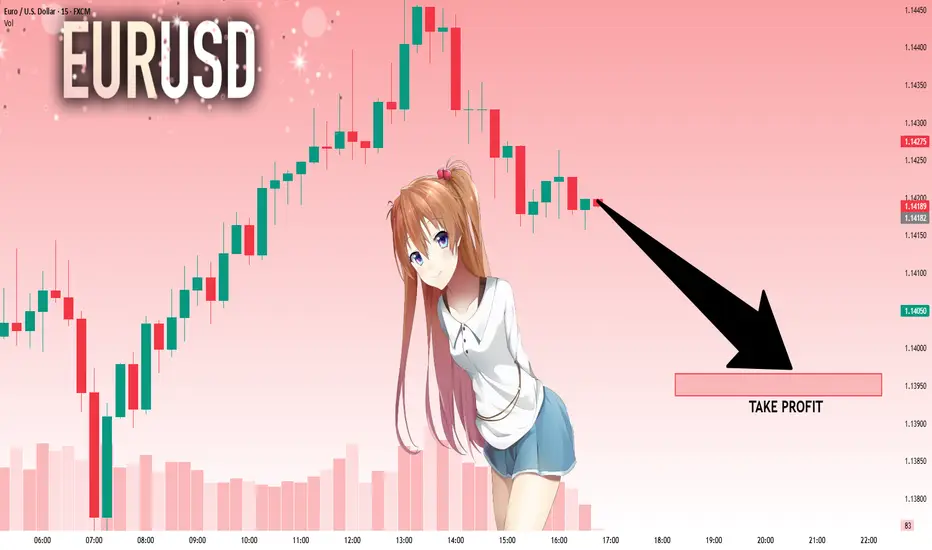
Bullish momentum to extend?EUR/USD has reacted off the resistance level which is a pullback resistance and could rise from this level to our take profit.
Entry: 1.1451
Why we like it:
There is a pullback support level.
Stop loss: 1.1386
Why we like it:
There is a pullback support level.
Take profit: 1.1558
Why we like it:
There is a pullback resistance level.
Enjoying your TradingView experience? Review us!
Please be advised that the information presented on TradingView is provided to Vantage (‘Vantage Global Limited’, ‘we’) by a third-party provider (‘Everest Fortune Group’). Please be reminded that you are solely responsible for the trading decisions on your account. There is a very high degree of risk involved in trading. Any information and/or content is intended entirely for research, educational and informational purposes only and does not constitute investment or consultation advice or investment strategy. The information is not tailored to the investment needs of any specific person and therefore does not involve a consideration of any of the investment objectives, financial situation or needs of any viewer that may receive it. Kindly also note that past performance is not a reliable indicator of future results. Actual results may differ materially from those anticipated in forward-looking or past performance statements. We assume no liability as to the accuracy or completeness of any of the information and/or content provided herein and the Company cannot be held responsible for any omission, mistake nor for any loss or damage including without limitation to any loss of profit which may arise from reliance on any information supplied by Everest Fortune Group.

EURUSD: Perfect spot to short.EURUSD is bullish on its 1D technical outlook (RSI = 62.082, MACD = 0.004, ADX = 31.112) as it is trading inside a Channel Up since the May 12th low. The 4H RSI sequence suggests that based on the Channel's first bullish wave, the market is now on the 4th count, which was previously the top (as close to the 1.786 Fibonacci extension as possible). We turn bearish here, targeting the 0.786 Fib level at the bottom of the Channel Up (TP = 1.13550).
See how our prior idea has worked out:
## If you like our free content follow our profile to get more daily ideas. ##
## Comments and likes are greatly appreciated. ##

EURUSD - Mark up for the rest of the weekAfter the CPI data was released today we had a lovely upside move. The move has caused us to trade into the previous weak higher timeframe high which I am hoping we can break and close above before the day is out.
I am now focusing on what kind of pullback we may get into out POI's. Because there is no buy side liquidity on the first POI I will need to see a structural shift on the 15min TF to confirm that internal structure swing to move back towards the upside.
If the 1st POI fails to hold I will be more aggressive with my secondary POI as that will be the premium discount price in order for us to move higher.
If that POI fails and we break the 4H structure swing then this could signal we are about to move lower.
If I can be of any assistance to anyone don't be shy to give me a message

EURUSD: Will Go Up! Long!
My dear friends,
Today we will analyse EURUSD together☺️
The in-trend continuation seems likely as the current long-term trend appears to be strong, and price is holding above a key level of 1.14821 So a bullish continuation seems plausible, targeting the next high. We should enter on confirmation, and place a stop-loss beyond the recent swing level.
❤️Sending you lots of Love and Hugs❤️

EUR/USD Weekly Outlook | Harmonic Butterfly PatternHere is a professional TradingView publish description for your EUR/USD Weekly Butterfly Pattern Analysis:
---
🦋 EUR/USD Weekly Outlook | Harmonic Butterfly Pattern
Pair: EUR/USD
Timeframe: 1W (Weekly)
Strategy: Harmonic Pattern Recognition – Butterfly Pattern
Bias: Bearish Reversal Setup
---
🔍 Pattern Analysis:
Butterfly Harmonic Pattern completed with precision at the 1.272–1.414 extension zone, forming the critical D-point near 1.14700.
Price has reacted sharply from the PRZ (Potential Reversal Zone), aligning with a historical supply zone.
Confluence from Fibonacci extensions:
AB = 0.786 retracement
BC = 0.382 to 0.886 retracement
CD = 1.618 to 2.618 extension
📉 Bearish rejection expected from this high-probability reversal zone.
---
📌 Key Levels:
PRZ (Potential Reversal Zone): 1.14500 – 1.15000
First Target Zone (Support Block): 1.11500 – 1.10500
Invalidation (Pattern Failure): Close above 1.15500
---
📅 Projection: This weekly harmonic butterfly suggests a potential trend reversal or deep pullback. We may see EUR/USD targeting lower support as D-point gets respected. Watch for signs of weakness such as long-wick rejections, bearish engulfing patterns, or RSI divergence confirmation.
---
💡 Conclusion: EUR/USD is at a critical juncture. If the butterfly holds, this could be a high RR short opportunity for swing traders. Patience is key—confirmation on lower timeframes will validate entry.
---
📊 #EURUSD #ButterflyPattern #HarmonicTrading #ForexAnalysis #TechnicalAnalysis #SwingTradeSetup

DXY Monthly Analysis | Smart Money Concept + CHoCH BreakdownPair: US Dollar Index (DXY)
Timeframe: 1M (Monthly)
Strategy: Smart Money Concept (SMC) + Market Structure + Demand/Supply Zones
Bias: Bearish (Mid to Long-Term)
Breakdown:
Price reacted strongly from the monthly supply zone (110–104), showing signs of exhaustion.
Clear CHoCH (Change of Character) visible at the top structure, confirming loss of bullish intent.
Internal structure printed a liquidity sweep + FVG (Fair Value Gap) ➝ BOS ➝ lower low.
Current PA (price action) is targeting the first demand zone near 92–94, but major interest lies at the macro demand zone (85.100–84.900).
This level aligns with unmitigated historical demand and potential long-term accumulation range.
---
📅 Projection:
Expecting a continuation to the downside after retesting minor imbalance zones.
Potential multi-year bearish leg forming Wave 3 (macro view).
Ideal accumulation/buy zone: 85.100–84.900 – if structure supports.
---
📌 Key Levels to Watch:
Supply Zone: 110.800 – 104.600
CHoCH Level: ~102.300
Short-Term Demand: 92.000 – 94.000
Long-Term Demand (Institutional Interest): 85.100 – 84.900
---
💡 Conclusion: Smart Money has exited from premium pricing, and the macro structure aligns with a bearish transition. As long as price respects current lower highs, we may see a deeper correction or possible trend reversal near 85 levels.
---
🧠 #DXY #SmartMoney #CHoCH #ForexAnalysis #SupplyAndDemand #PriceAction #Forex #Month

Euro may reach seller zone and then continue to declineHello traders, I want share with you my opinion about Euro. In this chart, the price started to grow, bouncing from the support line, and soon reached the support level, which coincided with the buyer zone. Then it declined to support line, making the correction and then made an impulse up from this line to the resistance level, breaking the 1.1070 level. After this movement, the Euro made a correction and then continued to grow and broke the resistance level, which coincided with the seller zone, and even rose higher than the seller zone. But soon Euro turned around and started to decline and broke the 1.1455 level again, after which it declined to the support line inside the range. Price little grew near this line, but later broke the support line and continued to decline. It fell to the support level, which is the bottom part of the range, and then started to grow. Euro later reached the top part of the range, which is the resistance level, and not long time ago turned around and started to decline. So, after looking for this chart, I think that the Euro may enter to seller zone and then continue to decline inside the range. For this case, I set my TP at 1.1250 points. Please share this idea with your friends and click Boost 🚀
Disclaimer: As part of ThinkMarkets’ Influencer Program, I am sponsored to share and publish their charts in my analysis.

EURUSD: Bears Will Push
The recent price action on the EURUSD pair was keeping me on the fence, however, my bias is slowly but surely changing into the bearish one and I think we will see the price go down.
Disclosure: I am part of Trade Nation's Influencer program and receive a monthly fee for using their TradingView charts in my analysis.
❤️ Please, support our work with like & comment! ❤️

EURUSD | Bearish Bias Below 1.1450, Eyes on 1.1372EURUSD | OVERVIEW
The pair maintains a bearish momentum as long as it trades below the pivot level at 1.1450, targeting the support at 1.1372. A clear break below this level would reinforce the downtrend, potentially extending the decline toward 1.1270.
Alternative Scenario:
A confirmed 1-hour candle close above 1.1450 would indicate a potential shift to a bullish trend, with upside targets at 1.1535, and possibly 1.1625.
Support Levels: 1.1372, 1.1270
Resistance Levels: 1.1535, 1.1625

Eurusd D Updatei buy eurusd 3 time{yellow line]
now we hit first take profit so we put stop loss on entry price and we keep eurusd for next take profit

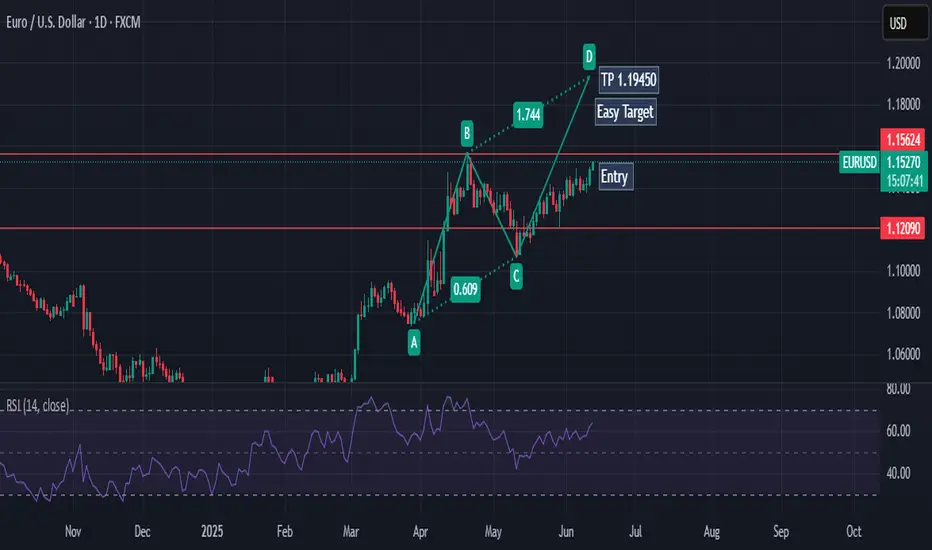
EURUSD shortThe Setup:
1. A-B: Strong impulsive drop on increasing volume → clear evidence of real selling pressure.
2. B-C: Pullback forms on decreasing volume → classic corrective behavior, not buyer aggression.
3. C-D: Entry just below point C as new volume confirms sellers stepping back in.
4. Targeting >3R with stop tucked above C — logical structure, clean invalidation.
✅ Volume confirms the trend
✅ Structure is tight, no randomness
✅ Timing aligns with volatility spike (news at the bottom?)
✅ Clear bearish continuation pattern
what do you think of this a head of cpi?

EURUSD SHORT FORECAST Q2 W24 D11 Y25EURUSD SHORT FORECAST Q2 W24 D11 Y25
Professional Risk Managers👋
Welcome back to another FRGNT chart update📈
Diving into some Forex setups using predominantly higher time frame order blocks alongside confirmation breaks of structure.
Let’s see what price action is telling us today!
💡Here are some trade confluences📝
✅Weekly order block
✅15' order block
✅4 hour order block
✅Tokyo ranges to be filled
🔑 Remember, to participate in trading comes always with a degree of risk, therefore as professional risk managers it remains vital that we stick to our risk management plan as well as our trading strategies.
📈The rest, we leave to the balance of probabilities.
💡Fail to plan. Plan to fail.
🏆It has always been that simple.
❤️Good luck with your trading journey, I shall see you at the very top.
🎯Trade consistent, FRGNT X

Bearish drop?Fiber (EUR/USD) has reacted off the pivot which is a pullback resistance and could drop to the 1st support which is an overlap support.
Pivot: 1.1449
1st Support: 1.1371
1st Resistance: 1.1496
Risk Warning:
Trading Forex and CFDs carries a high level of risk to your capital and you should only trade with money you can afford to lose. Trading Forex and CFDs may not be suitable for all investors, so please ensure that you fully understand the risks involved and seek independent advice if necessary.
Disclaimer:
The above opinions given constitute general market commentary, and do not constitute the opinion or advice of IC Markets or any form of personal or investment advice.
Any opinions, news, research, analyses, prices, other information, or links to third-party sites contained on this website are provided on an "as-is" basis, are intended only to be informative, is not an advice nor a recommendation, nor research, or a record of our trading prices, or an offer of, or solicitation for a transaction in any financial instrument and thus should not be treated as such. The information provided does not involve any specific investment objectives, financial situation and needs of any specific person who may receive it. Please be aware, that past performance is not a reliable indicator of future performance and/or results. Past Performance or Forward-looking scenarios based upon the reasonable beliefs of the third-party provider are not a guarantee of future performance. Actual results may differ materially from those anticipated in forward-looking or past performance statements. IC Markets makes no representation or warranty and assumes no liability as to the accuracy or completeness of the information provided, nor any loss arising from any investment based on a recommendation, forecast or any information supplied by any third-party.

$EU (EURUSD) 1H AnalysisBias: Bearish after liquidity grab at 1.14392
Setup: Wait for the sweep ➤ BOS ➤ Enter short
Target: 1.13600
Price is forming a range-bound consolidation, but the internal structure shows liquidity building below and above.
The market seems poised to run the 1.14392 high, grabbing buy stops above the short-term high.
After that sweep,i see a rejection and shift in order flow, setting up a bearish leg.
Key POIs :
Sweep Zone: 1.14392 (Buy-side liquidity)
Sell Target: 1.13600 zone – a clear sell-side liquidity draw
The red line marks an untapped liquidity pool, aligning with a previous support level.
Trade Idea (Short Bias) :
Let price sweep the 1.14392 high, form a bearish shift (change of character).
Ideal entry after confirmation of rejection.
Target: 1.13600
Invalidation: Clean break and close above 1.14500

EURUSD Volatility EURUSD: April saw notably elevated volatility. MUFG Research reports the euro surged from 1.0811 to 1.1325 in April, a sharp 2.9% monthly gain, the most significant since early-COVID volatility.
NewbridgeFX describes April as “a month marked by heightened global market uncertainty”, with EUR/USD experiencing considerable swings amid trade tensions, inflation data, and central-bank decisions.
DailyForex highlighted volatility spikes in early April, with sharp moves around tariff announcements and inflation reports
Was April the Most Volatile Month of 2025?
April ranks among the most volatile, if not the top, due to:
Trump's April 2 “Liberation Day” tariffs, triggering global market turbulence.
ECB rate cut and euro strength, adding fuel to price swings
May also remained volatile, but analysis like MUFG and DailyForex suggests volatility slightly subsided compared to April.
📊 Conclusion
April 2025 likely stands as the most volatile month for EUR/USD this year, primarily driven by trade-policy shocks and central bank actions. It appears to edge out volatility in May, making it the standout month.
Market research conducted by Ilyas Khan with assistance from #ChatGPT by #OpenAI.
#eurusd #forex #eur #usd #economics #science #math #mathematics #economy #usa #unitedstatesofamerica #europe #bloomberg #ctv #cnbc #marketnews #market #marketresearch

Eurusd !!! Ascending Wedge Pattern Signals a Major Reversal! Time': 30 min
Technical analysis:
Ascending Wedge Pattern 📈: A clear ascending wedge signals a potential bearish reversal. The price has just completed Wave ⑤ at the top trendline, a classic trigger point for sellers.
* Elliott Wave Confirmation 🖐️: The wedge contains a perfect 5-wave Elliott structure, reinforcing our bearish bias as the final impulse wave concludes.
* Live vs. Textbook 👨🏫: Our live chart is mirroring the ideal "textbook" example shown, increasing confidence in the setup's validity.
The Trade Plan 🎯
* Entry ▶️: Short position initiated in the "Risk Zone" after rejection from the wedge resistance.
* Stop Loss ⛔️: Placed tightly above the Wave ⑤ high at ~1.14821.
* Take Profit 💰: Targeting the major support level at ~1.12925.
Conclusion ✨
This setup presents an exceptional risk-to-reward ratio. The combination of a reliable chart pattern and Elliott Wave count gives us a high-conviction bearish outlook for EUR/USD.
Disclaimer ⚠️: This is a technical idea, not financial advice. Always use proper risk management. Trade safe!

Bearish drop off major resistance?EUR/USD has reacted off the resistance level which is a pullback resistance and could drop from this level to our take profit.
Entry: 1.1433
Why we like it:
There is a pullback resistance level.
Stop loss: 1.1481
Why we like it:
There is a pullback resistance level.
Take profit: 1.1361
Why we like it:
There is a pullback support level.
Enjoying your TradingView experience? Review us!
Please be advised that the information presented on TradingView is provided to Vantage (‘Vantage Global Limited’, ‘we’) by a third-party provider (‘Everest Fortune Group’). Please be reminded that you are solely responsible for the trading decisions on your account. There is a very high degree of risk involved in trading. Any information and/or content is intended entirely for research, educational and informational purposes only and does not constitute investment or consultation advice or investment strategy. The information is not tailored to the investment needs of any specific person and therefore does not involve a consideration of any of the investment objectives, financial situation or needs of any viewer that may receive it. Kindly also note that past performance is not a reliable indicator of future results. Actual results may differ materially from those anticipated in forward-looking or past performance statements. We assume no liability as to the accuracy or completeness of any of the information and/or content provided herein and the Company cannot be held responsible for any omission, mistake nor for any loss or damage including without limitation to any loss of profit which may arise from reliance on any information supplied by Everest Fortune Group.

EURUSD: Bears Are Winning! Short!
My dear friends,
Today we will analyse EURUSD together☺️
The recent price action suggests a shift in mid-term momentum. A break below the current local range around 1.14198 will confirm the new direction downwards with the target being the next key level of 1.13966.and a reconvened placement of a stop-loss beyond the range.
❤️Sending you lots of Love and Hugs❤️