BTC - Last Push: Consolidation, Manipulation & DistributionMarket Context
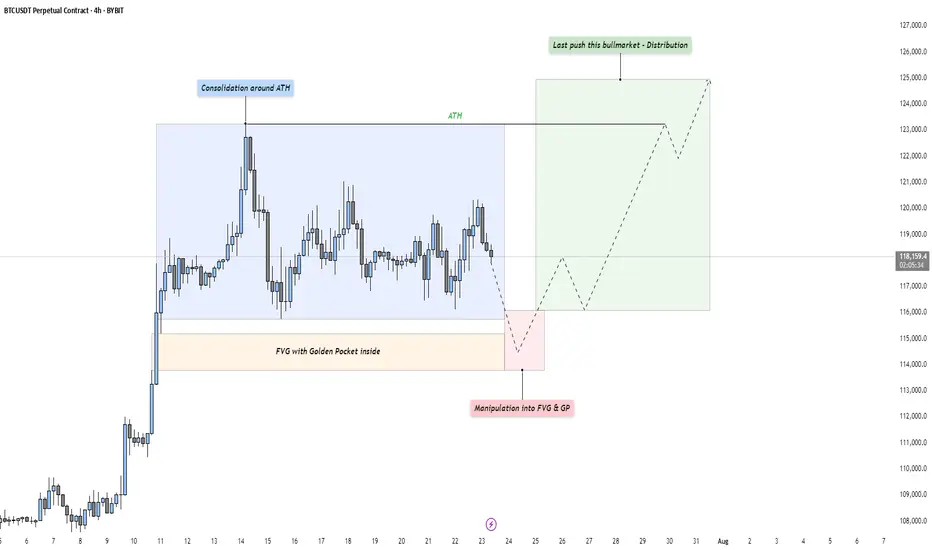
After a strong upward impulse, Bitcoin has entered a mid-term consolidation phase just below its all-time high. This kind of price action is typical as the market digests recent gains and larger participants prepare for the next move. These pauses in momentum often precede either trend continuation or a reversal — and the structure here suggests we might be witnessing the former, but not without a final shakeout.
Phase 1: Consolidation Around the All-Time High
The first phase is defined by a tight range just beneath the all-time high, where price moves sideways in a balanced struggle between buyers and sellers. This is often where retail participants become overly bullish, anticipating a breakout. However, the lack of a sustained move higher indicates that smart money may be waiting for better entries — or preparing to engineer liquidity to fuel the next move.
Phase 2: Manipulation Into the Fair Value Gap and Golden Pocket
Directly below the range lies a clean Fair Value Gap, with a Golden Pocket retracement nestled inside it. This zone represents a strong area of interest. A sharp move into this area would likely sweep late long positions and trigger stop-losses from range traders — a classic manipulation pattern. This phase serves two purposes: collect liquidity and offer favorable pricing for larger players looking to position themselves before expansion. Watch for signs of absorption or reversal as price enters this zone.
Phase 3: Expansion – The Last Push of the Bull Market?
Following the liquidity sweep and reaction from the Fair Value Gap and Golden Pocket zone, we could see a renewed expansion toward higher highs. This is the phase where volume returns, sentiment shifts, and price accelerates. If this plays out, it could mark the final leg of this bull cycle — potentially driving Bitcoin to new all-time highs with strength.
Execution Thoughts
If you're looking to participate, it's wise to wait for a confirmation signal on a lower timeframe — like the 5-minute or 15-minute chart — once price enters the Fair Value Gap and Golden Pocket zone. Watch for a strong bullish reaction, break of structure, or shift in order flow to signal that buyers are stepping back in.
Final Thoughts
Let the market come to your level and don’t chase moves without context. These three phases — consolidation, manipulation, and expansion — are timeless patterns seen across all markets. Stay patient, stay objective, and react with clarity.
If this breakdown helped you see the setup more clearly, a like would mean a lot — and I’d love to hear your thoughts in the comments! Are you watching the same zone, or do you see something different?
Eurusd-4
XAU/USD | Gold Holding Strong – Watching for Next Bullish Move!By analyzing the gold chart on the 4-hour timeframe, we can see that yesterday, as expected, when the price dropped to around $3357, it faced strong buying pressure and rallied up to $3377. After that, it corrected again, pulling back to $3338 so far, and is currently trading around $3341. If gold manages to hold above $3337, we can expect another bullish move, with potential targets at $3347, $3354, $3364, and $3374.
Please support me with your likes and comments to motivate me to share more analysis with you and share your opinion about the possible trend of this chart with me !
Best Regards , Arman Shaban

EURUSD at Make-or-Break Zone: Time to Short?EURUSD – Key Data Out Today, Short Setup Confirmed?
Today, several important economic indexes were released for both the Euro(EUR) and the Dollar(USD) . Let’s break them down in a simple way:
Eurozone PMI Data: Mixed to Weak
France:
Manufacturing PMI: 48.4 (slightly lower than forecast)
Services PMI : 49.7 (flat, but below 50 = contraction)
Germany:
Manufacturing PMI: 49.2 (weaker than expected)
Services PMI : 50.1(slightly expansionary)
Eurozone Overall:
Manufacturing PMI: 49.8 (still below 50)
Services PMI : 51.2 (slightly stronger than forecast)
ECB left the Main Refinancing Rate unchanged at 2.15% , which was widely expected.
U.S. Data( TVC:DXY ): Strong and Surprising
Unemployment Claims: 217K (better than expected 227K)
Manufacturing PMI: 49.5 (below forecast of 52.7 – a negative surprise)
Services PMI: 55.2 (well above forecast and previous – bullish for USD)
Interpretation :
The Eurozone's growth remains sluggish, especially in France and Germany.
Despite a drop in U.S. manufacturing, the services sector remains strong, and unemployment data confirms labor market resilience.
This mixed picture slightly tilts the balance in favor of the U.S. dollar, especially as the ECB remains on hold while the Fed may still consider being restrictive.
Bias: Short EURUSD ( FX:EURUSD )
Fundamentals support a Short position in EURUSD, in line with the current technical setup.
---------------------------------
Now let's take a look at the EURUSD chart on the 4-hour time frame to find the best Short position .
EURUSD is currently trading in an Ascending Channel and at a Heavy Resistance zone($1.1845-$1.1602) .
Also, in terms of Elliott wave theory , it seems that EURUSD is completing a microwave 5 of the main wave 5 .
One of the most important supports ahead for EURUSD could be the 100_SMA(4-hour TF) .
If the currently 4-hour candlestick forms a Shooting Star Candlestick Pattern , it is a better sign for EURUSD to fall .
Also, we can see the Regular Divergence(RD-) between Consecutive Peaks .
I expect EURUSD to decline to at least $1.169 AFTER breaking the lower line of the ascending channel .
Second Target: Support zone($1.1642-$1.158) and Monthly Pivot Point.
Note: Stop Loss(SL)= $1.1850
Please respect each other's ideas and express them politely if you agree or disagree.
Euro/U.S. Dollar Analyze (EURUSD), 4-hour time frame.
Be sure to follow the updated ideas.
Do not forget to put a Stop loss for your positions (For every position you want to open).
Please follow your strategy and updates; this is just my Idea, and I will gladly see your ideas in this post.
Please do not forget the ✅' like '✅ button 🙏😊 & Share it with your friends; thanks, and Trade safe.

Euro may reach resistance level, break it and continue to growHi guys, this is my overview for EURUSD, feel free to check it and write your feedback in comments👊
For an extended period, the price was dictated by a descending channel, with each rally attempt failing at its upper boundary.
The downward trend culminated in a test of the crucial support level at $1.1635, where sellers were unable to secure a foothold, signaling a potential momentum shift.
This shift was confirmed when buyers took control, launching an upward impulse that decisively breached the long-standing resistance of the channel's upper trendline.
After the breakout, the price established a new local support base above the former channel, solidifying the change in market structure.
The subsequent rally carried the asset's price to the significant horizontal resistance zone around $1.1755, where the upward advance has temporarily stalled.
I expect that after a brief consolidation, bullish pressure will resume, enabling the price to break the $1.1755 barrier and continue towards the $1.1820 target.
If this post is useful to you, you can support me with like/boost and advice in comments❤️
Disclaimer: As part of ThinkMarkets’ Influencer Program, I am sponsored to share and publish their charts in my analysis.

EUR/USD - Bullish parallel channel formation!The EUR/USD currency pair is currently exhibiting a bullish market structure on the 4-hour timeframe, moving steadily within a well-defined ascending parallel channel. Price action has consistently bounced between the lower and upper boundaries of the channel, with each dip finding support at the lower trendline and each rally meeting resistance near the upper trendline. This ongoing pattern suggests a strong and orderly bullish trend as the pair continues to make higher highs and higher lows within the channel.
The Market’s Upward Momentum
One notable feature of this trend is the recurring formation of 4-hour Fair Value Gaps (FVGs) during each upward leg. These FVGs act as temporary inefficiencies in the price movement, which the market consistently returns to fill before resuming its bullish momentum. As shown in the chart, the EUR/USD has filled multiple FVGs over the past week. Today, the pair once again retraced to fill a newly formed 4H FVG and has since continued its move higher. This repeated behavior reinforces the strength of the uptrend, as the market efficiently corrects itself and then propels further in the direction of the overall trend.
Bullish Outlook
From a bullish perspective, the key level to watch is the horizontal resistance zone around 1.1766. A confirmed break and hold above this level would signal a strong continuation of the current uptrend. Should the price sustain itself above this level, it could initiate a renewed push toward the upper boundary of the ascending channel, potentially targeting levels near 1.1820 and beyond. This scenario would confirm market confidence and open the door for further gains.
Bearish Risk
On the flip side, the bearish case would involve a false breakout above the 1.1766 resistance level, followed by a sharp rejection and a break below the rising lower trendline of the channel. Such a move would invalidate the current structure and shift the bias to the downside. In that case, the 4-hour FVG located between approximately 1.1710 and 1.1740 will act as a critical support zone. If this area fails to hold, it could trigger a deeper retracement and potentially lead to a more prolonged bearish correction.
Final thoughts
In summary, the EUR/USD is currently respecting a bullish parallel channel on the 4-hour timeframe, with upward moves consistently leaving and then filling 4H FVGs before continuing higher. The 1.1766 level is pivotal, a sustained break above it favors continued bullish momentum, while a rejection and breakdown from the channel could signal a bearish reversal. Traders should closely monitor price behavior around this key level and the integrity of the ascending channel to anticipate the next significant move.
-------------------------
Disclosure: I am part of Trade Nation's Influencer program and receive a monthly fee for using their TradingView charts in my analysis.
Thanks for your support. If you enjoyed this analysis, make sure to follow me so you don't miss the next one. And if you found it helpful, feel free to drop a like 👍 and leave a comment 💬, I’d love to hear your thoughts!

Euro will rise a little and then start to fall to support lineHello traders, I want share with you my opinion about Euro. After a prolonged consolidation period, a strong upward trend was initiated from the buyer zone around 1.1285, propelling the EUR significantly higher. This initial impulsive move has since transitioned into a more complex and mature phase, taking the shape of a large upward wedge formation, a pattern which often signals underlying exhaustion in the prevailing trend. Currently, the pair is operating within this defined market zone, characterized by a clear ascending support line and a corresponding resistance line. The price action inside the wedge has become corrective, with the most recent upward correction originating from the support area near 1.1575. The working hypothesis is centered on a short-term bearish scenario, which anticipates that this current rally will fail as it approaches the upper boundary of the wedge. A rejection from this resistance would confirm that selling pressure is increasing and that the bullish momentum is waning. This would likely trigger a significant downward rotation within the structure, with the immediate objective being a retest of the main ascending support line. For this reason, the TP is strategically and logically placed at the 1.1665 level, as this point lies directly on the trend line and serves as the most critical test for the existing uptrend's viability. Please share this idea with your friends and click Boost 🚀
Disclaimer: As part of ThinkMarkets’ Influencer Program, I am sponsored to share and publish their charts in my analysis.

GER40 in Motion: This Setup Speaks Volumes 🌅 Good morning, my friends,
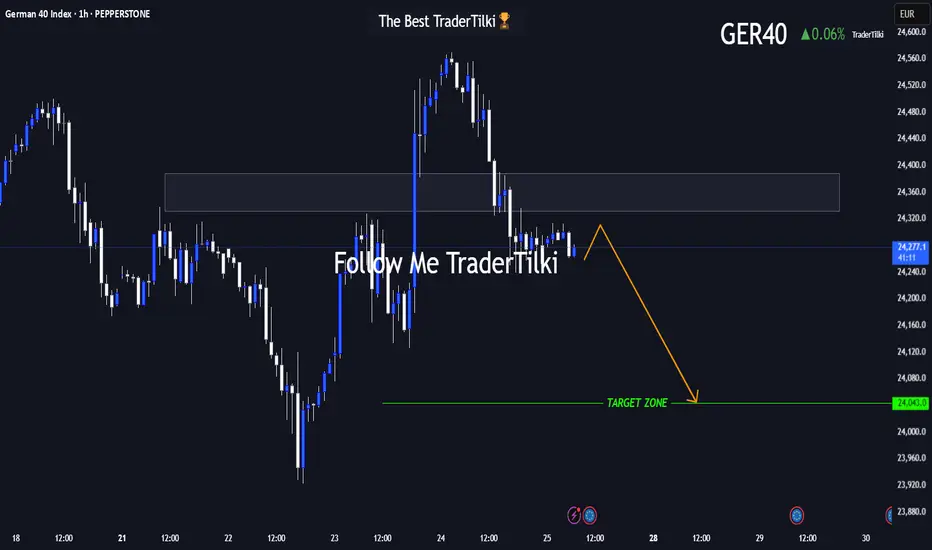
I’ve put together a fresh GER40 analysis just for you. Even if the 1-hour timeframe shows some upward momentum, I fully expect the price to reach my target level of **24,050**.
I'm holding firm until that level is hit.
Every single like from you is a massive source of motivation for me to keep sharing analysis. Huge thanks to everyone supporting with a tap!
EUR/USD | Correction Near Key Demand – Watching for Rebound!By analyzing the EURUSD chart on the 4-hour timeframe, we can see that after the last analysis, the price started a correction and is currently trading around 1.17150. I expect that once it enters the 1.16780–1.17100 zone, we could see a rebound from this key demand area. If the price holds above this zone, the next bullish targets will be 1.17370 as the first target and 1.17730 as the second.
Please support me with your likes and comments to motivate me to share more analysis with you and share your opinion about the possible trend of this chart with me !
Best Regards , Arman Shaban

EUR/USD H4 DOWNWARD 🔄 Disrupted EUR/USD 4H Analysis
🟢 Current Context:
Price is currently at 1.17375, slightly below the resistance area (1.17400–1.17500).
Market shows a recent bullish impulse, followed by consolidation within the marked resistance zone.
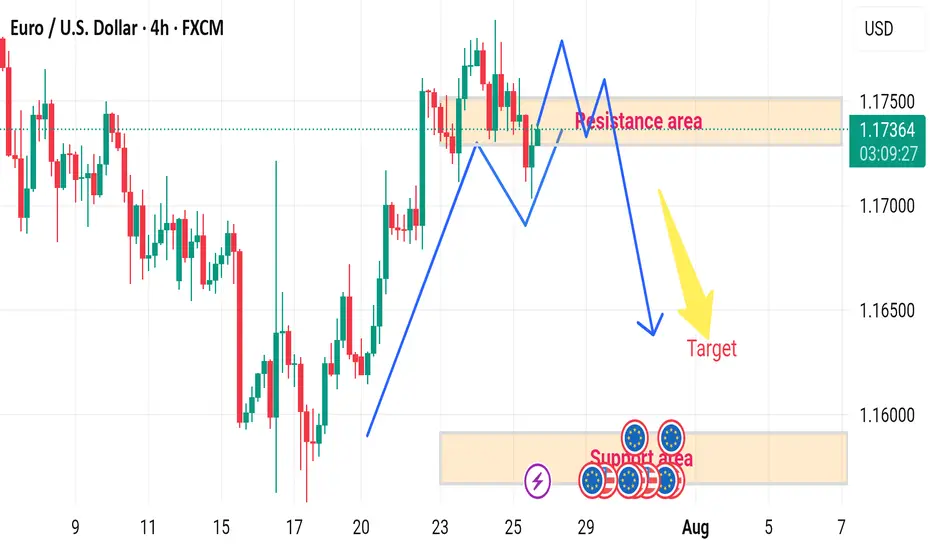
Projection in the image suggests a double-top pattern forming at resistance, followed by a bearish reversal toward the target demand area (~1.15800–1.16000).
---
⚠️ Disruption Points:
1️⃣ Failed Double Top Scenario
Disruption Hypothesis: Instead of forming a clean double top and reversing, price may break above the resistance zone at 1.17500.
Reasoning: Strong bullish momentum and recent higher highs indicate potential for bullish continuation, invalidating the bearish target.
Disrupted Path: Price could break out → retest the resistance as new support → continue toward 1.18000–1.18300 zone.
2️⃣ Mid-Range Liquidity Trap
The current range may act as a liquidity trap:
Smart money could push the price slightly below support (fake breakdown), attract sellers, then reverse sharply upwards.
This would trap retail sellers targeting the 1.15800 zone.
EURUSD | Time For A Pullback?The week kicked off with strong impulsive moves to the upside, leaving no room for deeper correction. Then slowly from Wednesday, we started to see a decline in strength in the bullish run.
Now, with price edging toward the next swing low for a possible bearish change of character, is this a good way to ride the stream to the downside?
Keep your A-game on as we watch price unfold, and trade reactively to price movement.
Do not forget to guard your capitals with risk management.
Good luck traders. 👍
Follow me for more and more of these analyses.
See you on the next one. 🫡

HelenP. I Euro can reach resistance zone and then dropHi folks today I'm prepared for you Euro analytics. If we look at the chart, we can observe a mature uptrend that has been supported by a major ascending trend line for an extended period. However, the momentum of this trend appears to be waning, as evidenced by the price's recent failure to establish new highs. The asset is currently trading below the critical resistance zone of 1.1770 - 1.1800, an area that has proven to be a significant barrier for buyers. My analysis for a short position is based on the condition of a final retest of this resistance zone. I believe the price will make another attempt to rally into this area, and a forceful rejection from this zone would serve as the confirmation that sellers are taking definitive control of the market. Such a rejection would likely initiate a strong downward impulse with sufficient momentum to break the long-standing ascending trend line, a pivotal event that would shift the market structure. Therefore, the primary goal for this bearish scenario is set at the 1.1600 level, a logical target for the price to reach after such a significant structural break. If you like my analytics you may support me with your like/comment ❤️
Disclaimer: As part of ThinkMarkets’ Influencer Program, I am sponsored to share and publish their charts in my analysis.

EURUSD – Bulls Still in Control, Trend ResumesIn my previous EURUSD analysis, I pointed out that the pair was nearing an important confluence support around 1.1620, and that – given the overall bullish trend – this zone could offer solid long opportunities.
What followed?
The market briefly dipped below that zone, even challenging the psychological 1.1600 round number. But instead of breaking down, bulls regrouped, stepped in with force, and pushed the pair aggressively higher.
📍 At the time of writing, EURUSD is trading at 1.1770, and my long trade is running with a comfortable 150 pips profit.
🔍 W hat’s Next?
The current structure suggests a continuation of the uptrend, and the logical technical target is the recent high at 1.1830.
Until proven otherwise, this is still a buy-the-dip market.
✅ Buying around 1.1700 could be a valid setup, especially if we see buying power on the intraday chart
⚠️ The Warning Sign
Despite the bullish bias, keep in mind:
If EURUSD drops and closes below 1.1670, the structure begins to shift — and this could signal a deeper correction or even trend reversal.
📌 Until then, the bias remains bullish, dips are to be watched for entries, and 1.1830 is the next checkpoint.
D isclosure: I am part of TradeNation's Influencer program and receive a monthly fee for using their TradingView charts in my analyses and educational articles.

DXY: USD Flexes Muscle - Pairs SlideFriday, July 25, 2025
The foreign exchange markets are experiencing a pronounced USD bullish session this morning, with the US Dollar Index (DXY) showing robust gains of +0.35% while simultaneously pressuring all major currency pairs into negative territory. The Japanese Yen (JPY) is bearing the brunt of this dollar strength, currently registering losses between -0.4% to -0.66% across JPY pairs. This market behavior suggests traders should pay particularly close attention to DXY dynamics, as its movements will likely dictate price action across all major currency pairs in today's session.
Technical Perspective: DXY at Critical Inflection Point
A detailed examination of the Dollar Index reveals several compelling technical factors that market participants should consider:
1. Weekly Demand Zone Reaction
- The DXY has demonstrated a strong rejection from a significant weekly demand area
- The subsequent bullish spike indicates potential continuation of upward momentum
- This price action suggests institutional buyers are defending this key level
2. Commitment of Traders (COT) Report Insights
Non-commercial traders (typically hedge funds and speculators) have increased their positions from a bottom level not seen since June 2021 meanwhile the Commercial traders (often corporations hedging FX exposure) show opposing extreme positioning. This stark divergence between trader categories often precedes significant market moves
3. Seasonal Patterns Favor USD Strength
- Historical seasonal analysis indicates the current period typically supports dollar appreciation
- The combination of technical and seasonal factors creates a potentially powerful bullish setup
✅ Please share your thoughts about DXY in the comments section below and HIT LIKE if you appreciate my analysis. Don't forget to FOLLOW ME; you will help us a lot with this small contribution.

EURUSD - Next Buy Zone? This one has some nice potential
We will see how it plays out if we get tagged in

XAU/USD | Watching for Potential Drop Toward $3391! (READ)By analyzing the gold chart on the 4-hour timeframe, we can see that gold continued its bullish move after holding above $3409, successfully hitting the $3440 target and delivering over 200 pips in returns! After reaching this key supply zone, gold corrected down to $3415 and is now trading around $3421. If the price stabilizes below $3431, we can expect further downside movement, with the next bearish targets at $3415, $3404, and $3391. If this scenario fails, an alternative setup will be shared.
Please support me with your likes and comments to motivate me to share more analysis with you and share your opinion about the possible trend of this chart with me !
Best Regards , Arman Shaban

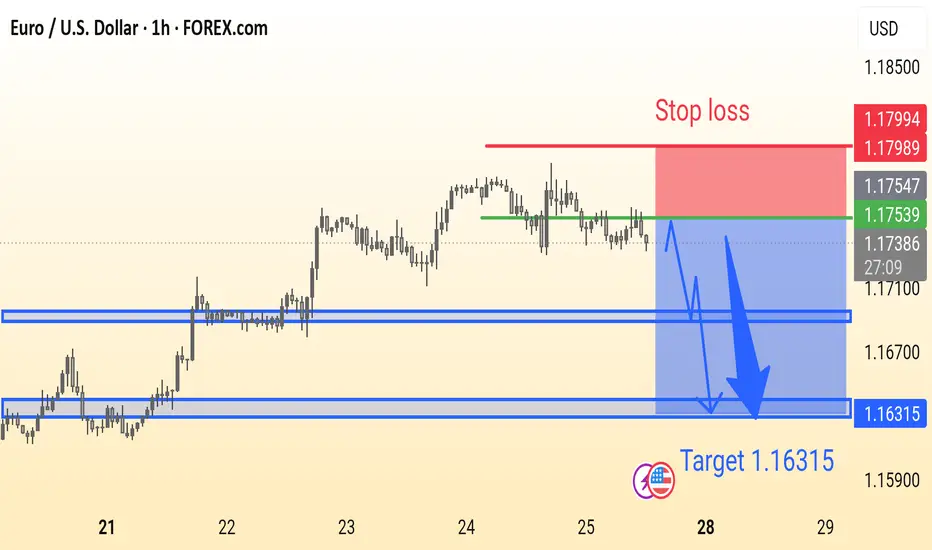
EURUSD Analysis is ReadyEUR/USD Trade Idea (1H Chart):
Price is ranging below resistance with a potential bearish breakout. Suggested Sell near 1.1753 with Stop Loss at 1.1799 and Target at 1.16315. Strong support zones marked for possible reaction.
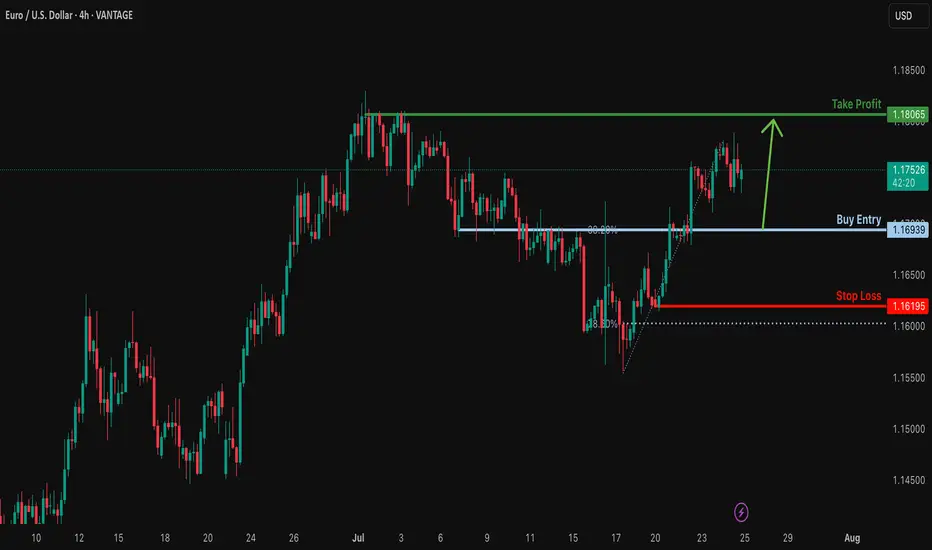
Bullish bounce off overlap support?EUR/USD is falling towards the support level, which is an overlap support that aligns with the 38.2% Fibonacci retracement and could bounce from this level to our take profit.
Entry: 1.1693
Why we like it:
There is an overlap support that lines up with the 38.2% Fibonacci retracement.
Stop loss: 1.1619
Why we like it:
There is a pullback support that is slightly above the 78.6% Fibonacci retracement.
Take profit: 1.1806
Why we like it:
There is a swing high resistance.
Enjoying your TradingView experience? Review us!
Please be advised that the information presented on TradingView is provided to Vantage (‘Vantage Global Limited’, ‘we’) by a third-party provider (‘Everest Fortune Group’). Please be reminded that you are solely responsible for the trading decisions on your account. There is a very high degree of risk involved in trading. Any information and/or content is intended entirely for research, educational and informational purposes only and does not constitute investment or consultation advice or investment strategy. The information is not tailored to the investment needs of any specific person and therefore does not involve a consideration of any of the investment objectives, financial situation or needs of any viewer that may receive it. Kindly also note that past performance is not a reliable indicator of future results. Actual results may differ materially from those anticipated in forward-looking or past performance statements. We assume no liability as to the accuracy or completeness of any of the information and/or content provided herein and the Company cannot be held responsible for any omission, mistake nor for any loss or damage including without limitation to any loss of profit which may arise from reliance on any information supplied by Everest Fortune Group.
EURUSD: Long Signal with Entry/SL/TP
EURUSD
- Classic bullish pattern
- Our team expects retracement
SUGGESTED TRADE:
Swing Trade
Buy EURUSD
Entry - 1.1724
Stop - 1.1714
Take - 1.1743
Our Risk - 1%
Start protection of your profits from lower levels
Disclosure: I am part of Trade Nation's Influencer program and receive a monthly fee for using their TradingView charts in my analysis.
❤️ Please, support our work with like & comment! ❤️

EURUSD: Will Go Up! Long!
My dear friends,
Today we will analyse EURUSD together☺️
The price is near a wide key level
and the pair is approaching a significant decision level of 1.17201 Therefore, a strong bullish reaction here could determine the next move up.We will watch for a confirmation candle, and then target the next key level of 1.17348.Recommend Stop-loss is beyond the current level.
❤️Sending you lots of Love and Hugs❤️

EURUSD – The Comeback is Real! After weeks trapped in a descending channel, EURUSD has broken out in style, launching into a clean bullish channel. Price is now carving a staircase of FVG zones, with momentum clearly favoring the bulls.
What’s fueling the fire?
Flash Manufacturing PMI from Europe beat forecasts
Eurozone consumer confidence improved
Markets pricing in dovish Fed as jobless claims dropped but inflation expectations stall
As long as price stays above 1.1750 and respects the ascending channel, the 1.1850 zone is well within reach.
Strategy: Buy the dips inside the bullish channel. FVGs act as stepping stones for further upside.

EURUSD Massive Bullish Breakout!
HI,Traders !
#EURUSD is trading in a strong
Uptrend and the price just
Made a massive bullish
Breakout of the falling
Resistance line and the
Breakout is confirmed
So after a potential pullback
We will be expecting a
Further bullish continuation !
Comment and subscribe to help us grow !

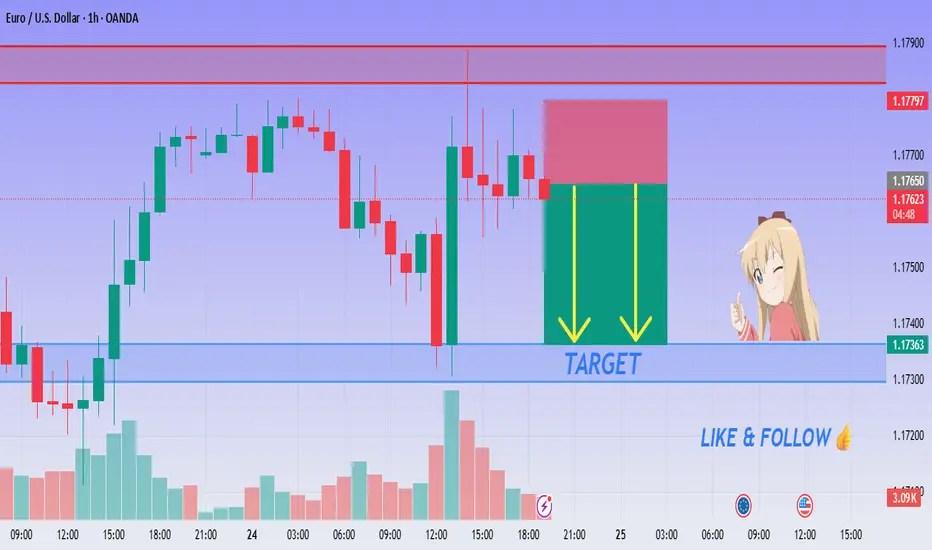
EUR/USD SELL SETUP - Rejection at Resistance!💙 EUR/USD Rejection Confirmed! SELL!
👩💻 Dear traders,
After reviewing the price action on EUR/USD (1H), I’ve concluded the following:
Price is reacting to a clear supply zone around 1.17680 – 1.17780, and signs of rejection have started appearing.
Bias – Bearish
🎯 Target – 1.17450
🎯 Target – 1.17320
🎯 Final Target – 1.17200
🛑 Safe Stop Loss – 1.17820
📊 Reasoning:
– Price touched key resistance and began stalling
– Red zone marks a clean rejection range
– Two yellow arrows show expected short move
– Trend is turning bearish near resistance
– Ideal intraday short setup with clear R:R
🍀 Stay sharp & follow the setup! Good luck!
EURUSD BUY SETUPFOLLOW THE PRICE WILL GO UP
BECAUSE WE HAVE PATTERN ON 5 M
WE have strong candle on frame 4h
