EURUSD Energy buildup supported at 1.1590The EURUSD currency pair continues to exhibit a bullish price action bias, supported by a sustained rising trend. Recent intraday movement reflects a sideways consolidation breakout, suggesting potential continuation of the broader uptrend.
Key Technical Level: 1.1640
This level marks the prior consolidation range and now acts as pivotal support. A corrective pullback toward 1.1640 followed by a bullish rejection would reinforce the bullish trend, targeting the next resistance levels at:
1.1830 – Near-term resistance
1.1900 – Minor swing high
1.1940 – Longer-term bullish objective
On the other hand, a decisive daily close below 1.1640 would invalidate the bullish setup, shifting the outlook to bearish in the short term. This could trigger a deeper retracement toward:
1.1590 – Initial support
1.1530 – Key downside target
Conclusion:
As long as 1.1640 holds as support, the technical outlook remains bullish, favoring long positions on dips. A confirmed break below this level would signal a shift in sentiment and open the door to a corrective pullback phase.
This communication is for informational purposes only and should not be viewed as any form of recommendation as to a particular course of action or as investment advice. It is not intended as an offer or solicitation for the purchase or sale of any financial instrument or as an official confirmation of any transaction. Opinions, estimates and assumptions expressed herein are made as of the date of this communication and are subject to change without notice. This communication has been prepared based upon information, including market prices, data and other information, believed to be reliable; however, Trade Nation does not warrant its completeness or accuracy. All market prices and market data contained in or attached to this communication are indicative and subject to change without notice.
Eurusd-4

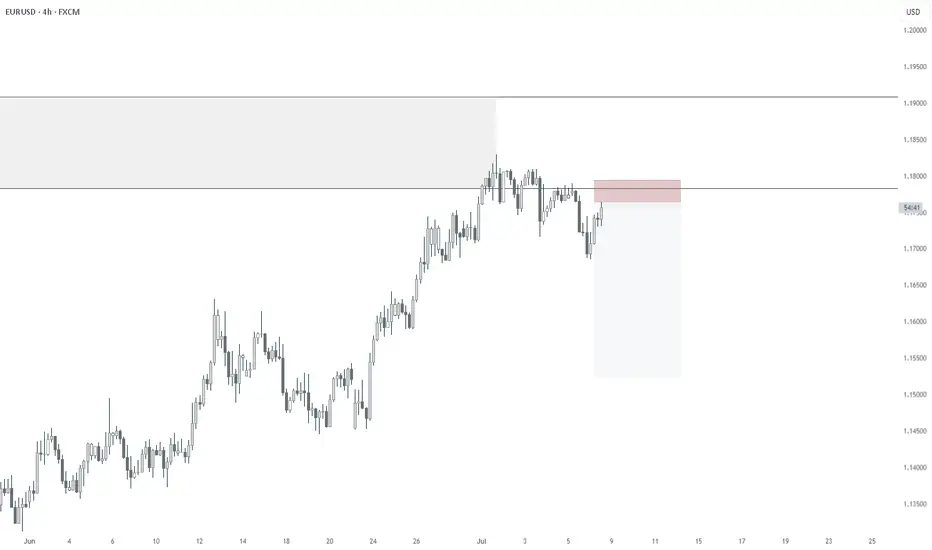
EURUSD - Bears Are on the MoveHello TradingView Family / Fellow Traders. This is Richard, also known as theSignalyst.
📈EURUSD has been overall bearish trading within the falling wedge pattern marked in red. And it is currently retesting the upper bound of the wedge.
Moreover, the blue zone is a strong structure.
🏹 Thus, the highlighted red circle is a strong area to look for sell setups as it is the intersection of the upper red trendline and structure.
📚 As per my trading style:
As #EURUSD approaches the red circle zone, I will be looking for bearish reversal setups (like a double top pattern, trendline break , and so on...)
📚 Always follow your trading plan regarding entry, risk management, and trade management.
Good luck!
All Strategies Are Good; If Managed Properly!
~Rich
Disclosure: I am part of Trade Nation's Influencer program and receive a monthly fee for using their TradingView charts in my analysis.

07/08/2025 - EURUSD - HEDGE SHORTHedge Short for FX:GBPUSD
COT Retailer still extended
We are on the higher timeframe weekly zone
Substructure is already confirmed bearish
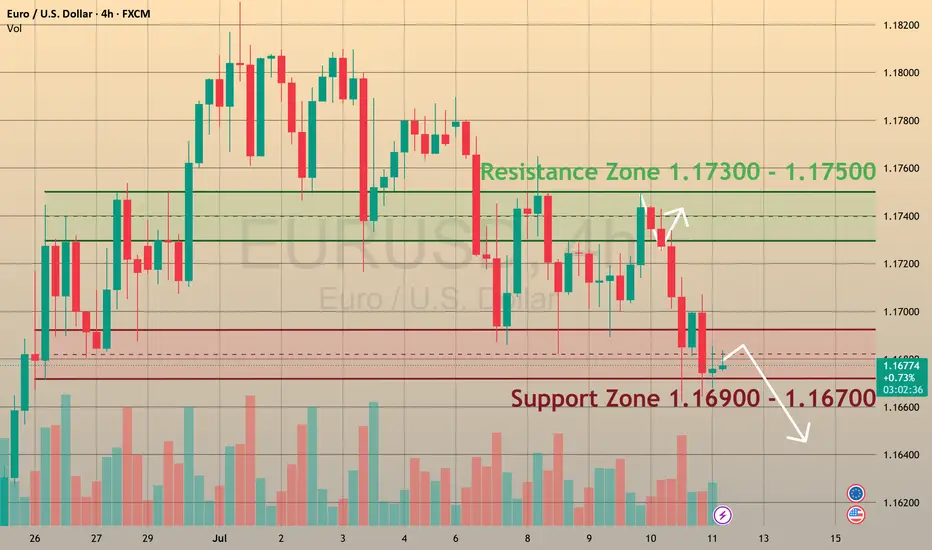
EURUSD is ready to break supportCMCMARKETS:EURUSD
The Euro fell to 1.1670 on Friday, positioning for nearly a 1% weekly loss 📊, as investors recalibrated risk exposure amid escalating trade tensions ⚔️ and shifting monetary policy signals 🏦.
📉 Market Structure:
🔻 EURUSD has traded in a bearish trend since July 1.
🔹 Support levels: 1.1680 and 1.1590.
🔹 Retested the 1.1680 support zone on Friday.
💡 How to Trade This:
✅ If the pair rebounds from support 🔄, consider BUYING with a Take Profit near the next resistance level.
❌ If the support breaks with confirmation 🩻, consider SELLING to target lower support zones.
📰 What’s Driving the Move?
🏦 Monetary Policy:
Chicago Fed President Austan Goolsbee pushed back against calls for aggressive rate cuts 🗣️, reaffirming the Fed’s focus on its dual mandate of maximum employment and price stability ⚖️. His cautious stance adds uncertainty 🤔 to the policy outlook for the second half of the year as markets weigh inflation risks vs. growth slowdown signals.
💼 Economic Data:
The labor market remains solid 💪, but recent jobless claims data show early signs of cooling 🧊, following last week’s strong NFP report.
💵 Dollar Strength:
The dollar advanced sharply against the euro 🚀, driven by risk aversion, relative yield advantages, and investor positioning ahead of upcoming inflation data and the Fed’s next policy signals 📈.
🚨 Watch for:
🔸 A confirmed breakout or rebound at 1.1680 to guide trade entries.
🔸 Upcoming U.S. inflation data 🪙 for direction on Fed policy and USD strength.
🔸 Further developments in trade tensions 🌐, which could drive risk sentiment.
11.07.25 Morning ForecastPairs on Watch -
FX:EURUSD
FX:EURCAD
FX:EURAUD
A short overview of the instruments I am looking at for today, multi-timeframe analysis down to what I will be looking at for an entry. Enjoy!

EURUSD H4 I Bearish Reversal Based on the H4 chart, the price is trading near our sell entry level at 1.1692, a pullback resistance.
Our take profit is set at 1.1610, a pullback support.
The stop loss is set at 1.1765, a swing high resistance.
High Risk Investment Warning
Trading Forex/CFDs on margin carries a high level of risk and may not be suitable for all investors. Leverage can work against you.
Stratos Markets Limited (tradu.com ):
CFDs are complex instruments and come with a high risk of losing money rapidly due to leverage. 63% of retail investor accounts lose money when trading CFDs with this provider. You should consider whether you understand how CFDs work and whether you can afford to take the high risk of losing your money.
Stratos Europe Ltd (tradu.com ):
CFDs are complex instruments and come with a high risk of losing money rapidly due to leverage. 63% of retail investor accounts lose money when trading CFDs with this provider. You should consider whether you understand how CFDs work and whether you can afford to take the high risk of losing your money.
Stratos Global LLC (tradu.com ):
Losses can exceed deposits.
Please be advised that the information presented on TradingView is provided to Tradu (‘Company’, ‘we’) by a third-party provider (‘TFA Global Pte Ltd’). Please be reminded that you are solely responsible for the trading decisions on your account. There is a very high degree of risk involved in trading. Any information and/or content is intended entirely for research, educational and informational purposes only and does not constitute investment or consultation advice or investment strategy. The information is not tailored to the investment needs of any specific person and therefore does not involve a consideration of any of the investment objectives, financial situation or needs of any viewer that may receive it. Kindly also note that past performance is not a reliable indicator of future results. Actual results may differ materially from those anticipated in forward-looking or past performance statements. We assume no liability as to the accuracy or completeness of any of the information and/or content provided herein and the Company cannot be held responsible for any omission, mistake nor for any loss or damage including without limitation to any loss of profit which may arise from reliance on any information supplied by TFA Global Pte Ltd.
The speaker(s) is neither an employee, agent nor representative of Tradu and is therefore acting independently. The opinions given are their own, constitute general market commentary, and do not constitute the opinion or advice of Tradu or any form of personal or investment advice. Tradu neither endorses nor guarantees offerings of third-party speakers, nor is Tradu responsible for the content, veracity or opinions of third-party speakers, presenters or participants.

EUR/USD Testing Support — Will Buyers Step In Again?Hi Everyone,
Since our last update, EUR/USD is currently testing the 1.16680 support level. We’re watching for buying interest to emerge above the key 1.16450 zone; if price can stabilise here, we could see a retest of the highlighted resistance area around 1.17450.
Our broader outlook remains unchanged: as long as price holds above 1.16450, we continue to look for the pair to build momentum for another move higher in the coming sessions. A decisive break above last week’s high could attract fresh buying interest, paving the way for a push towards the 1.19290 area and ultimately 1.20000.
We'll be watching closely to see if this recovery gains traction and whether buyers can sustain the move above resistance. The longer-term view remains bullish, provided price continues to respect the key support zone.
We’ll keep updating you through the week as the structure unfolds and share how we’re managing our active positions.
Thanks again for all the likes/boosts, comments and follows — we really appreciate the support!
All the best for the rest of the week. Trade safe.
BluetonaFX

GBPJPY - Multi Year SHORTS Coming! (Over 10,000pips)Here we have the 2 month chart of GBPJPY. We can see that we're in a massive ending diagonal made up of 5 waves.
We are currently on wave 4 and have almost completed. At the moment we are working within the parameters of a channel however we must be aware that we may exceed the channel. The channel is just there for us to use as a guideline.
In 2007, we have a really nice ending diagonal (expanding) before we made that ridiculous +13k pip drop.
See below for the 2D GBPJPY chart from 2007:
We can see that the lower timeframe diagonal broke down beautifully.
We are anticipating something similar this time round!
See below for the 2D GBPJPY chart of the current diagonal:
We've got an almost identical price action as 2007. We just got to wait a little and watch for the break of the red trendline and enter and hold.
See below for the 2week chart of GBPJPY:
Trade Idea:
- Watch for a break of the ending diagonal
- Alternatively, you can wait for a pullback after the ending diagonal breaks
- stop loss above highs once entry trendline breaks
- Swing Target: 100 (10,000pips)
What do you guys think?
Goodluck and as always, trade safe!

GBPJPY - Multi-Year Short Update! In our last setup for GBPJPY, we identified a massive diagonal pattern, with price completing wave 4 and preparing for a multi-year drop into wave 5.
Since then, price has played out exactly as forecasted — we've seen a clean impulse lower for wave 1, followed by an ABC correction for wave 2, which looks to have now completed.
This sets the stage for the next major leg — wave 3 of 5 — which historically carries the most power and momentum.
📉 See monthly chart here:
📊 GBP/JPY Wave‑3 Trade Idea
Background:
We’ve completed wave 1 down and wave 2 up (ABC correction).
GBPJPY is now positioned to start a powerful wave 3 down — the most impulsive leg in an Elliott sequence.
🔍 Current Price Action:
Price is rejecting major resistance (previous wave A high + shaded zone)
Structure shows a completed 5-wave move up within C, suggesting exhaustion.
A clean ascending trendline (red) has formed under wave v — a break here signals the first confirmation.
Option 1 – Aggressive Entry:
- Trigger: Break and close below the red trendline (~198.00–197.80 zone) on the daily.
- Entry: On candle close below trendline
- Stop Loss: Above recent high ~199.80 and then breakeven once we move lower
Option 2 – Conservative Entry (preferred):
- Trigger: Trendline break + correction
- Entry: On bearish confirmation and then a correction to indicate further downside
- Stop Loss: Above recent high ~199.80 and then breakeven once we move lower
Take Profit Levels:
- TP1: 192
- TP2: 180
- TP3: 175
- Final Target: Trail for extended move toward wave (3) lows (could be 10,000+ pips over long term)
🔐 Invalidation:
Daily close back above 200.00 or impulsive rally beyond the pink resistance zone invalidates the short bias in the short term.
✅ Summary:
This is a high-conviction, structure-backed setup with:
- Wave count + Fib confluence
- Bearish structure at key resistance
- Confirmation-based trigger (trendline break + retest)
- Excellent long-term risk-to-reward profile
📂 Previous GBPJPY Setups (Track Record):
📌 Free Setup (Big Picture Outlook) – Multi-Year Shorts Incoming (Wave 4 Completion)
✅ Swing 1 – 1,200 Pips (VIP GBPJPY Long)
✅ Swing 2 – 1,000 Pips (VIP GBPJPY Short)
✅ Swing 3 – 1,100 Pips (VIP GBPJPY Short)
✅ Swing 4 – 700 Pips (VIP GBPJPY Short)

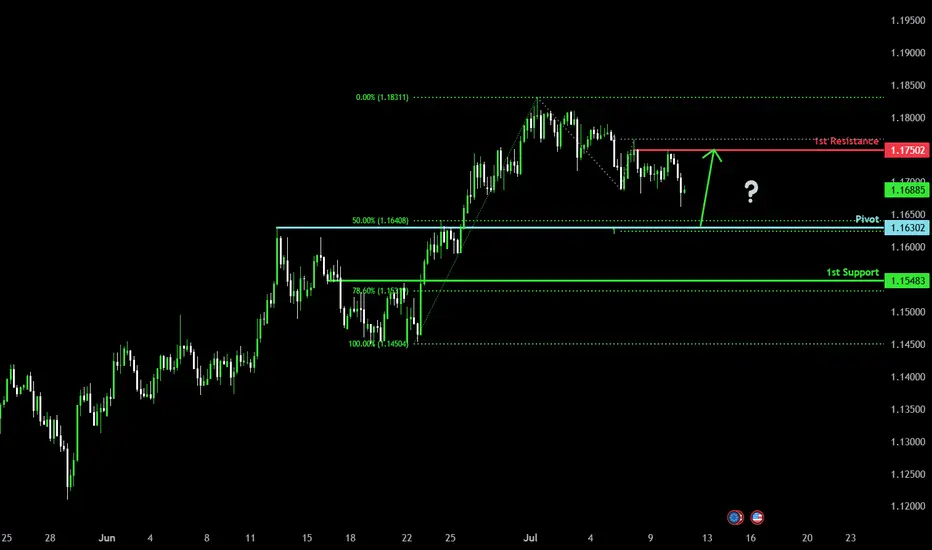
Bullish bounce off major support?EUR/ISD is falling towards the pivot which is a pullback support that lines up with the 50% Fibonacci retracement and could bounce to the 1st resistance,
Pivot: 1.1688
1st Support: 1.1548
1st Resistance: 1.1750
Risk Warning:
Trading Forex and CFDs carries a high level of risk to your capital and you should only trade with money you can afford to lose. Trading Forex and CFDs may not be suitable for all investors, so please ensure that you fully understand the risks involved and seek independent advice if necessary.
Disclaimer:
The above opinions given constitute general market commentary, and do not constitute the opinion or advice of IC Markets or any form of personal or investment advice.
Any opinions, news, research, analyses, prices, other information, or links to third-party sites contained on this website are provided on an "as-is" basis, are intended only to be informative, is not an advice nor a recommendation, nor research, or a record of our trading prices, or an offer of, or solicitation for a transaction in any financial instrument and thus should not be treated as such. The information provided does not involve any specific investment objectives, financial situation and needs of any specific person who may receive it. Please be aware, that past performance is not a reliable indicator of future performance and/or results. Past Performance or Forward-looking scenarios based upon the reasonable beliefs of the third-party provider are not a guarantee of future performance. Actual results may differ materially from those anticipated in forward-looking or past performance statements. IC Markets makes no representation or warranty and assumes no liability as to the accuracy or completeness of the information provided, nor any loss arising from any investment based on a recommendation, forecast or any information supplied by any third-party.
Bullish reversal?The Fiber (EUR/USD) is reacting off the support level which is a pullback support and could rise from this level to our take profit.
Entry: 1.1684
Why we like it:
There is a pullback support.
Stop loss: 1.1652
Why we like it:
There is a pullback support that aligns with the 161.8% Fibonacci extension.
Take profit: 1.1738
Why we like it:
There is an overlap resistance.
Enjoying your TradingView experience? Review us!
Please be advised that the information presented on TradingView is provided to Vantage (‘Vantage Global Limited’, ‘we’) by a third-party provider (‘Everest Fortune Group’). Please be reminded that you are solely responsible for the trading decisions on your account. There is a very high degree of risk involved in trading. Any information and/or content is intended entirely for research, educational and informational purposes only and does not constitute investment or consultation advice or investment strategy. The information is not tailored to the investment needs of any specific person and therefore does not involve a consideration of any of the investment objectives, financial situation or needs of any viewer that may receive it. Kindly also note that past performance is not a reliable indicator of future results. Actual results may differ materially from those anticipated in forward-looking or past performance statements. We assume no liability as to the accuracy or completeness of any of the information and/or content provided herein and the Company cannot be held responsible for any omission, mistake nor for any loss or damage including without limitation to any loss of profit which may arise from reliance on any information supplied by Everest Fortune Group.

EUR-USD Bullish Bias! Buy!
Hello,Traders!
EUR-USD is trading in an
Uptrend and the pair is
Making a local bearish correction
But we are bullish biased and
After the retest of the horizontal
Support of 1.1640
We will be expecting a further
Bullish move up
Buy!
Comment and subscribe to help us grow!
Check out other forecasts below too!
Disclosure: I am part of Trade Nation's Influencer program and receive a monthly fee for using their TradingView charts in my analysis.

EURUSD is Approaching an Important Support!!Hey Traders, in today's trading session we are monitoring EURUSD for a buying opportunity around 1.16400 zone, EURUSD is trading in an uptrend and currently is in a correction phase in which it is approaching the trend at 1.16400 support and resistance area.
Trade safe, Joe.
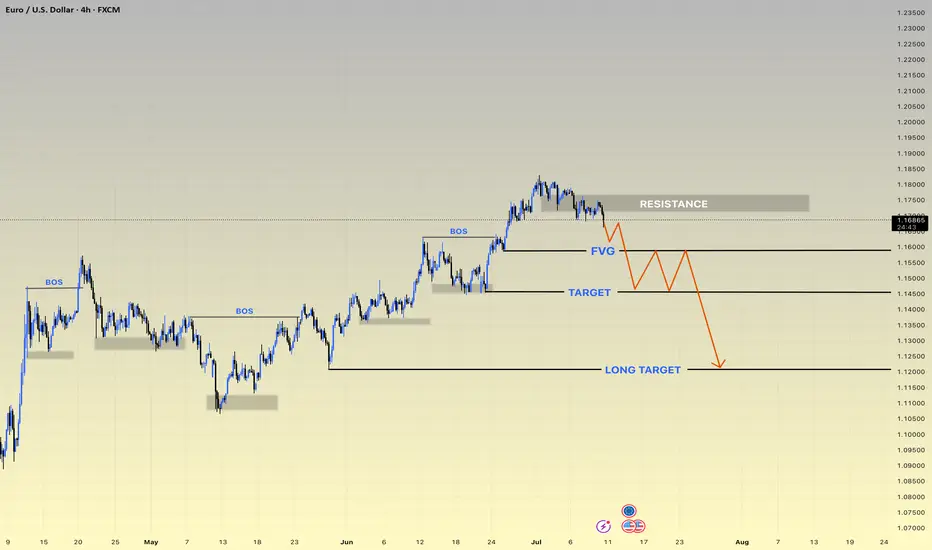
EURUSD h4 update ⚠️ Current Outlook: Reversal Zone Hit
• Price tapped into the strong RESISTANCE zone (~1.1800), failing to break higher.
• Market structure BOS (Break of Structure) confirms bearish intent.
• FVG (Fair Value Gap) likely to act as a short-term liquidity trap.
📍 Disrupted Bearish Flow:
1. Price rejects resistance aggressively ✅
2. Pullback into FVG may trigger a liquidity hunt 🧲
3. Fake bounce → Smart Money re-entry expected 👀
4. Target levels:
• 🥅 TARGET: 1.1550 zone (first major support)
• 🎯 LONG TARGET: 1.1200 zone (high probability zone for HTF buyers)
🔁 Bear Trap Setup Possibility:
• After hitting the LONG TARGET, price could reverse sharply.
• Watch for accumulation signs and deviation below key levels.
⸻
🔥 Key Zones to Watch:
• 🔳 Resistance: 1.1790–1.1820
• 🟦 FVG Retest Zone: 1.1630–1.1660
• 📉 Target Zone: 1.1500–1.1550
• 🚨 Long-Term Demand Zone: 1.1180–1.123
EURUSD Below 1.1745 – Bearish Bias in PlayFX:EURUSD Technical Outlook
EURUSD maintains bearish momentum as long as the price remains below 1.1745, with a near-term target at 1.1684.
A confirmed breakout above 1.1745 would shift the trend to bullish, opening the path toward 1.1808 and 1.1883.
On the downside, a 1H or 4H candle close below 1.1684 would reinforce the bearish trend, likely extending losses toward 1.1627, and possibly 1.1557.
Support: 1.1684 / 1.1627 / 1.1557
Resistance: 1.1808 / 1.1883

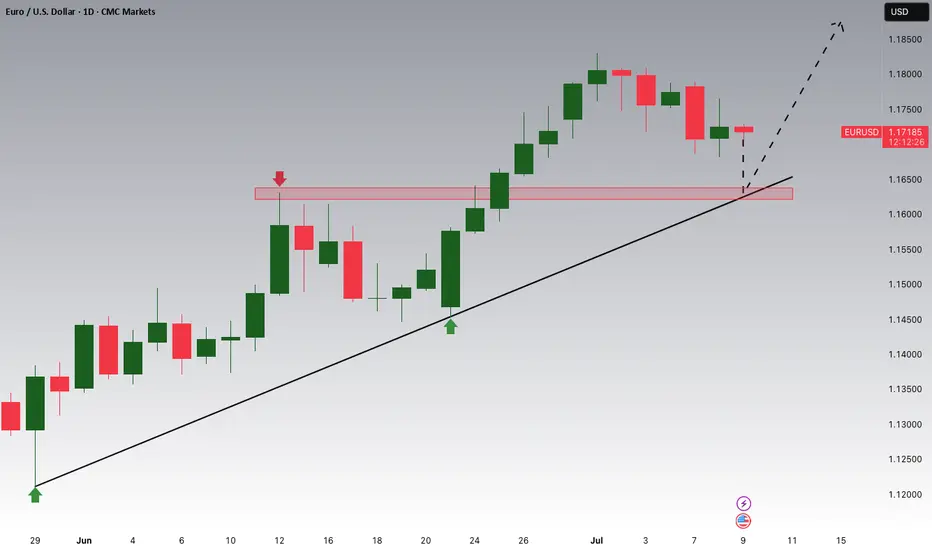
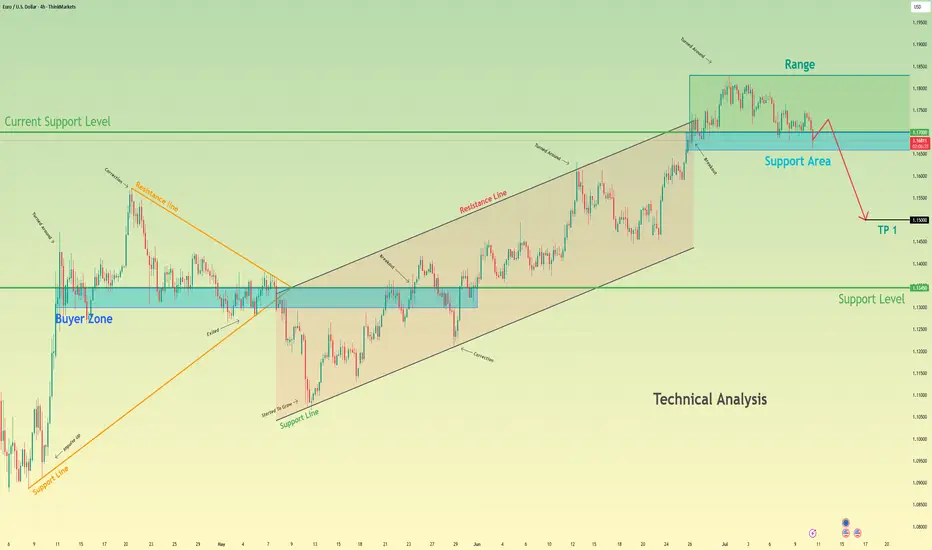
After breaking support level, Euro can continue to fallHello traders, I want share with you my opinion about Euro. After forming an ascending channel, the price steadily moved higher and reached a local range area near 1.1850 points. However, once it entered this zone, the momentum faded. The market started showing signs of distribution, and we saw multiple attempts to push higher being rejected. This range acted as a cap, preventing further growth. Now, the price has pulled back and is trading near the current support level at 1.1700, which also coincides with the support area. This zone has already been tested several times, and each bounce has been weaker than the previous one. That suggests growing pressure from sellers. Looking at the broader structure, the price exited the previous triangle formation with an upward move, but now that impulse has exhausted. The rising wedge is also broken. Based on the behavior at resistance and the weakness around the current support, I expect a breakdown from the range and further decline toward TP 1 at 1.1500 points. If bearish pressure continues, the price could eventually reach the major buyer zone around 1.1345 - 1.1300 points. Given the weakening momentum, retests of support, and lack of bullish continuation, I remain bearish and anticipate a continuation of the downtrend. Please share this idea with your friends and click Boost 🚀
Disclaimer: As part of ThinkMarkets’ Influencer Program, I am sponsored to share and publish their charts in my analysis.
EURUSD Will Keep Growing!
HI,Traders !
#EURUSD is trading in an
Uptrend and the pair broke
The key horizontal level
Of 1.16370 and the breakout
Is confirmed so after a potential
Retest of the support cluster
Of the rising and horizontal
Support lines below we will
Be expecting a bullish continuation !
Comment and subscribe to help us grow !

EURUSD: Absolute Price Collapse Ahead! Short!
My dear friends,
Today we will analyse EURUSD together☺️
The price is near a wide key level
and the pair is approaching a significant decision level of 1.17309 Therefore, a strong bearish reaction here could determine the next move down.We will watch for a confirmation candle, and then target the next key level of 1.17241..Recommend Stop-loss is beyond the current level.
❤️Sending you lots of Love and Hugs❤️

A New Chapter Begins with EURUSD’s ABC Wave Formation!🎯 Hey Guys,
I’ve prepared a fresh EURUSD analysis for you.
The market has shifted direction, and an ABC wave structure has emerged.
I’ve placed a Buy Limit order based on my entry level.
Below, you’ll find my detailed target zones and entry specifics:
🟩 Buy Limit Order: 1.17197
🟥 Stop Loss: 1.16903
📌 Targets:
🔹 TP1: 1.17344
🔹 TP2: 1.17538
🔹 TP3: 1.17869
📊 Risk/Reward Ratio: 2.27
Your likes and support are what keep me motivated to share these analyses consistently.
Huge thanks to everyone who shows love and appreciation! 🙏
EURUSD Eyes Key Levels Ahead of DataFOREXCOM:EURUSD
EURUSD is trading within the 1.1680 – 1.1810 range 📊, continuing its upward momentum during the Asian and early European sessions 🌏⬆️.
⚡️ Markets are now focusing on potential trade negotiations with India and the EU 🤝, which could shape near-term currency moves and risk sentiment 🌐.
📈 Today at 12:30 p.m. UTC 🕧, the U.S. Jobless Claims report 📑 may trigger volatility across all USD pairs ⚠️. Stronger-than-expected data could delay Fed rate cuts 🕰️🔻 and push EURUSD below 1.1700 🩻, while weaker figures may weigh on the U.S. dollar 💵⬇️ and lift EURUSD above 1.1800 🚀.
👀 We will monitor these levels closely for potential breakout opportunities. Stay tuned for live updates!
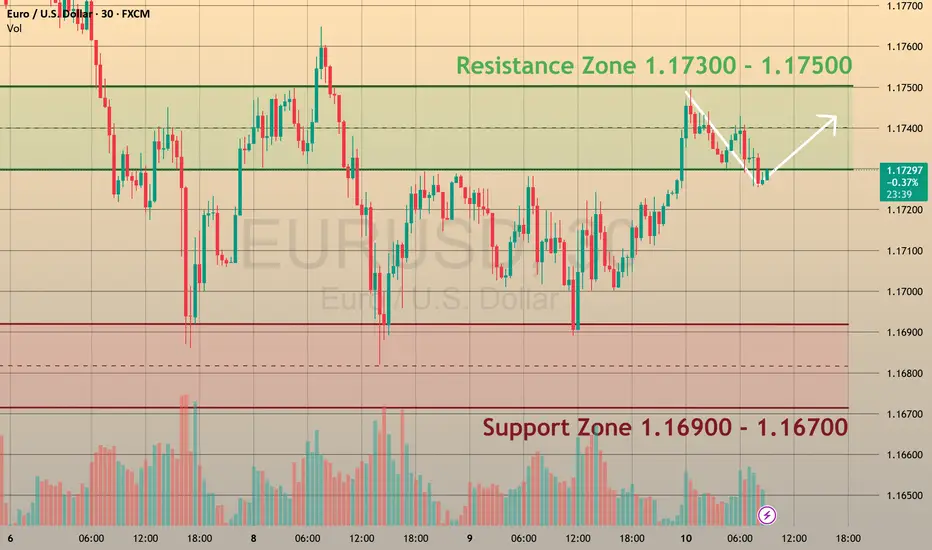
EURUSD Will Go Lower! Short!
Please, check our technical outlook for EURUSD.
Time Frame: 30m
Current Trend: Bearish
Sentiment: Overbought (based on 7-period RSI)
Forecast: Bearish
The market is approaching a key horizontal level 1.172.
Considering the today's price action, probabilities will be high to see a movement to 1.170.
P.S
The term oversold refers to a condition where an asset has traded lower in price and has the potential for a price bounce.
Overbought refers to market scenarios where the instrument is traded considerably higher than its fair value. Overvaluation is caused by market sentiments when there is positive news.
Disclosure: I am part of Trade Nation's Influencer program and receive a monthly fee for using their TradingView charts in my analysis.
Like and subscribe and comment my ideas if you enjoy them!

Euro H4 | Multi-swing-low support at 38.2% Fibonacci retracementThe Euro (EUR/USD) is falling towards a multi-swing-low support and could potentially bounce off this level to climb higher.
Buy entry is at 1.1684 which is a multi-swing-low support that aligns with the 38.2% Fibonacci retracement.
Stop loss is at 1.1570 which is a level that lies underneath an overlap support and the 61.8% Fibonacci retracement.
Take profit is at 1.1807 which is a swing-high resistance.
High Risk Investment Warning
Trading Forex/CFDs on margin carries a high level of risk and may not be suitable for all investors. Leverage can work against you.
Stratos Markets Limited (tradu.com ):
CFDs are complex instruments and come with a high risk of losing money rapidly due to leverage. 63% of retail investor accounts lose money when trading CFDs with this provider. You should consider whether you understand how CFDs work and whether you can afford to take the high risk of losing your money.
Stratos Europe Ltd (tradu.com ):
CFDs are complex instruments and come with a high risk of losing money rapidly due to leverage. 63% of retail investor accounts lose money when trading CFDs with this provider. You should consider whether you understand how CFDs work and whether you can afford to take the high risk of losing your money.
Stratos Global LLC (tradu.com ):
Losses can exceed deposits.
Please be advised that the information presented on TradingView is provided to Tradu (‘Company’, ‘we’) by a third-party provider (‘TFA Global Pte Ltd’). Please be reminded that you are solely responsible for the trading decisions on your account. There is a very high degree of risk involved in trading. Any information and/or content is intended entirely for research, educational and informational purposes only and does not constitute investment or consultation advice or investment strategy. The information is not tailored to the investment needs of any specific person and therefore does not involve a consideration of any of the investment objectives, financial situation or needs of any viewer that may receive it. Kindly also note that past performance is not a reliable indicator of future results. Actual results may differ materially from those anticipated in forward-looking or past performance statements. We assume no liability as to the accuracy or completeness of any of the information and/or content provided herein and the Company cannot be held responsible for any omission, mistake nor for any loss or damage including without limitation to any loss of profit which may arise from reliance on any information supplied by TFA Global Pte Ltd.
The speaker(s) is neither an employee, agent nor representative of Tradu and is therefore acting independently. The opinions given are their own, constitute general market commentary, and do not constitute the opinion or advice of Tradu or any form of personal or investment advice. Tradu neither endorses nor guarantees offerings of third-party speakers, nor is Tradu responsible for the content, veracity or opinions of third-party speakers, presenters or participants.

EURUSD Reaches Monthly Overbought RSI Last Seen in 2020Unlike the DXY, EURUSD has broken above the upper boundary of its 17-year descending channel. However, further upside may be capped as the DXY retests its 17-year support and monthly RSI retests 2020 overbought levels.
A clean break and hold above 1.1830 could open the path toward 1.20 and 1.24. On the downside, if the pair pulls back below 1.17, support levels at 1.14, 1.12, and 1.10 may come into play — aligning with the former channel resistance, now acting as support.
- Razan Hilal, CMT
