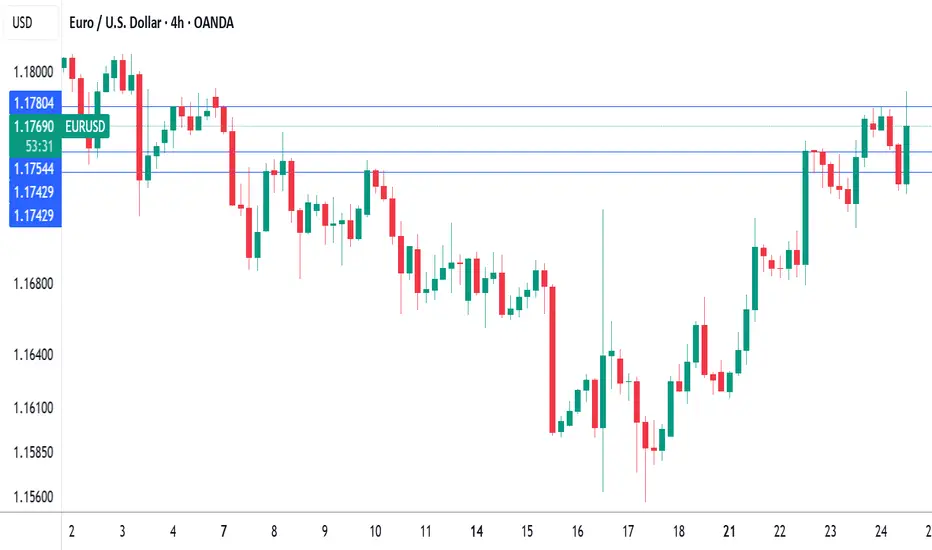
ECB holds rates as expected, Euro steadyThe euro is showing limited movement on Thursday. In the North American session, EUR/USD is trading at 1.1763, down 0.03% on the day. Earlier, the euro climbed to a high of 1.1788, its highest level since July 7.
The European Central Bank's decision to maintain the key deposit rate at 2.0% was significant but not a surprise. With the hold, the ECB ended a streak of lowering rates at seven consecutive meetings. The ECB has been aggressive, chopping 250 basis points in just over a year.
The ECB statement said that inflation was falling in line with the Bank's forecasts and that future rate decisions would be data dependent. President Lagarde has said that the easing cycle is almost down, but the markets are expecting at least one more rate cut before the end of the year.
The European Union and the United States are locked in negotiations over tariffs, with hopes that an agreement can be reached, on the heels of the US-Japan deal earlier this week. US President Trump has threatened to hit the EU with 30% tariffs if a deal is not made by August 1, but there are signals that the sides will agree to 15% tariffs on European imports, as was the case in the US-Japan agreement.
If an agreement is reached, it will greatly reduce the uncertainty around tariffs and will make it easier for the ECB to lower rates and make more accurate forecasts for inflation and growth.
In the US, Services PMI rose to 55.2 in July, up from 52.9 in June and above the market estimate of 53.0. This pointed to strong expansion and marked the fastest pace of growth in seven months. Manufacturing headed the opposite direction, falling from 52.6 in June, a 37-month high, to 49.5. This was the first contraction since December, with new orders and employment falling.
Eurusd-4
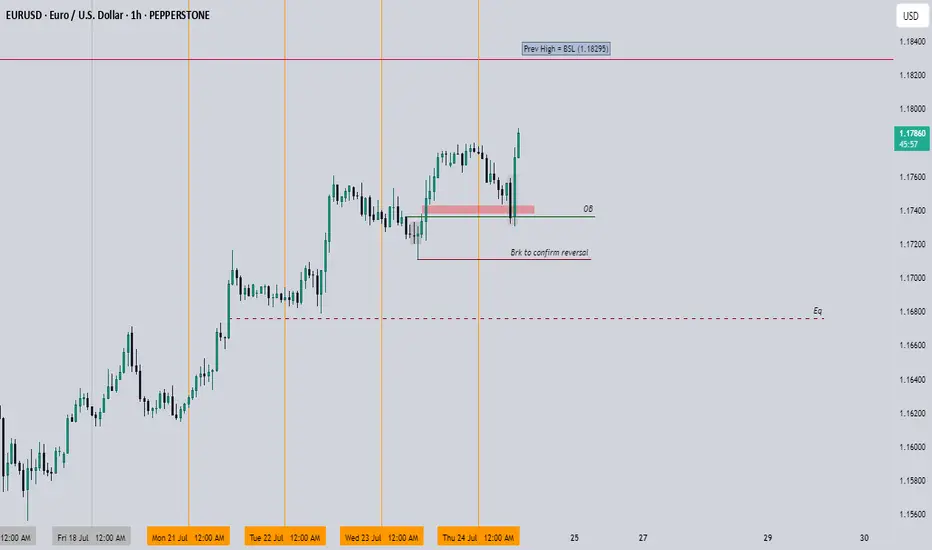
EURUSD Looking bullish in all areasI think now it is safe to say we know where EURUSD is heading to, I am looking for a sweep above the 1.18295 level
Trade Cautiously
EURUSD: Next Move Is Down! Short!
My dear friends,
Today we will analyse EURUSD together☺️
The price is near a wide key level
and the pair is approaching a significant decision level of 1.17658 Therefore, a strong bearish reaction here could determine the next move down.We will watch for a confirmation candle, and then target the next key level of 1.17506..Recommend Stop-loss is beyond the current level.
❤️Sending you lots of Love and Hugs❤️

Fiber (EU) This is my Analysis for the Eurousd, Fiber has been in down trend for years now and comparing the US Central bank interest rates with the European Central bank it shows that the Dollar is Stronger compared to the Euro, Blending the Fundamentals with Technical Analysis.

EURUSD | Symmetrical Wedge Breakdown
TF: 15m |
🎯 Setup Insight:
The market doesn’t move in straight lines — it coils.
What you're seeing is an ABCDE corrective wedge, playing out its final phase.
Wave E completed, and liquidity is built right above.
We expect a trap in the purple premium zone (1.1740–1.1757) — then a drop toward 1.1695.
---
🧠 Strategy:
Sell Zone: 1.17410 – 1.17574
Target: 1.16958
Invalidation Above: 1.17600
Wedge ✅
Liquidity ✅
Confluence ✅
Only one move left — the snap.
---
🗝️ Notes:
The market may spike into the OB zone to trap late buyers before the real move unfolds.
The mini-diagram on the right explains it all: "Trap them high, exit them low.✓

EURUSD Is Bullish! Long!
Take a look at our analysis for EURUSD.
Time Frame: 9h
Current Trend: Bullish
Sentiment: Oversold (based on 7-period RSI)
Forecast: Bullish
The price is testing a key support 1.173.
Current market trend & oversold RSI makes me think that buyers will push the price. I will anticipate a bullish movement at least to 1.184 level.
P.S
Overbought describes a period of time where there has been a significant and consistent upward move in price over a period of time without much pullback.
Disclosure: I am part of Trade Nation's Influencer program and receive a monthly fee for using their TradingView charts in my analysis.
Like and subscribe and comment my ideas if you enjoy them!

EURUSD HOLDS BULLISH MOMENTUMEURUSD HOLDS BULLISH MOMENTUM📈
24 July I wrote about bearish divergence in EURUSD. Now we see that this resulted into decline towards sma200 on 30-m chart. Currently the price is rebounding from this moving average.
What is the sma200?
The sma200 is a technical indicator that calculates the average closing price of a forex pair or crypto over the past 200 trading periods. It’s used to identify long-term trends, smooth out short-term price fluctuations, and determine potential support or resistance levels.
There is high possibility that the price will continue its way towards local resistance of 1.18300.

Fundamental Market Analysis for July 25, 2025 EURUSDThe euro remains under pressure as the bond yield gap is once again widening in favor of the dollar following comments from Fed Chair Powell about the need to “keep policy tight for longer” to counteract the inflationary effects of new US tariffs. Additional support for the dollar came from the increase in June retail sales and a decline in jobless claims, which confirms the resilience of the US economy and pushes expectations for the first rate cut toward the year-end.
From the European side, euro support is undermined by signs of slowing activity: the GfK consumer confidence index in Germany remains below its historical average, and preliminary July eurozone PMIs, despite some improvement, still indicate an uneven recovery of the real sector. Further pressure comes from ongoing uncertainty around EU–US trade talks; Washington is still discussing the possibility of 15% tariffs, which threatens the bloc’s export prospects and fuels demand for the safe-haven dollar.
With monetary policy divergence and tariff escalation risks persisting, the pair is likely to continue correcting toward 1.17. Investors are awaiting tomorrow’s US PCE data, which could reinforce expectations of the Fed maintaining a “hawkish” stance and cement the downward trend.
Trade recommendation: SELL 1.17350, SL 1.17550, TP 1.16350

EURUSD I Bullish Bounce Off Based on the H4 chart analysis, the price is falling toward our buy entry level at 1.1699, a pullback support that aligns with the 38.2% Fib retracement.
Our take profit is set at 1.1745, a pullback resistance.
The stop loss is placed at 1.1638, below the 61.8% Fib retracement.
High Risk Investment Warning
Trading Forex/CFDs on margin carries a high level of risk and may not be suitable for all investors. Leverage can work against you.
Stratos Markets Limited (tradu.com ):
CFDs are complex instruments and come with a high risk of losing money rapidly due to leverage. 63% of retail investor accounts lose money when trading CFDs with this provider. You should consider whether you understand how CFDs work and whether you can afford to take the high risk of losing your money.
Stratos Europe Ltd (tradu.com ):
CFDs are complex instruments and come with a high risk of losing money rapidly due to leverage. 63% of retail investor accounts lose money when trading CFDs with this provider. You should consider whether you understand how CFDs work and whether you can afford to take the high risk of losing your money.
Stratos Global LLC (tradu.com ):
Losses can exceed deposits.
Please be advised that the information presented on TradingView is provided to Tradu (‘Company’, ‘we’) by a third-party provider (‘TFA Global Pte Ltd’). Please be reminded that you are solely responsible for the trading decisions on your account. There is a very high degree of risk involved in trading. Any information and/or content is intended entirely for research, educational and informational purposes only and does not constitute investment or consultation advice or investment strategy. The information is not tailored to the investment needs of any specific person and therefore does not involve a consideration of any of the investment objectives, financial situation or needs of any viewer that may receive it. Kindly also note that past performance is not a reliable indicator of future results. Actual results may differ materially from those anticipated in forward-looking or past performance statements. We assume no liability as to the accuracy or completeness of any of the information and/or content provided herein and the Company cannot be held responsible for any omission, mistake nor for any loss or damage including without limitation to any loss of profit which may arise from reliance on any information supplied by TFA Global Pte Ltd.
The speaker(s) is neither an employee, agent nor representative of Tradu and is therefore acting independently. The opinions given are their own, constitute general market commentary, and do not constitute the opinion or advice of Tradu or any form of personal or investment advice. Tradu neither endorses nor guarantees offerings of third-party speakers, nor is Tradu responsible for the content, veracity or opinions of third-party speakers, presenters or participants.

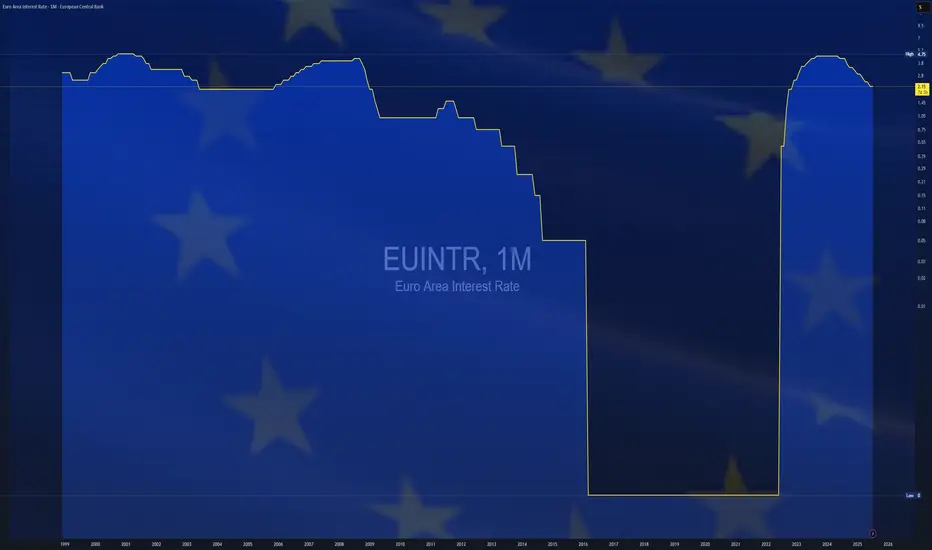
$EUINTR - Europe Interest Rates (July/2025)ECONOMICS:EUINTR
July/2025
source: European Central Bank
- The ECB kept interest rates unchanged in July, effectively marking the end of its current easing cycle after eight cuts over the past year that brought borrowing costs to their lowest levels since November 2022.
The main refinancing rate remains at 2.15%, while the deposit facility rate holds at 2.0%. Policymakers struck a wait-and-see stance, as they evaluate the impact of lingering trade uncertainty and the potential fallout from proposed US tariffs on economic growth and inflation.
Inflation hit the ECB’s 2% target in June, adding to the case for a pause in policy adjustments. Speaking at the ECB press conference, President Lagarde said the central bank is “in a good place” but acknowledged the difficulty in assessing how tariffs will affect price outlooks, given the mix of both inflationary and disinflationary pressures.
On the recent euro appreciation, Lagarde reiterated that the ECB does not target exchange rates directly but considers them when forecasting inflation.
Trading balanceTrading balance The price of the asset has rebounded from the balance zone. With the prospect of growth into the resistance zone.

EURUSD A Fall Expected! SELL!
My dear friends,
Please, find my technical outlook for EURUSD below:
The instrument tests an important psychological level 1.1751
Bias - Bearish
Technical Indicators: Supper Trend gives a precise Bearish signal, while Pivot Point HL predicts price changes and potential reversals in the market.
Target - 1.1708
About Used Indicators:
Super-trend indicator is more useful in trending markets where there are clear uptrends and downtrends in price.
Disclosure: I am part of Trade Nation's Influencer program and receive a monthly fee for using their TradingView charts in my analysis.
———————————
WISH YOU ALL LUCK

ECB Interest Rate Decision: What to Expect and How Could React📊 ECB Interest Rate Decision: What to Expect and How EURUSD Could React
This week’s spotlight is on the European Central Bank (ECB) Interest Rate Decision — a key market driver that could shape the near-term direction of the euro and broader European markets. Here's what to expect. 👇
🔔 Key Event to Watch
📅 ECB Interest Rate Decision
🕐 Date: July 24
⏰ Time: 12:15 p.m. UTC
📉 Forecast: Hold at 2.15%
📌 Economic Context
The European Central Bank is expected to hold interest rates steady on Thursday, likely marking the end of its current easing cycle after eight consecutive cuts that brought borrowing costs to their lowest levels since November 2022.
🔒 Main refinancing rate: 2.15%
💰 Deposit facility rate: 2.00%
Policymakers are likely to adopt a wait-and-see approach as they monitor the impact of persistent trade uncertaintyand potential U.S. tariffs on economic growth and inflation.
Adding to the cautious stance, inflation finally reached the ECB’s 2% target in June, and is now forecast to dip belowthat level later this year. This drop is expected to be sustained over the next 18 months, driven by:
A strong euro 💶
Falling energy prices 🛢️
Cheaper imports from China 🇨🇳
Markets are currently pricing in just one more rate cut by December, with around a 50% probability of that happening in September, before a possible tightening cycle resumes in late 2026.
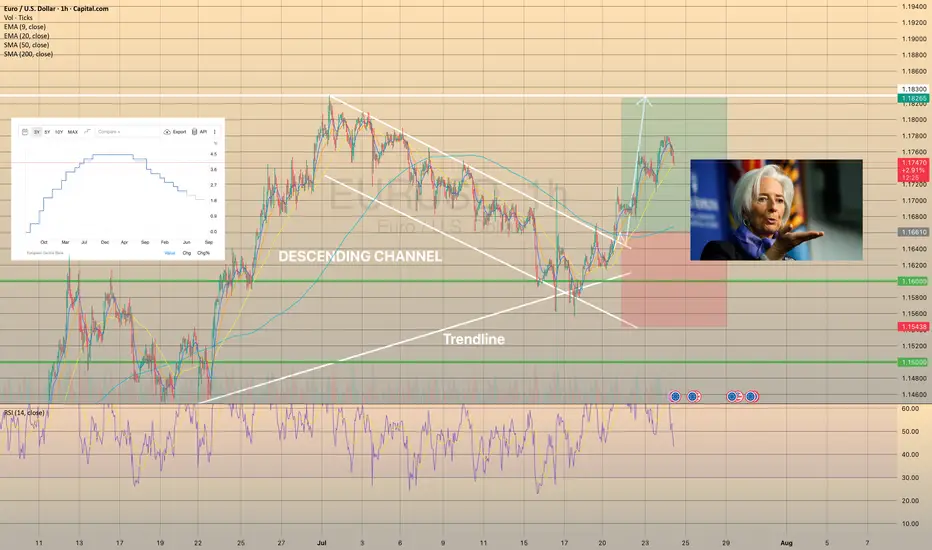
📈 EURUSD Technical Outlook
EURUSD has been trading within a descending channel since early July. However, it recently rebounded from trendline support, backed by bullish RSI divergence. The pair is approaching a breakout above the 1-hour SMA200, signaling a potential continuation of the uptrend. 🔼
A minor pullback is possible before a stronger move
Bullish momentum may continue if resistance is cleared
🎯 Target range: 1.18250 – 1.18300
🧩 Summary
The ECB is likely to keep rates unchanged at 2.15%, adopting a cautious tone amid easing inflation and global trade risks. This outcome could support the euro, particularly if U.S. rate expectations soften.
With technical indicators aligning with fundamental stability, EURUSD may be setting up for a bullish continuationin the coming sessions. 📊💶
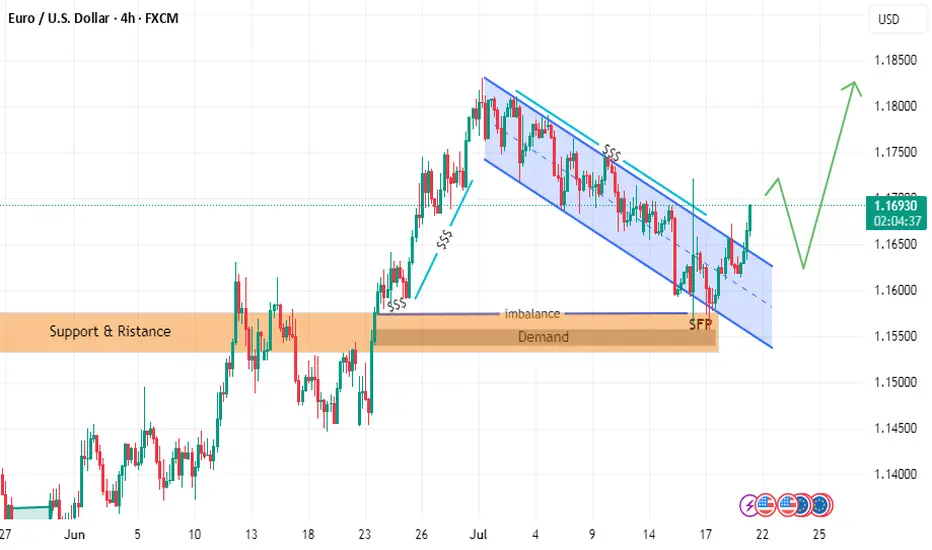
follow EURUSD LION & PLANE BUY SETUPTHE PRICE has moved as I explained in the last two posts
but we have some update to go along the way
the price could break failing channel
and withdrawal liquidity and filled imbalance
hence reflect from demand zone with zero reflection as i explained in last post with rock and plane
and it will go up to take liquidity in failing channel or downtrend
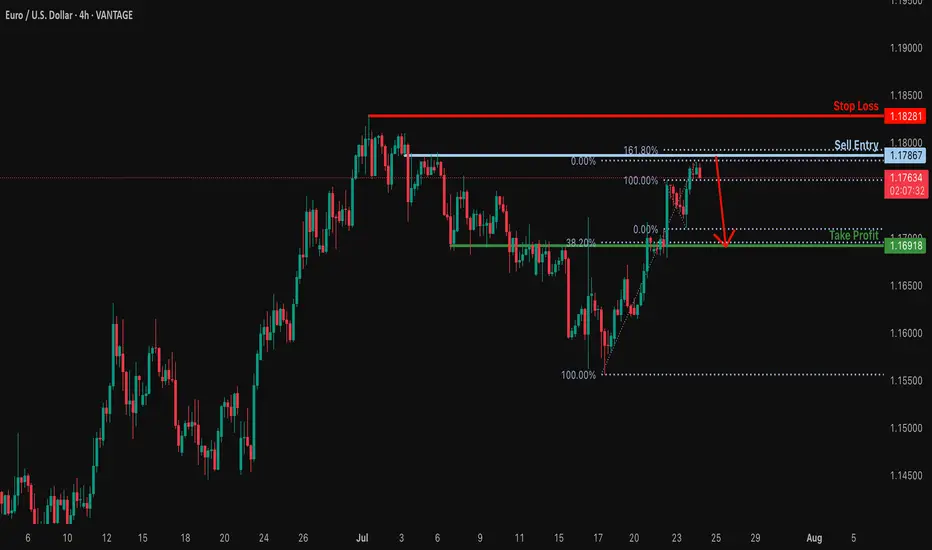
Bearish reversal off 161.8% Fibonacci resistance?EUR/USD is rising towards the resistance level which is a pullback resitance that lines up with the 161.8% Fibonacci rretracement and could drop from this level to our take profit.
Entry: 1.1786
Why we like it:
There is a pullback resistance level that lines up with the 161.8% Fibonacci extension.
Stop loss: 1.1828
Why we like it:
There is a swing high resistance.
Take profit: 1.1691
Why we like it:
There is an overlap support that aligns with the 38.2% Fibonacci retracement.
Enjoying your TradingView experience? Review us!
Please be advised that the information presented on TradingView is provided to Vantage (‘Vantage Global Limited’, ‘we’) by a third-party provider (‘Everest Fortune Group’). Please be reminded that you are solely responsible for the trading decisions on your account. There is a very high degree of risk involved in trading. Any information and/or content is intended entirely for research, educational and informational purposes only and does not constitute investment or consultation advice or investment strategy. The information is not tailored to the investment needs of any specific person and therefore does not involve a consideration of any of the investment objectives, financial situation or needs of any viewer that may receive it. Kindly also note that past performance is not a reliable indicator of future results. Actual results may differ materially from those anticipated in forward-looking or past performance statements. We assume no liability as to the accuracy or completeness of any of the information and/or content provided herein and the Company cannot be held responsible for any omission, mistake nor for any loss or damage including without limitation to any loss of profit which may arise from reliance on any information supplied by Everest Fortune Group.
EURUSD | 4H Chart | New York Session Sellers in Play 📉 EURUSD | 4H Chart | New York Session Sellers in Play 🇺🇸
🟥 Red Zone Rejection – clarity
As the New York session unfolds, sellers are stepping in at a premium supply zone — classic reaction near 1.1763–1.1812.
🔻 Current Structure:
Rising wedge formation tapped into prior supply zone
Price kissed the upper wedge and reacted — sellers triggering from the red zone
NY session = high liquidity = aggressive positioning by institutions
🎯 Potential Bearish Targets:
1️⃣ 1.1712 – Minor structure support
2️⃣ 1.1670 – Trendline + liquidity sweep
3️⃣ 1.1582 – Major bullish invalidation (optional swing target)
🧠 Smart Money Note:
This is where liquidity is grabbed before reversal
Risk-to-reward favors downside short-term as long as price stays below 1.1812
📌 Bias: Tactical Short
🎯 Reaction + Rejection = Execution
🎩

EURUSD – Bulls Still in Control, Trend ResumesIn my previous EURUSD analysis, I pointed out that the pair was nearing an important confluence support around 1.1620, and that – given the overall bullish trend – this zone could offer solid long opportunities.
What followed?
The market briefly dipped below that zone, even challenging the psychological 1.1600 round number. But instead of breaking down, bulls regrouped, stepped in with force, and pushed the pair aggressively higher.
📍 At the time of writing, EURUSD is trading at 1.1770, and my long trade is running with a comfortable 150 pips profit.
🔍 W hat’s Next?
The current structure suggests a continuation of the uptrend, and the logical technical target is the recent high at 1.1830.
Until proven otherwise, this is still a buy-the-dip market.
✅ Buying around 1.1700 could be a valid setup, especially if we see buying power on the intraday chart
⚠️ The Warning Sign
Despite the bullish bias, keep in mind:
If EURUSD drops and closes below 1.1670, the structure begins to shift — and this could signal a deeper correction or even trend reversal.
📌 Until then, the bias remains bullish, dips are to be watched for entries, and 1.1830 is the next checkpoint.
D isclosure: I am part of TradeNation's Influencer program and receive a monthly fee for using their TradingView charts in my analyses and educational articles.

EUR/USD Lots of bull flags formed on the recent chart. Buy/Long Lots of bull flags on this chart which confirmed a move to the upside.
Waiting for a little pullback to the 20MA before considering a buy long order
Waiting to see if this small bear flag forms.
A very interesting instrument to watch at the moment. Full of various signals.

What's Next On EURUSDPrice currently leans toward a bearish pullback after a series of impulsive bullish moves. So far, we haven’t seen any significant retracement since the rally began. As we anticipate a potential correction, could this be the awaited moment for the bears to step in—especially with only weaker structures left behind and bearish pressure building?
Regardless, every market scenario demands discipline and proper risk management.
Thinking of taking this outlook? Be sure to wait for strong confirmation before jumping in.
Good luck, traders, as we watch price unfold.
👉 Follow for more updates. See you in the next one 😉.

EURUSD H4 I Bearish Reversal Based on the H4 chart analysis, we can see that the price is rising toward our sell entry at 1.1787, which is a pullback resistance aligning close to the 161.8% Fibo extension.
Our take profit will be at 1.1750, a pullback support level.
The stop loss will be placed at 1.1829, a swing-high resistance level.
High Risk Investment Warning
Trading Forex/CFDs on margin carries a high level of risk and may not be suitable for all investors. Leverage can work against you.
Stratos Markets Limited (tradu.com ):
CFDs are complex instruments and come with a high risk of losing money rapidly due to leverage. 63% of retail investor accounts lose money when trading CFDs with this provider. You should consider whether you understand how CFDs work and whether you can afford to take the high risk of losing your money.
Stratos Europe Ltd (tradu.com ):
CFDs are complex instruments and come with a high risk of losing money rapidly due to leverage. 63% of retail investor accounts lose money when trading CFDs with this provider. You should consider whether you understand how CFDs work and whether you can afford to take the high risk of losing your money.
Stratos Global LLC (tradu.com ):
Losses can exceed deposits.
Please be advised that the information presented on TradingView is provided to Tradu (‘Company’, ‘we’) by a third-party provider (‘TFA Global Pte Ltd’). Please be reminded that you are solely responsible for the trading decisions on your account. There is a very high degree of risk involved in trading. Any information and/or content is intended entirely for research, educational and informational purposes only and does not constitute investment or consultation advice or investment strategy. The information is not tailored to the investment needs of any specific person and therefore does not involve a consideration of any of the investment objectives, financial situation or needs of any viewer that may receive it. Kindly also note that past performance is not a reliable indicator of future results. Actual results may differ materially from those anticipated in forward-looking or past performance statements. We assume no liability as to the accuracy or completeness of any of the information and/or content provided herein and the Company cannot be held responsible for any omission, mistake nor for any loss or damage including without limitation to any loss of profit which may arise from reliance on any information supplied by TFA Global Pte Ltd.
The speaker(s) is neither an employee, agent nor representative of Tradu and is therefore acting independently. The opinions given are their own, constitute general market commentary, and do not constitute the opinion or advice of Tradu or any form of personal or investment advice. Tradu neither endorses nor guarantees offerings of third-party speakers, nor is Tradu responsible for the content, veracity or opinions of third-party speakers, presenters or participants.

EURUSD – Recovery losing steam, correction risk is risingAfter rebounding from the trendline support, EURUSD is now approaching the key resistance area around 1.17500 — a zone that has historically triggered multiple rejections. However, with French and German PMI figures coming in below expectations and the ECB holding rates steady without providing any fresh policy guidance, the euro lacks the momentum for a sustained move higher.
On the H4 chart, price action is showing signs of exhaustion as it tests resistance. If buyers fail to break through convincingly, a pullback toward the 1.16800 support zone — or even deeper toward 1.16400 — becomes increasingly likely.
Preferred strategy: Watch for bearish rejection patterns near 1.17500. If confirmed, this could be a favorable opportunity to initiate short positions in anticipation of a correction.

EURUSD Analysis - Can Buyers Push Price To $1.18000?Hello all dear traders!
EURUSD is trading within a clear bullish channel, with price action consistently respecting both the upper and lower boundaries. The recent bullish momentum shows that buyers are in control, suggesting further upside.
The price recently broke above a key resistance zone and is now coming back to retest it. If this level holds as support, it will consolidate the bullish structure and increase the likelihood of a move towards the 1.18000 target, which is in line with the upper boundary of the channel.
As long as the price remains above this support zone, the bullish outlook remains intact. However, a failure to hold this level could invalidate the bullish scenario and increase the likelihood of a deeper pullback.
Remember, always validate your setups and use appropriate risk management.

EUR/USD: The Last Bear Standing...As indicated on my previous EUR/USD idea ( that's still currently open ), I remain short EUR/USD given the technical aspect of things are still valid.
Divergences are still in play along with a rising broadening pattern and the fact that we're trading at the yearly R3 level ( which is rare ).
I suspect we will have some volatility with the ECB press conference tomorrow, so that should get things moving hopefully in the bearish direction. If we begin trading aggressively above 1.1800+, that will invalidate the short idea overall.
If we roll over, I'm still looking for 1.13000 - 1.12000 as the target range for Q3 going into Q4.
We'll see how this all develops.
As always, Good Luck & Trade Safe!
