XAU/USD | Get Ready for Another Bullrun, $3500 is Coming!By analyzing the gold chart on the 4-hour timeframe, we can see that on Friday, the price finally closed at $3350. After the market opened today, we saw an initial correction down to $3339 (exactly as expected), followed by another strong bullish wave, pushing gold above $3400 just moments ago. If the price stabilizes below $3398 within the next 4 hours, I expect a potential rejection toward $3388 and $3377. However, if gold holds above $3400, the next target will be $3409. Key demand zones are $3365–$3375, and levels $3355, $3344, and $3336.
Please support me with your likes and comments to motivate me to share more analysis with you and share your opinion about the possible trend of this chart with me !
Best Regards , Arman Shaban
Eurusd-4

EURUSD Will Collapse! SELL!
My dear subscribers,
This is my opinion on the EURUSD next move:
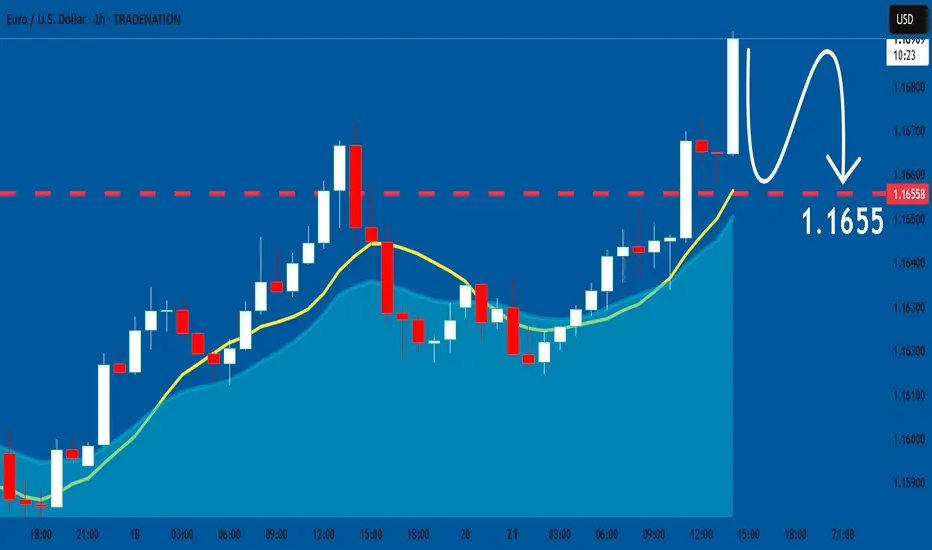
The instrument tests an important psychological level 1.1696
Bias - Bearish
Technical Indicators: Supper Trend gives a precise Bearish signal, while Pivot Point HL predicts price changes and potential reversals in the market.
Target - 1.1651
About Used Indicators:
On the subsequent day, trading above the pivot point is thought to indicate ongoing bullish sentiment, while trading below the pivot point indicates bearish sentiment.
Disclosure: I am part of Trade Nation's Influencer program and receive a monthly fee for using their TradingView charts in my analysis.
———————————
WISH YOU ALL LUCK

EURUSD: Bears Are Winning! Short!
My dear friends,
Today we will analyse EURUSD together☺️
The market is at an inflection zone and price has now reached an area around 1.17083 where previous reversals or breakouts have occurred.And a price reaction that we are seeing on multiple timeframes here could signal the next move down so we can enter on confirmation, and target the next key level of 1.17004..Stop-loss is recommended beyond the inflection zone.
❤️Sending you lots of Love and Hugs❤️

EURUSD bullish breakout supported at 1.1640The EURUSD currency pair continues to exhibit a bullish price action bias, supported by a sustained rising trend. Recent intraday movement reflects a sideways consolidation breakout, suggesting potential continuation of the broader uptrend.
Key Technical Level: 1.1640
This level marks the prior consolidation range and now acts as pivotal support. A corrective pullback toward 1.1640 followed by a bullish rejection would reinforce the bullish trend, targeting the next resistance levels at:
1.1830 – Near-term resistance
1.1900 – Minor swing high
1.1940 – Longer-term bullish objective
On the other hand, a decisive daily close below 1.1640 would invalidate the bullish setup, shifting the outlook to bearish in the short term. This could trigger a deeper retracement toward:
1.1590 – Initial support
1.1530 – Key downside target
Conclusion:
As long as 1.1640 holds as support, the technical outlook remains bullish, favoring long positions on dips. A confirmed break below this level would signal a shift in sentiment and open the door to a corrective pullback phase.
This communication is for informational purposes only and should not be viewed as any form of recommendation as to a particular course of action or as investment advice. It is not intended as an offer or solicitation for the purchase or sale of any financial instrument or as an official confirmation of any transaction. Opinions, estimates and assumptions expressed herein are made as of the date of this communication and are subject to change without notice. This communication has been prepared based upon information, including market prices, data and other information, believed to be reliable; however, Trade Nation does not warrant its completeness or accuracy. All market prices and market data contained in or attached to this communication are indicative and subject to change without notice.

The EUR & the USD. Events that can affect the move this weekThis week we are monitoring EUR and USD carefully, as we could see some interesting moves, due to some events on the economic calendar. Let's dig in.
FX_IDC:EURUSD
MARKETSCOM:EURUSD
TVC:DXY
MARKETSCOM:DOLLARINDEX
Let us know what you think in the comments below.
Thank you.
75.2% of retail investor accounts lose money when trading CFDs with this provider. You should consider whether you understand how CFDs work and whether you can afford to take the high risk of losing your money. Past performance is not necessarily indicative of future results. The value of investments may fall as well as rise and the investor may not get back the amount initially invested. This content is not intended for nor applicable to residents of the UK. Cryptocurrency CFDs and spread bets are restricted in the UK for all retail clients.

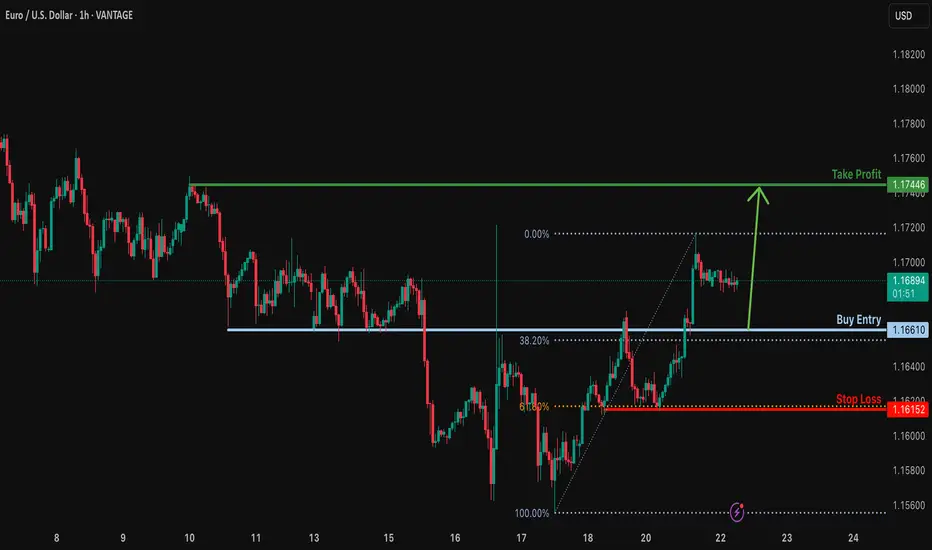
Bullish bounce off overlap support?EUR/USD is falling towards the support level which is an overlap support that aligns with the 38.2% Fibonacci retracement and could bounce from this level to our take profit.
Entry: 1.1661
Why we like it:
There is an overlap support that lines up with the 38.2% Fibonacci retracement.
Stop loss: 1.1615
Why we like it:
There is a pullback support that aligns with the 61.8% Fibonacci retracement.
Take profit: 1.1744
Why we like it:
There is a pullback resistance.
Enjoying your TradingView experience? Review us!
Please be advised that the information presented on TradingView is provided to Vantage (‘Vantage Global Limited’, ‘we’) by a third-party provider (‘Everest Fortune Group’). Please be reminded that you are solely responsible for the trading decisions on your account. There is a very high degree of risk involved in trading. Any information and/or content is intended entirely for research, educational and informational purposes only and does not constitute investment or consultation advice or investment strategy. The information is not tailored to the investment needs of any specific person and therefore does not involve a consideration of any of the investment objectives, financial situation or needs of any viewer that may receive it. Kindly also note that past performance is not a reliable indicator of future results. Actual results may differ materially from those anticipated in forward-looking or past performance statements. We assume no liability as to the accuracy or completeness of any of the information and/or content provided herein and the Company cannot be held responsible for any omission, mistake nor for any loss or damage including without limitation to any loss of profit which may arise from reliance on any information supplied by Everest Fortune Group.
Fundamental Market Analysis for July 22, 2025 EURUSDThe euro is trading near 1.1700, having retreated from an intraday high of 1.1720 after the release of the final June U.S. CPI figures, which confirmed a slowdown in inflation to 2.7% y/y and 0.1% m/m while keeping the core reading steady at 3.1%. The brief rise in risk appetite quickly gave way to stronger demand for the dollar as the probability of the Fed’s first rate cut in September fell from 65% to 55%.
Additional pressure on the euro comes from the yield differential: 10-year U.S. Treasuries hover around 4.45%, while German Bunds yield only 2.30%. The gap of more than 215 bp encourages capital to flow from the eurozone into dollar assets, supporting USD demand.
Fundamentally, risks for the euro remain tilted to the downside: after June’s rate cut the ECB said further moves depend on price dynamics, and the eurozone composite PMI dropped to 50.1 – the brink of stagnation. Against the backdrop of weak continental activity and moderate yet persistent U.S. inflation, the pair may test support at 1.1615 in the coming sessions, especially if U.S. durable-goods orders exceed forecasts.
Trading recommendation: SELL 1.1700, SL 1.1720, TP 1.1615

EURUSD H1 I Bullish Bounce Off Based on the H1 chart analysis, the price is falling toward our buy entry level at 1.1667 a pullback support that aligns with the 50% Fib retracement.
Our take profit is set at 1.1706, a swing high resistance.
The stop loss is placed at 1.1642, a pullback support.
High Risk Investment Warning
Trading Forex/CFDs on margin carries a high level of risk and may not be suitable for all investors. Leverage can work against you.
Stratos Markets Limited (tradu.com ):
CFDs are complex instruments and come with a high risk of losing money rapidly due to leverage. 66% of retail investor accounts lose money when trading CFDs with this provider. You should consider whether you understand how CFDs work and whether you can afford to take the high risk of losing your money.
Stratos Europe Ltd (tradu.com ):
CFDs are complex instruments and come with a high risk of losing money rapidly due to leverage. 66% of retail investor accounts lose money when trading CFDs with this provider. You should consider whether you understand how CFDs work and whether you can afford to take the high risk of losing your money.
Stratos Global LLC (tradu.com ):
Losses can exceed deposits.
Please be advised that the information presented on TradingView is provided to Tradu (‘Company’, ‘we’) by a third-party provider (‘TFA Global Pte Ltd’). Please be reminded that you are solely responsible for the trading decisions on your account. There is a very high degree of risk involved in trading. Any information and/or content is intended entirely for research, educational and informational purposes only and does not constitute investment or consultation advice or investment strategy. The information is not tailored to the investment needs of any specific person and therefore does not involve a consideration of any of the investment objectives, financial situation or needs of any viewer that may receive it. Kindly also note that past performance is not a reliable indicator of future results. Actual results may differ materially from those anticipated in forward-looking or past performance statements. We assume no liability as to the accuracy or completeness of any of the information and/or content provided herein and the Company cannot be held responsible for any omission, mistake nor for any loss or damage including without limitation to any loss of profit which may arise from reliance on any information supplied by TFA Global Pte Ltd.
The speaker(s) is neither an employee, agent nor representative of Tradu and is therefore acting independently. The opinions given are their own, constitute general market commentary, and do not constitute the opinion or advice of Tradu or any form of personal or investment advice. Tradu neither endorses nor guarantees offerings of third-party speakers, nor is Tradu responsible for the content, veracity or opinions of third-party speakers, presenters or participants.

XAUUSD H1 I Bearish Reversal Based on the H1 chart analysis, we can see that the price is testing our sell entry at 3392.84, which is a pullback resistance.
Our take profit will be at 3377.57, a pullback support level.
The stop loss will be placed at 3411.50, which is a swing high resistance level.
High Risk Investment Warning
Trading Forex/CFDs on margin carries a high level of risk and may not be suitable for all investors. Leverage can work against you.
Stratos Markets Limited (tradu.com ):
CFDs are complex instruments and come with a high risk of losing money rapidly due to leverage. 66% of retail investor accounts lose money when trading CFDs with this provider. You should consider whether you understand how CFDs work and whether you can afford to take the high risk of losing your money.
Stratos Europe Ltd (tradu.com ):
CFDs are complex instruments and come with a high risk of losing money rapidly due to leverage. 66% of retail investor accounts lose money when trading CFDs with this provider. You should consider whether you understand how CFDs work and whether you can afford to take the high risk of losing your money.
Stratos Global LLC (tradu.com ):
Losses can exceed deposits.
Please be advised that the information presented on TradingView is provided to Tradu (‘Company’, ‘we’) by a third-party provider (‘TFA Global Pte Ltd’). Please be reminded that you are solely responsible for the trading decisions on your account. There is a very high degree of risk involved in trading. Any information and/or content is intended entirely for research, educational and informational purposes only and does not constitute investment or consultation advice or investment strategy. The information is not tailored to the investment needs of any specific person and therefore does not involve a consideration of any of the investment objectives, financial situation or needs of any viewer that may receive it. Kindly also note that past performance is not a reliable indicator of future results. Actual results may differ materially from those anticipated in forward-looking or past performance statements. We assume no liability as to the accuracy or completeness of any of the information and/or content provided herein and the Company cannot be held responsible for any omission, mistake nor for any loss or damage including without limitation to any loss of profit which may arise from reliance on any information supplied by TFA Global Pte Ltd.
The speaker(s) is neither an employee, agent nor representative of Tradu and is therefore acting independently. The opinions given are their own, constitute general market commentary, and do not constitute the opinion or advice of Tradu or any form of personal or investment advice. Tradu neither endorses nor guarantees offerings of third-party speakers, nor is Tradu responsible for the content, veracity or opinions of third-party speakers, presenters or participants.

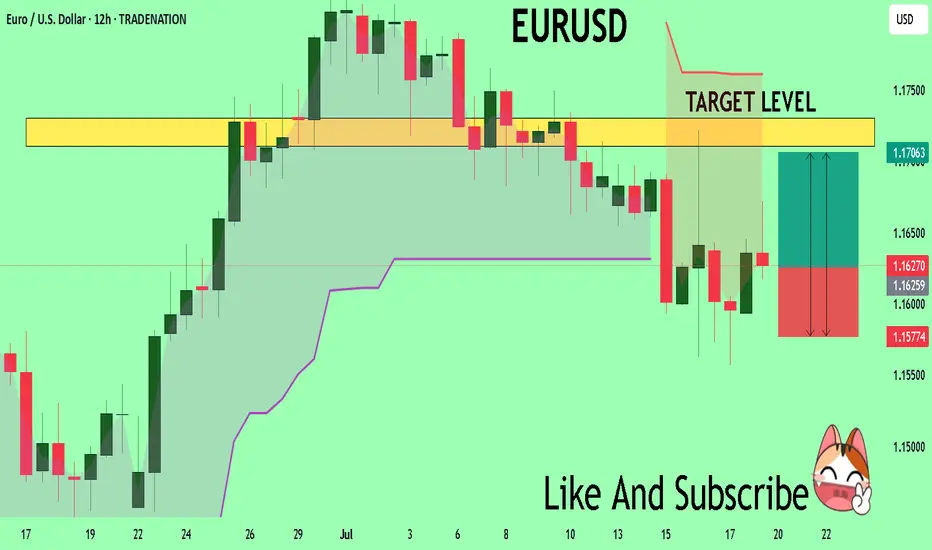
EURUSD – Is the rally over? Time for a collapse?The technical picture reveals that EURUSD is losing momentum after a brief rebound. The 1.1700 level stands as a key resistance – if bulls fail to break it, the bears will take the wheel! A clear scenario is forming: lower highs, FVGs filled, and a potential drop toward the 1.1580 support zone this week.
The bad news for the euro isn’t over: yesterday’s Eurozone PMI data disappointed heavily, signaling stagnating growth. Meanwhile, the USD is gaining traction from strong labor data and hawkish Fed remarks, putting EURUSD under double pressure.
If the ascending trendline breaks, EURUSD could plunge even further – get ready for a potential breakdown!
Suggested strategy: Prioritize SELL below 1.1700, with a short-term target at 1.1580.
Stop-loss: Above 1.1720 – a breakout here would invalidate the bearish setup.
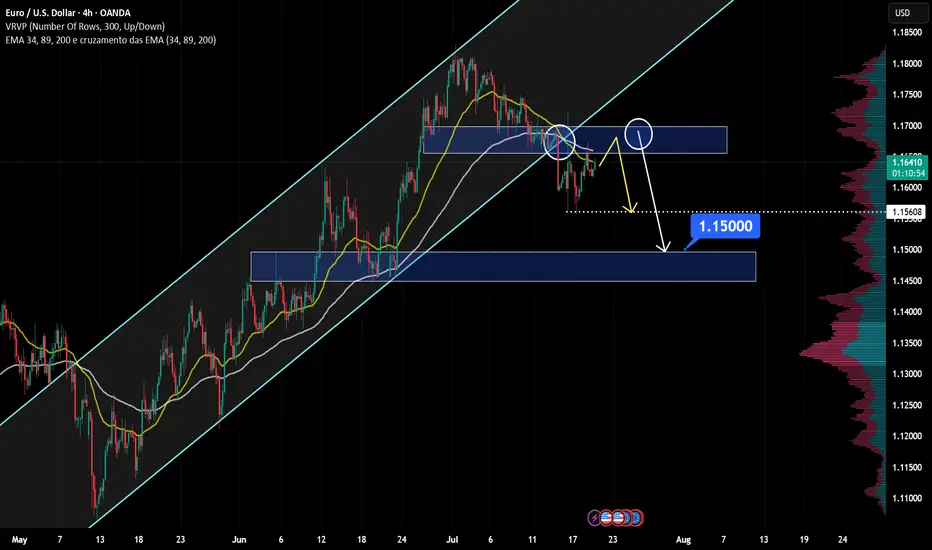
EUR/USD at Resistance – Will Sellers Push Price Down to 1.15000?Hello fellow traders! What’s your take on EUR/USD?
From Brian’s personal perspective:
This currency pair is approaching a key resistance zone, which previously acted as a strong support level. This area aligns with historical price reactions and could serve as a solid foundation for potential bearish movements.
If sellers confirm their presence through bearish price action, I anticipate the price could move toward 1.15000. However, a clear break above this resistance level may signal the possibility of further bullish continuation.
Let me know your thoughts or any additional insights you might have!
EURUSD Breaks Bullish Structure – Here’s My Trade Plan📍 Watching EURUSD closely—it's recently broken bullish (market structure) on the daily timeframe 📈.
I’m now waiting for a retrace into a fair value gap, watching for the rebalance and a possible support zone touch before the next leg up 🔄🟢.
🎥 In this idea, I walk you through:
🔍 Price action
🧱 Market structure
📊 Trend direction
📋 And my personal trade plan for this setup
Not financial advice ❌💼

EUR/USD: Bearish Trend in FocusHello everyone, what are your thoughts on EUR/USD?
From my personal analysis, it's clear that EUR/USD is extending its downtrend. The pair is trading around 1.164 and is under pressure from sellers after breaking below both the EMA 34 and EMA 89, with EMA 34 already turning downward — a classic bearish signal.
On the macro side, the European Central Bank is set to announce its monetary policy decision on Thursday. Meanwhile, U.S. President Donald Trump's ongoing trade tensions may add further uncertainty to the market. This corrective downtrend in EUR/USD could very well continue in the weeks ahead.
What do you think — will EUR/USD keep falling?
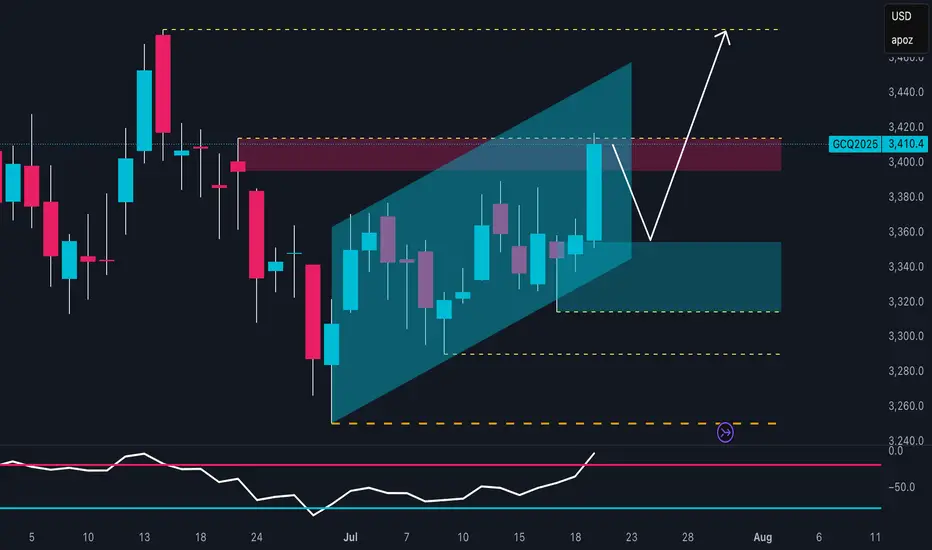
Gold Bulls Reloading? Smart Money Buys!The technical outlook on XAU/USD shows a well-defined bullish trend, developing within an ascending channel that started in late June. Price recently pushed toward the upper boundary of this channel, reaching a key resistance zone between 3,410 and 3,420 USD, which aligns with a previous supply area and significant daily structure. The reaction in this zone suggests a potential fake breakout, hinting at a short-term pullback before a continuation of the upward move.
The RSI oscillator supports this view, displaying bullish momentum with a breakout above the 60 level. However, the current slope hints at a possible minor correction before the next impulsive leg higher. The most relevant demand zone lies between 3,340 and 3,360 USD, at the base of the ascending channel—an ideal spot for buy orders to accumulate in anticipation of a move toward previous highs.
Backing this technical setup, the Commitment of Traders (COT) report as of July 15, 2025, paints a constructive picture. Non-commercial traders (institutional speculators) increased their long positions by over 8,500 contracts, while also cutting short positions by about 1,600 contracts, indicating a strong bullish bias. Commercials also increased their shorts (+16,448), a typical hedge during rallies, but not enough to invalidate the bullish structure.
From a seasonal perspective, July remains one of the historically strongest months for gold. According to MarketBulls data, over the past 2 years, gold has averaged gains of 105+ points in July, with solid returns also visible on the 5-year (+45 pts) and 10-year (+25 pts) averages. August also tends to be supportive, reinforcing the idea of a medium-term bullish extension.
Lastly, the retail sentiment is heavily skewed, with 72% of retail traders short, and only 28% long. From a contrarian standpoint, this is another strong bullish signal. When the majority of retail traders are short in a structurally bullish market, the potential for a short squeeze remains high.
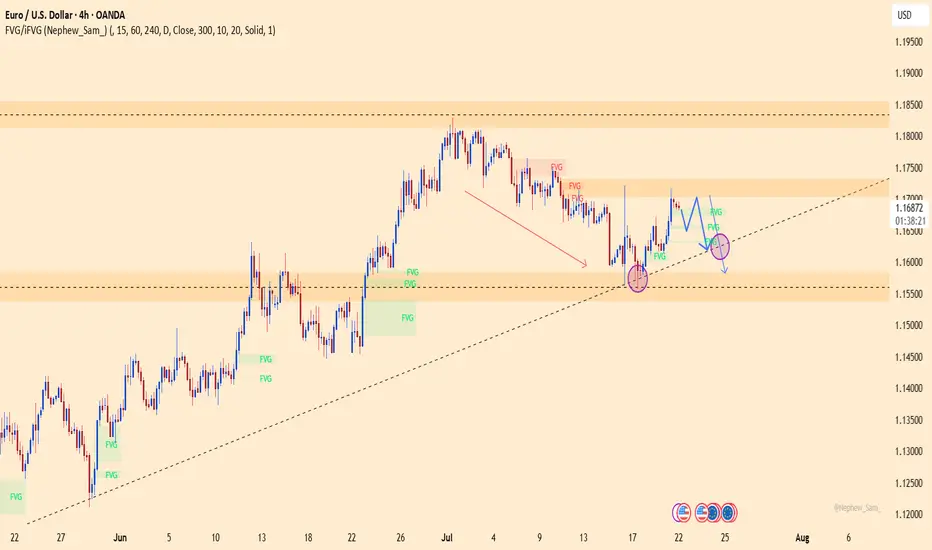
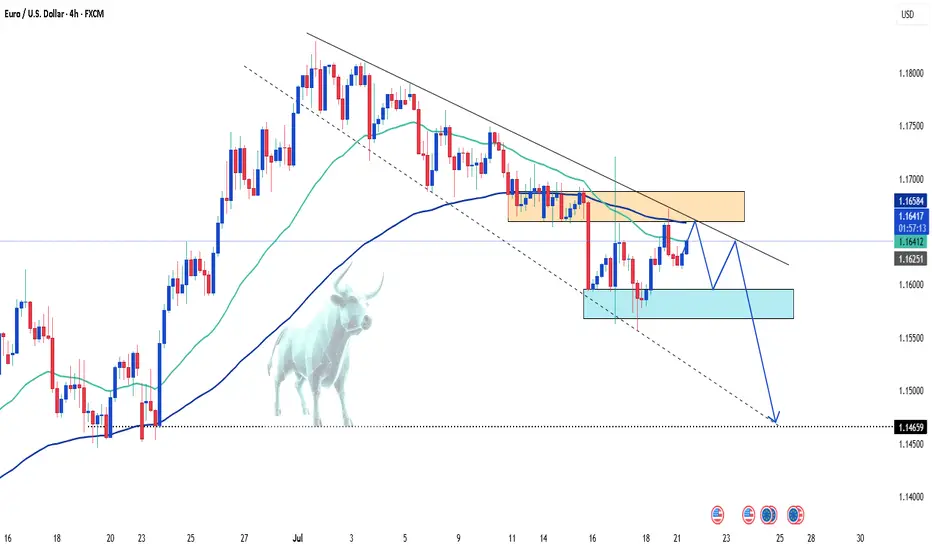
EURUSD - Parallel channel in play!The following chart offers a closer look at the current structure of the EUR/USD pair on the 4-hour timeframe. Price action has been respecting a well-defined bearish parallel channel, which has provided clear boundaries for both resistance and support. Based on the ongoing reaction to these levels, we outline both bullish and bearish scenarios that could unfold in the coming sessions.
Bearish Parallel Channel
Since June 30, EUR/USD has been consistently moving within a downward-sloping bearish parallel channel. Each attempt to break above the upper boundary of the channel has been rejected, while the lower boundary continues to act as dynamic support. This sustained rejection from the upper trendline confirms the strength of the bearish momentum currently at play. The pair remains structurally weak unless a clean breakout to the upside occurs, accompanied by strong bullish confirmation.
Bullish Scenario
A potential bullish reversal could materialize if EUR/USD manages to hold above the 4-hour Fair Value Gap (FVG) located between 1.1620 and 1.1600. This zone may provide the necessary support for the bulls to step in. If the price maintains strength within or just above this FVG and buyers begin to show dominance, a rebound toward the upper boundary of the channel could occur. A successful breakout above the channel could then trigger a stronger rally, possibly targeting the 1.1750–1.1800 region, marking a clear shift in short-term momentum.
Bearish Scenario
Conversely, if the pair fails to hold the 4-hour FVG between 1.1620 and 1.1600 and closes a strong bearish 4-hour candle below this zone, the market may be setting up for further downside. This would suggest a rejection of the FVG as resistance and open the path for a drop toward the lower end of the channel. Interestingly, this area also aligns with a previously established larger 4-hour FVG. A move into this deeper FVG could present a more favorable zone for a longer-term bullish reversal, as it offers a stronger liquidity pool and potential demand area.
Final Thoughts
The EUR/USD pair is at a critical juncture. Price is hovering near a key support zone within a bearish channel that has defined its movement for several weeks. Whether bulls can hold this support and break above the channel, or bears take control and push it lower toward the broader 4-hour FVG, will determine the next major directional move. Traders should closely monitor price action around the 1.1620–1.1600 level for clues on the likely breakout direction.
--------------------------
Disclosure: I am part of Trade Nation's Influencer program and receive a monthly fee for using their TradingView charts in my analysis.
Thanks for your support. If you enjoyed this analysis, make sure to follow me so you don't miss the next one. And if you found it helpful, feel free to drop a like and leave a comment, I’d love to hear your thoughts!

EUR/USD AccumulationOn the 5-minute timeframe, buying activity initiates, signaling the potential end of the downtrend. The first indication of upward momentum appears following the formation of a range and a subsequent liquidity sweep. Price then retests the prior low with diminished volume but fails to break below it, suggesting that selling pressure is being absorbed by buyers. This behavior reflects accumulation by informed participants positioning for a move higher. As demand begins to outweigh supply, clear signs of strength emerge
Entry: 1.15765
Take Profit: 1.16279
Stop Loss: 1.15621

EURUSD Will the 1D MA50 hold?The EURUSD pair seems to be rebounding just before a 1D MA50 (blue trend-line) test, which is its short-term Support. At the same time it bounced off the 0.382 Fibonacci retracement level, which after a +6.92% rise, it resembles the March 27 rebound.
The 1D RSI is printing a standard bullish reversal setup, seen already 4 times since February, and a break above its MA will confirm it.
As long as the 1D MA50 holds, it may extend the uptrend to a new Channel Up (dashed), outside the blue one that may look for a new +6.92% rise. In that case our Target will be 1.21000.
If the 1D MA50 breaks, we will add one last buy at 1.14000, near the 1D MA100 (green trend-line).
-------------------------------------------------------------------------------
** Please LIKE 👍, FOLLOW ✅, SHARE 🙌 and COMMENT ✍ if you enjoy this idea! Also share your ideas and charts in the comments section below! This is best way to keep it relevant, support us, keep the content here free and allow the idea to reach as many people as possible. **
-------------------------------------------------------------------------------
Disclosure: I am part of Trade Nation's Influencer program and receive a monthly fee for using their TradingView charts in my analysis.
💸💸💸💸💸💸
👇 👇 👇 👇 👇 👇

EURUSD: Target Is Up! Long!
My dear friends,
Today we will analyse EURUSD together☺️
The recent price action suggests a shift in mid-term momentum. A break above the current local range around 1.16915 will confirm the new direction upwards with the target being the next key level of 1.17187 and a reconvened placement of a stop-loss beyond the range.
❤️Sending you lots of Love and Hugs❤️

EURUSD Massive Long! BUY!
My dear friends,
Please, find my technical outlook for EURUSD below:
The price is coiling around a solid key level - 1.1627
Bias - Bullish
Technical Indicators: Pivot Points Low anticipates a potential price reversal.
Super trend shows a clear buy, giving a perfect indicators' convergence.
Goal - 1.1710
Safe Stop Loss - 1.1577
About Used Indicators:
The pivot point itself is simply the average of the high, low and closing prices from the previous trading day.
Disclosure: I am part of Trade Nation's Influencer program and receive a monthly fee for using their TradingView charts in my analysis.
———————————
WISH YOU ALL LUCK
EURUSD Bullish ProjectionIt’s been a while since my last update here.
Here’s my projection and actual entry/entries on EURUSD, based on a sweep of the previous 1H swing low and mitigation of a Daily imbalance (Fair Value Gap).
We're anticipating a full Change of Character to mark the end of the ongoing Daily pullback.

EURUSD: Expecting Bearish Movement! Here is Why:
Balance of buyers and sellers on the EURUSD pair, that is best felt when all the timeframes are analyzed properly is shifting in favor of the sellers, therefore is it only natural that we go short on the pair.
Disclosure: I am part of Trade Nation's Influencer program and receive a monthly fee for using their TradingView charts in my analysis.
❤️ Please, support our work with like & comment! ❤️
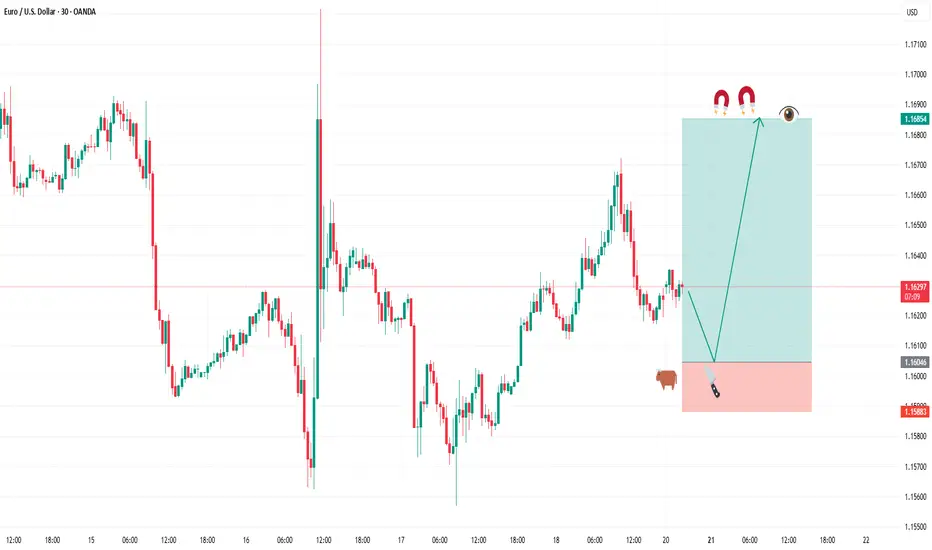
BUY FIBERGreetings traders, today we are looking for buys on EURUSD. Our first entry is at 1.16288 and second entry will be lower at 1.16046 our target is 1.16854 and stops are below 1.15883. use proper risk management and best of luck.
This trade is based on a fine tuned DAILY approach to the algo. Be careful and risk wisely.
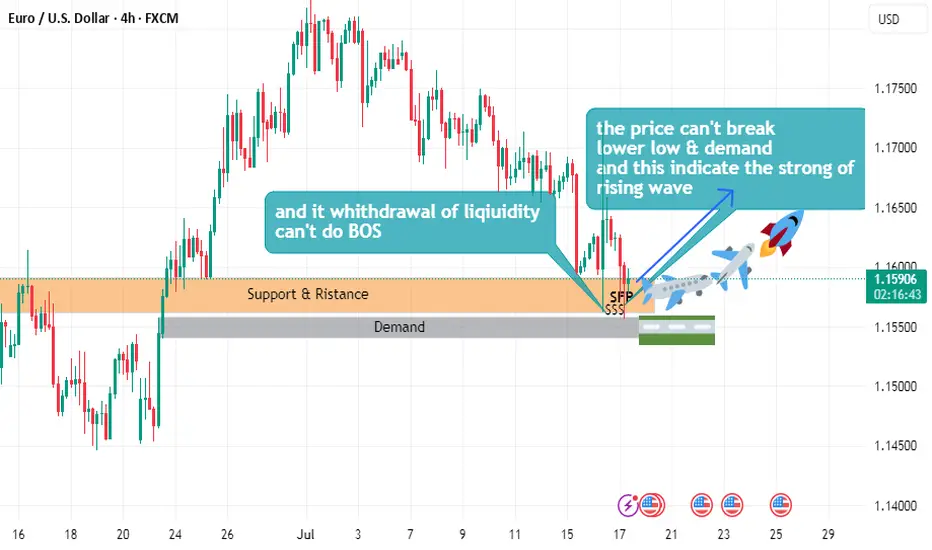
EURUSD buy plane Setuphello
the price can't break lower low
and can't demand
and this indicate the strong of uptrend wave
and it withdrawal of liquidity
and can't do beak of structure