EURUSD: Will Start Falling! Here is Why:
The recent price action on the EURUSD pair was keeping me on the fence, however, my bias is slowly but surely changing into the bearish one and I think we will see the price go down.
Disclosure: I am part of Trade Nation's Influencer program and receive a monthly fee for using their TradingView charts in my analysis.
❤️ Please, support our work with like & comment! ❤️
Eurusd-4

HelenP. I Euro will drop from resistance zone to $1.1260 pointsHi folks today I'm prepared for you Euro analytics. After an extended period of consolidation, the price remained trapped inside a narrow range, testing both the upper and lower boundaries multiple times without any decisive breakout. This indecision created a strong horizontal resistance around the 1.1355 - 1.1370 zone, which continues to act as a key obstacle for bulls. Eventually, the price declined sharply and found temporary support along the upward trend line. This area had already proven its significance through multiple touches and rebounds, serving as a strong dynamic support. After touching the trend line once again, buyers stepped in, leading to a moderate recovery in price action. Currently, EURUSD is pushing back toward the resistance zone. However, I don’t see this upward momentum sustaining for long. The previous failures at this level and the weak follow-through from bulls suggest exhaustion. I believe that once price enters the resistance zone, it will face renewed selling pressure. My expectation is a rejection from this area and a move lower, potentially breaking below the previous local lows. That’s why I set my goal at 1.1260 points, a logical target based on the previous swing support and current bearish setup forming just under a key resistance level. If you like my analytics you may support me with your like/comment ❤️
Disclaimer: As part of ThinkMarkets’ Influencer Program, I am sponsored to share and publish their charts in my analysis.

EUR/USD Rising Wedge Breakdown – Bearish Opportunity in Sight🔍 Technical Breakdown
🟦 1. Rising Wedge Pattern (Bearish)
The price has been moving within a tightening upward channel — forming higher highs and higher lows, but with decreasing momentum. This is a typical Rising Wedge, a pattern that signals exhaustion in an uptrend and typically resolves to the downside.
The pattern formed over several days.
Volume has been declining as the price pushed higher — a classic sign of weakening trend strength.
🚨 2. Major Resistance Zone
The wedge culminated near a major historical resistance zone (around 1.1400), which price failed to break multiple times — showing strong seller presence. This adds confluence to the bearish breakdown.
📉 3. Breakdown & Retest
Price broke below the lower wedge trendline, confirming the bearish reversal. After the breakdown, the pair appears to be retesting the previous support line — now acting as new resistance.
This retest is crucial — a successful rejection here typically confirms the breakdown and provides an ideal entry point for short positions.
⚡ Volume Clues
Note the "Volume Burst" earlier in the chart, followed by a sharp move up. But that rally was unsustainable — buyers couldn’t hold above resistance, and volume has since faded. This volume exhaustion is further evidence that bullish momentum is weakening.
🔄 Key Support Zones Below
Around 1.1200: A strong SR flip zone (support-turned-resistance), which could act as temporary support.
Final Bearish Target: Around 1.1070, a strong demand zone where price previously consolidated before the last bullish run.
This is the measured move target from the wedge height applied to the breakdown point.
🧠 Why This Matters (Trader Insight)
This setup combines:
A reliable bearish pattern (rising wedge)
Key horizontal resistance
A volume drop
A clean retest structure
That makes it a high-confluence short trade idea. These patterns don't always play out immediately, but when they do, they often drop hard.
📌 Trade Setup Summary
Bias: Bearish
Pattern : Rising Wedge (broken)
Current Action: Retesting the broken wedge
Entry Zone: 1.135–1.138 (retest confirmation)
First Target: 1.1200 (SR Flip)
Final Target: 1.1070 (Demand Zone)
Invalidation: Break and hold above 1.1410

EURAUD Ready to Launch? Institutions Positioning for a Big Move!🔍 1. COT REPORT (Commitment of Traders)
EUR:
Net Positioning (Non-Commercial): +75,253 → Bullish, but slightly reduced this week (-3,587 longs, +6,814 shorts).
Commercials: Heavily short (550,286 vs 423,456 longs) → Hedging against potential EUR strength.
Open interest change: +8,343 contracts → Higher market participation, active environment.
AUD:
Net Positioning (Non-Commercial): -59,077 → Strong bearish sentiment on AUD.
Commercials: Net long (121,279 vs 61,743 shorts) → Fundamental support for AUD at potential value areas.
Open interest down (-2,607) → Possible position unwinding or rollover.
📊 COT Conclusion: Speculators favor EUR long / AUD short, but commercials are positioned inversely, suggesting a potential reversal point.
📈 2. SEASONALITY
EUR in May:
Generally negative, with average monthly performance over 10y, 15y, and 20y ranging between -0.01% and -0.02%.
Only the 2y curve shows strength (≈+0.0194).
AUD in May:
Mixed performance: 10y and 5y negative, but 2y slightly positive (+0.0083) → sign of recent improvement.
📊 Seasonality Conclusion: Slight edge for AUD thanks to near-term seasonal resilience.
💡 3. SENTIMENT
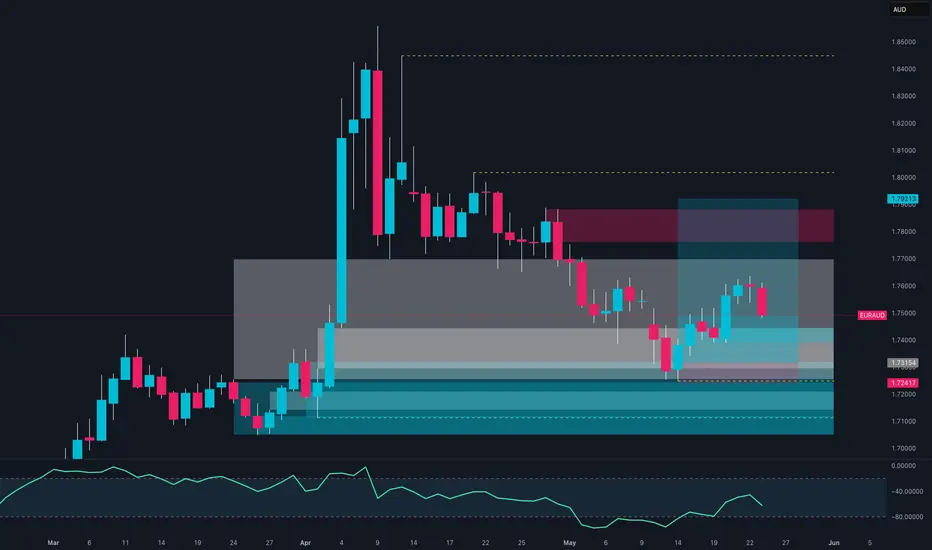
Retail traders: 84% short on EURAUD.
Average short entry: 1.7002, current price ≈ 1.7491 → many are in drawdown.
High short congestion above 1.74 → Potential short squeeze setup.
📊 Sentiment Conclusion: Environment favors a bullish push to trigger stops and unwind retail shorts.
🧠 4. PRICE ACTION
Price reacted to a major demand zone at 1.7200–1.7350.
Last two weekly candles show compression and accumulation following strong bearish momentum.
Clear liquidity pocket above 1.76–1.77, targeting the 1.79–1.80 zone.
RSI showing recovery from oversold conditions.
📊 Technical Conclusion: Structure suggests rebound or reversal, aligned with sentiment and positioning dynamics.
🔚 STRATEGIC OUTLOOK
Primary Bias: LONG EURAUD (multi-day / swing setup)
🎯 Target: 1.7700 – 1.7920
🛡️ Stop: Below 1.7310 (weekly close under demand zone)
⚠️ Alternative (Scenario B): A clear weekly close below 1.7300 may reactivate the bearish trend toward 1.7200.
EURUSD: Weekly overviewThe indicated levels are determined based on the most reaction points and the assumption of approximately equal distance between the zones.
These points can also be confirmed by the mathematical intervals of Murray.
After reacting to the following zones, you can enter the trade. Place the stop loss slightly above/below the zone to which the reaction was shown. The profit point is the next zone.
The drawn channels and their medians can also be considered as moving support and resistance. I usually use them as target points.
* Zones are not disturbed in this analysis.
This analysis is valid until the end of the week.
**************************************
Important news that could change the direction of the trade:
Monday: EURO CPI of April
Friday: German GDP
**************************************
We all now Trump tries to weaken USD to improve US trade efficiency, but all of these efforts might have reversal effects in short-term movements.
Best Regards

Dollar Bottoming Out Pretty solid bottom for USD. I am assuming more money flowing into USD when a correction is about to happen. We see that this morning when we had that quick drop from 7:00 - 8:00 EST. US10Y rate dropping, USD rising, and equity declining. Back to the old game. So I am suggesting long USD, and short equities, given the recent comeback is way too ridiculous and needs a correction now.

EURUSD: Strong Growth Ahead! Long!
My dear friends,
Today we will analyse EURUSD together☺️
The price is near a wide key level
and the pair is approaching a significant decision level of 1.13480 Therefore, a strong bullish reaction here could determine the next move up.We will watch for a confirmation candle, and then target the next key level of 1.13726.Recommend Stop-loss is beyond the current level.
❤️Sending you lots of Love and Hugs❤️

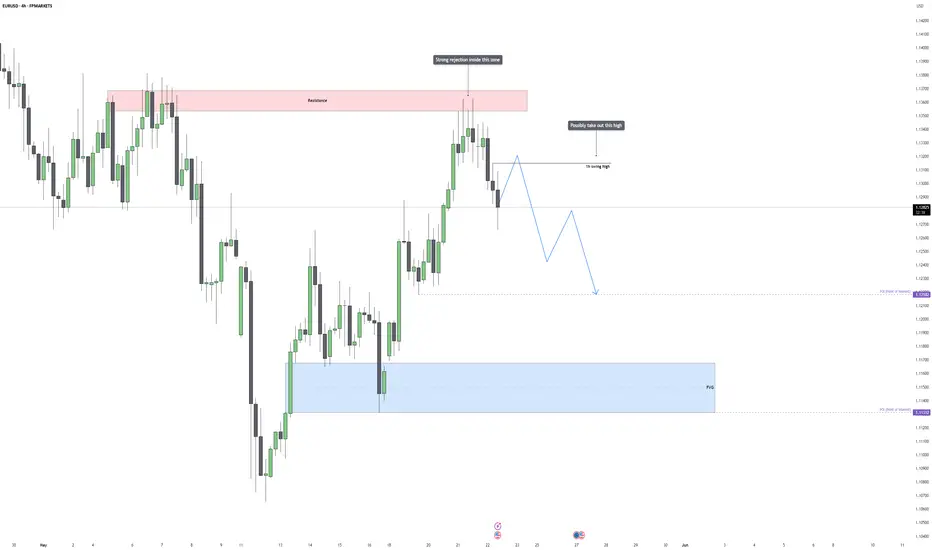
EURUSD – Bearish Outlook After Inducement and RejectionEURUSD recently delivered a sharp rejection from the 1.13700 resistance zone, a level that previously acted as a strong barrier for price. This area had already shown signs of supply in the past, and the latest reaction only strengthens the case for continued bearish interest at that level. The rejection candle was large, clean, and decisive, showing that sellers aggressively stepped in after price entered the premium zone. This shift now places focus on how price navigates lower timeframes in the short term, especially as we approach key liquidity levels and structural points of interest.
Sweep Setup and Liquidity Outlook
Despite the rejection, one notable feature left behind is a 1H swing high just under 1.13400. This high remains untapped and likely holds buy-side liquidity from breakout traders. It’s common to see price sweep such local highs before turning lower, especially after a clear rejection from a major zone like the one above. This potential inducement move, where price runs the high to gather liquidity and trap late buyers, is what I’ll be watching closely next.
The scenario I’m anticipating is a relatively short-lived push higher, just enough to clear the swing high liquidity before price shifts bearish again. This behavior fits within the broader bearish structure and could serve as the final fuel needed before a deeper move to the downside unfolds.
Key Levels and Technical Context
The first point of interest comes in at the 1.12182 level, which is marked on the chart. This level is not rando, it aligns with previous structure, sits near a micro-breaker, and is positioned just above a fair value gap. If we do get the anticipated sweep of the 1H high, this 1.12182 area becomes a highly sensitive zone where the next key reaction could occur.
What makes this POI important is that it serves as a decision point for the market. If the sweep occurs and price aggressively sells off into this level, we can start watching for continuation setups. But if price stalls or consolidates here, we’ll need to evaluate whether the bearish momentum is still intact or if a shift is occurring.
If bearish pressure continues, the next downside target is the POI around 1.11300. This level is nested cleanly inside a higher-timeframe fair value gap, and it also overlaps with a prior demand zone. From a liquidity standpoint, it’s the logical draw, resting sell-side liquidity is likely building beneath those May lows, and the market could easily target that zone once 1.12182 is breached.
Momentum, Structure, and Execution Plan
The current structure is bearish, but short-term strength is still on the table until the sweep of the 1H high plays out. I’m not interested in selling into strength just yet, I’d prefer to see the inducement leg complete, followed by signs of weakness such as bearish engulfing structures, lower timeframe market structure breaks, or clean fair value gap entries forming after the sweep.
Once price breaks below 1.12182 decisively, it opens the path toward the next liquidity pocket at 1.11300. Any signs of continuation post-rejection from that first POI would be used to look for scalable short entries with tight risk and larger reward-to-risk ratios.
Conclusion
EURUSD is setting up for a clean liquidity run above the 1H high, following a strong rejection from higher timeframe resistance. The plan is to let price run that liquidity, then look for bearish signs to engage short down toward 1.12182. If that level fails to hold and bearish pressure continues, the 1.11300 POI becomes the next logical target. The structure is lining up well for this sequence, but execution will depend on how price behaves around the key inducement and reaction zones.
___________________________________
Thanks for your support!
If you found this idea helpful or learned something new, drop a like 👍 and leave a comment, I’d love to hear your thoughts! 🚀
EURUSDWeak USD with tariff plan would maximize the efforts.
Meanwhile, higher EUR would aswell serve the same benefit.
I see it as an entropy of the market that this pair to rise.

Euro will start to grow from support and then leave pennantHello traders, I want share with you my opinion about Euro. Previously, price was moving confidently inside an upward channel, forming steady higher highs and higher lows. After a clear breakout from that structure, the price started consolidating inside a new pattern, an upward pennant. This formation usually appears as a continuation structure, where the market builds pressure before a new impulse. Currently, the price is trading near the middle of the pennant, after rolling down from the resistance line and rebounding up from the support area. The structure is compressing, and a retest of the support line near 1.1155 may occur before a breakout happens. Given the confluence of the pennant structure, the strong support area, and the previous bullish momentum, I expect the Euro to rebound again from the lower trend line and initiate an upward breakout. That’s why I set my TP 1 at the 1.1500 level, a logical target aligned with the upper boundary of the pattern and next key resistance. Please share this idea with your friends and click Boost 🚀
Disclaimer: As part of ThinkMarkets’ Influencer Program, I am sponsored to share and publish their charts in my analysis.

XAU/USD: It's time for Fall? (READ THE CAPTION)By analyzing the gold chart on the 2-hour timeframe, we can see that after our last analysis, the price continued to rise as expected and reached $3344. As I anticipated last week, the gap between $3311 and $3322 has finally been filled! This analysis has delivered a return of over 1090 pips so far. After hitting the $3340 zone, the price faced strong selling pressure and is currently trading around $3294. If gold manages to hold below $3284, we could expect further downside. This analysis will be updated!
Please support me with your likes and comments to motivate me to share more analysis with you and share your opinion about the possible trend of this chart with me !
Best Regards , Arman Shaban

BUY EURUSDAs we monitor DXY for selling opportunity we will also be focusing on EURUSD for buying opportunities. Our current buy is at 1.12878 and stops below 1.12544 our targets remains 1.13630 and higher. Use proper risk management.

EURUSD - Potential Channel break - ShortEURUSD - Potential Channel break - Short
We can have a break of support area and channel with target support zone to 1.07

EURUSD Under Pressure After Weak Eurozone PMIsEurozone PMIs disappointed, and EURUSD is feeling the negative pressure as a result. After breaking above 1.1275, EURUSD is now trading within the 1.1275–1.1375 range. Despite the weak PMI, shaky U.S. bond markets and a stronger Japanese yen are contributing to a weaker dollar, which is offering some support to EURUSD.
The Eurozone composite PMI fell to 49.5 from 50.4, missing expectations of a rise to 50.6. After just four months above 50, the drop back into contraction territory highlights that the Eurozone remains far from recovery. On a positive note, the manufacturing component is starting to show signs of improvement.
Following the data and the news that the "big, beautiful bill" passed in the U.S. House, EURUSD is trying to hold the former resistance at 1.1275, which is now acting as support. If this level fails, the next downside target would be 1.1215.
On the upside, 1.1375 and 1.1425 remain key resistance levels. While 1.1425 holds greater long-term significance, 1.1375 may cap gains for the remainder of the week.

EURUSD Technical Analysis! SELL!
My dear followers,
This is my opinion on the EURUSD next move:
The asset is approaching an important pivot point 1.1348
Bias - Bearish
Safe Stop Loss - 1.1396
Technical Indicators: Supper Trend generates a clear short signal while Pivot Point HL is currently determining the overall Bearish trend of the market.
Goal - 1.1273
About Used Indicators:
For more efficient signals, super-trend is used in combination with other indicators like Pivot Points.
Disclosure: I am part of Trade Nation's Influencer program and receive a monthly fee for using their TradingView charts in my analysis.
———————————
WISH YOU ALL LUCK

EUR/USD Rebounds, Eurozone Data EyedEUR/USD climbed to around 1.1310 during Friday’s Asian session, rebounding as U.S. Treasury yields declined, the 30-year yield slipped from its 19-month high of 5.15%, weighing on the dollar. The recovery follows the House passing Trump’s fiscal bill, which revived deficit worries. Earlier, strong U.S. PMI figures (Composite: 52.1, Manufacturing & Services: 52.3) had briefly strengthened the dollar.
Fed Governor Waller hinted at possible rate cuts if tariffs stabilize, while Trump renewed threats of higher tariffs on the EU. On the European front, ECB officials expect inflation to return to near 2% by end-2025, though growth remains subdued. Eurozone PMIs showed services at 48.9 and manufacturing at 49.4. Focus now shifts to Germany’s GDP release.
Resistance is at 1.1390, with higher levels at 1.1460 and 1.1580. First support lies at 1.1260, followed by 1.1100 and 1.1050.
