EUR/USD at Resistance – Will Sellers Push Price Down to 1.15000?Hello fellow traders! What’s your take on EUR/USD?
From Brian’s personal perspective:
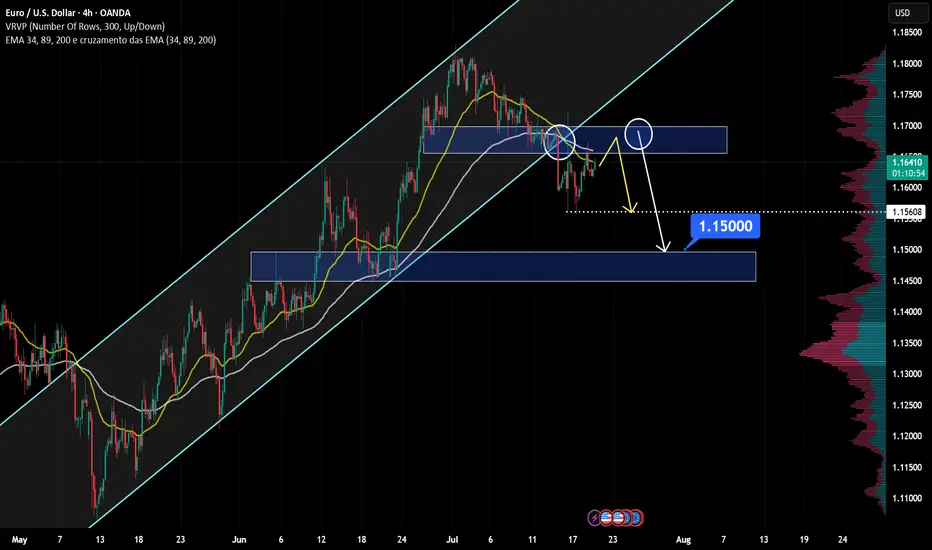
This currency pair is approaching a key resistance zone, which previously acted as a strong support level. This area aligns with historical price reactions and could serve as a solid foundation for potential bearish movements.
If sellers confirm their presence through bearish price action, I anticipate the price could move toward 1.15000. However, a clear break above this resistance level may signal the possibility of further bullish continuation.
Let me know your thoughts or any additional insights you might have!
EURUSD
EURUSD Breaks Bullish Structure – Here’s My Trade Plan📍 Watching EURUSD closely—it's recently broken bullish (market structure) on the daily timeframe 📈.
I’m now waiting for a retrace into a fair value gap, watching for the rebalance and a possible support zone touch before the next leg up 🔄🟢.
🎥 In this idea, I walk you through:
🔍 Price action
🧱 Market structure
📊 Trend direction
📋 And my personal trade plan for this setup
Not financial advice ❌💼

EUR/USD: Bearish Trend in FocusHello everyone, what are your thoughts on EUR/USD?
From my personal analysis, it's clear that EUR/USD is extending its downtrend. The pair is trading around 1.164 and is under pressure from sellers after breaking below both the EMA 34 and EMA 89, with EMA 34 already turning downward — a classic bearish signal.
On the macro side, the European Central Bank is set to announce its monetary policy decision on Thursday. Meanwhile, U.S. President Donald Trump's ongoing trade tensions may add further uncertainty to the market. This corrective downtrend in EUR/USD could very well continue in the weeks ahead.
What do you think — will EUR/USD keep falling?
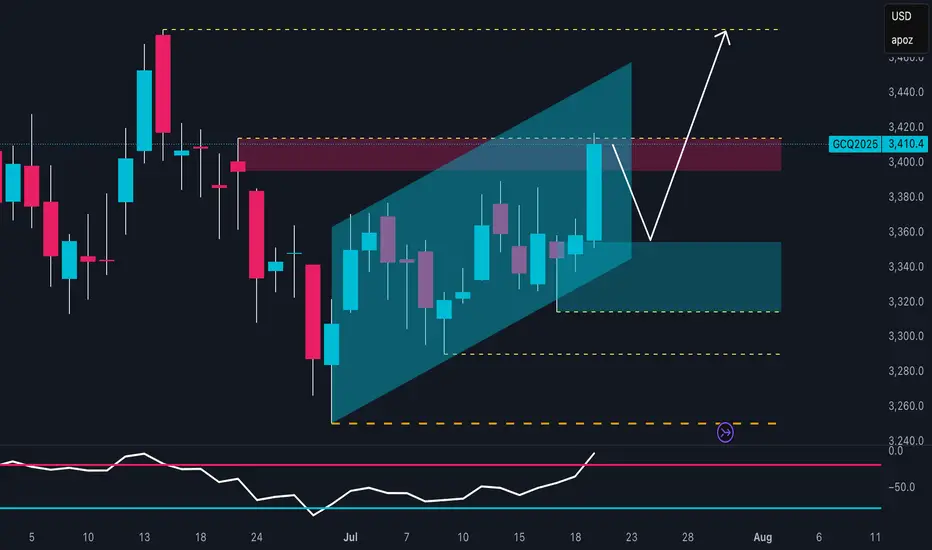
Gold Bulls Reloading? Smart Money Buys!The technical outlook on XAU/USD shows a well-defined bullish trend, developing within an ascending channel that started in late June. Price recently pushed toward the upper boundary of this channel, reaching a key resistance zone between 3,410 and 3,420 USD, which aligns with a previous supply area and significant daily structure. The reaction in this zone suggests a potential fake breakout, hinting at a short-term pullback before a continuation of the upward move.
The RSI oscillator supports this view, displaying bullish momentum with a breakout above the 60 level. However, the current slope hints at a possible minor correction before the next impulsive leg higher. The most relevant demand zone lies between 3,340 and 3,360 USD, at the base of the ascending channel—an ideal spot for buy orders to accumulate in anticipation of a move toward previous highs.
Backing this technical setup, the Commitment of Traders (COT) report as of July 15, 2025, paints a constructive picture. Non-commercial traders (institutional speculators) increased their long positions by over 8,500 contracts, while also cutting short positions by about 1,600 contracts, indicating a strong bullish bias. Commercials also increased their shorts (+16,448), a typical hedge during rallies, but not enough to invalidate the bullish structure.
From a seasonal perspective, July remains one of the historically strongest months for gold. According to MarketBulls data, over the past 2 years, gold has averaged gains of 105+ points in July, with solid returns also visible on the 5-year (+45 pts) and 10-year (+25 pts) averages. August also tends to be supportive, reinforcing the idea of a medium-term bullish extension.
Lastly, the retail sentiment is heavily skewed, with 72% of retail traders short, and only 28% long. From a contrarian standpoint, this is another strong bullish signal. When the majority of retail traders are short in a structurally bullish market, the potential for a short squeeze remains high.
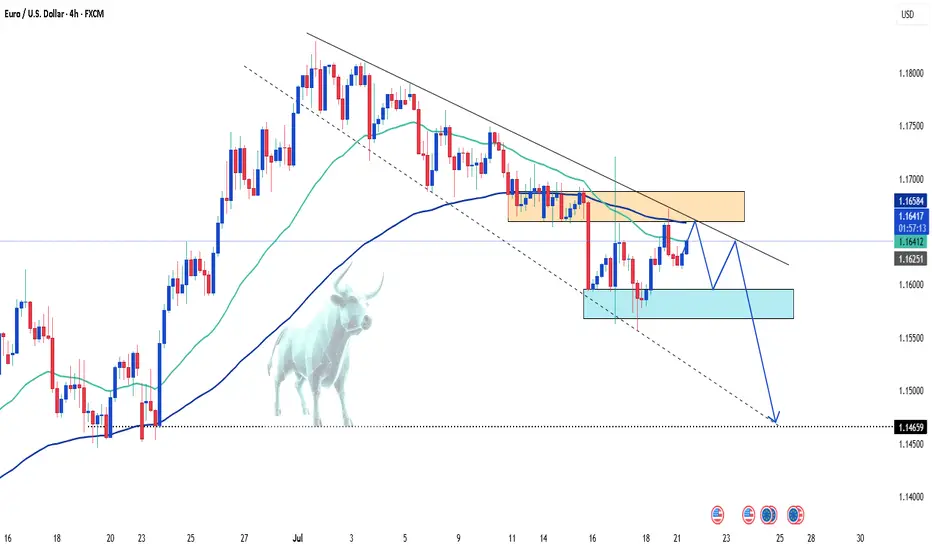
EURUSD - Parallel channel in play!The following chart offers a closer look at the current structure of the EUR/USD pair on the 4-hour timeframe. Price action has been respecting a well-defined bearish parallel channel, which has provided clear boundaries for both resistance and support. Based on the ongoing reaction to these levels, we outline both bullish and bearish scenarios that could unfold in the coming sessions.
Bearish Parallel Channel
Since June 30, EUR/USD has been consistently moving within a downward-sloping bearish parallel channel. Each attempt to break above the upper boundary of the channel has been rejected, while the lower boundary continues to act as dynamic support. This sustained rejection from the upper trendline confirms the strength of the bearish momentum currently at play. The pair remains structurally weak unless a clean breakout to the upside occurs, accompanied by strong bullish confirmation.
Bullish Scenario
A potential bullish reversal could materialize if EUR/USD manages to hold above the 4-hour Fair Value Gap (FVG) located between 1.1620 and 1.1600. This zone may provide the necessary support for the bulls to step in. If the price maintains strength within or just above this FVG and buyers begin to show dominance, a rebound toward the upper boundary of the channel could occur. A successful breakout above the channel could then trigger a stronger rally, possibly targeting the 1.1750–1.1800 region, marking a clear shift in short-term momentum.
Bearish Scenario
Conversely, if the pair fails to hold the 4-hour FVG between 1.1620 and 1.1600 and closes a strong bearish 4-hour candle below this zone, the market may be setting up for further downside. This would suggest a rejection of the FVG as resistance and open the path for a drop toward the lower end of the channel. Interestingly, this area also aligns with a previously established larger 4-hour FVG. A move into this deeper FVG could present a more favorable zone for a longer-term bullish reversal, as it offers a stronger liquidity pool and potential demand area.
Final Thoughts
The EUR/USD pair is at a critical juncture. Price is hovering near a key support zone within a bearish channel that has defined its movement for several weeks. Whether bulls can hold this support and break above the channel, or bears take control and push it lower toward the broader 4-hour FVG, will determine the next major directional move. Traders should closely monitor price action around the 1.1620–1.1600 level for clues on the likely breakout direction.
--------------------------
Disclosure: I am part of Trade Nation's Influencer program and receive a monthly fee for using their TradingView charts in my analysis.
Thanks for your support. If you enjoyed this analysis, make sure to follow me so you don't miss the next one. And if you found it helpful, feel free to drop a like and leave a comment, I’d love to hear your thoughts!

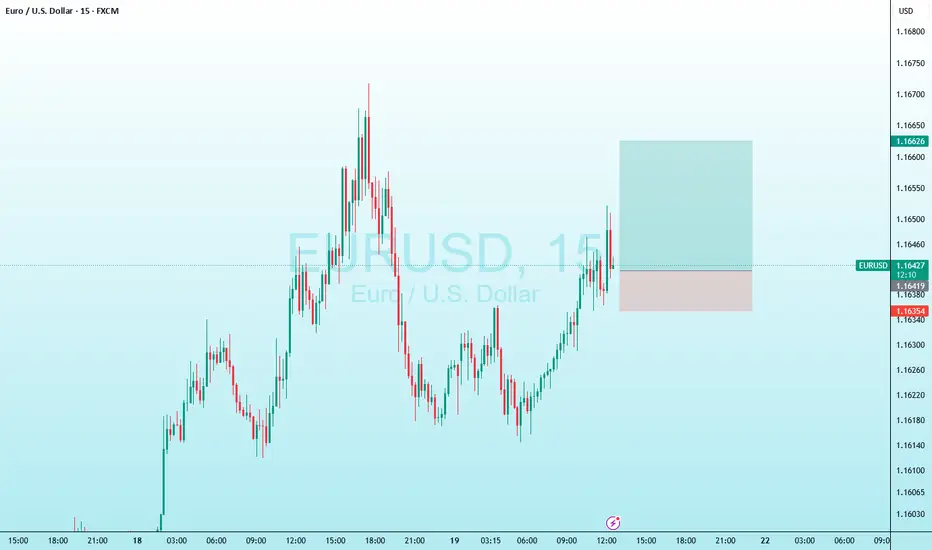
EUR/USD AccumulationOn the 5-minute timeframe, buying activity initiates, signaling the potential end of the downtrend. The first indication of upward momentum appears following the formation of a range and a subsequent liquidity sweep. Price then retests the prior low with diminished volume but fails to break below it, suggesting that selling pressure is being absorbed by buyers. This behavior reflects accumulation by informed participants positioning for a move higher. As demand begins to outweigh supply, clear signs of strength emerge
Entry: 1.15765
Take Profit: 1.16279
Stop Loss: 1.15621

EURUSD Will the 1D MA50 hold?The EURUSD pair seems to be rebounding just before a 1D MA50 (blue trend-line) test, which is its short-term Support. At the same time it bounced off the 0.382 Fibonacci retracement level, which after a +6.92% rise, it resembles the March 27 rebound.
The 1D RSI is printing a standard bullish reversal setup, seen already 4 times since February, and a break above its MA will confirm it.
As long as the 1D MA50 holds, it may extend the uptrend to a new Channel Up (dashed), outside the blue one that may look for a new +6.92% rise. In that case our Target will be 1.21000.
If the 1D MA50 breaks, we will add one last buy at 1.14000, near the 1D MA100 (green trend-line).
-------------------------------------------------------------------------------
** Please LIKE 👍, FOLLOW ✅, SHARE 🙌 and COMMENT ✍ if you enjoy this idea! Also share your ideas and charts in the comments section below! This is best way to keep it relevant, support us, keep the content here free and allow the idea to reach as many people as possible. **
-------------------------------------------------------------------------------
Disclosure: I am part of Trade Nation's Influencer program and receive a monthly fee for using their TradingView charts in my analysis.
💸💸💸💸💸💸
👇 👇 👇 👇 👇 👇

EURUSD: Target Is Up! Long!
My dear friends,
Today we will analyse EURUSD together☺️
The recent price action suggests a shift in mid-term momentum. A break above the current local range around 1.16915 will confirm the new direction upwards with the target being the next key level of 1.17187 and a reconvened placement of a stop-loss beyond the range.
❤️Sending you lots of Love and Hugs❤️

EURUSD Massive Long! BUY!
My dear friends,
Please, find my technical outlook for EURUSD below:
The price is coiling around a solid key level - 1.1627
Bias - Bullish
Technical Indicators: Pivot Points Low anticipates a potential price reversal.
Super trend shows a clear buy, giving a perfect indicators' convergence.
Goal - 1.1710
Safe Stop Loss - 1.1577
About Used Indicators:
The pivot point itself is simply the average of the high, low and closing prices from the previous trading day.
Disclosure: I am part of Trade Nation's Influencer program and receive a monthly fee for using their TradingView charts in my analysis.
———————————
WISH YOU ALL LUCK
EURUSD Bullish ProjectionIt’s been a while since my last update here.
Here’s my projection and actual entry/entries on EURUSD, based on a sweep of the previous 1H swing low and mitigation of a Daily imbalance (Fair Value Gap).
We're anticipating a full Change of Character to mark the end of the ongoing Daily pullback.

EURUSD: Expecting Bearish Movement! Here is Why:
Balance of buyers and sellers on the EURUSD pair, that is best felt when all the timeframes are analyzed properly is shifting in favor of the sellers, therefore is it only natural that we go short on the pair.
Disclosure: I am part of Trade Nation's Influencer program and receive a monthly fee for using their TradingView charts in my analysis.
❤️ Please, support our work with like & comment! ❤️
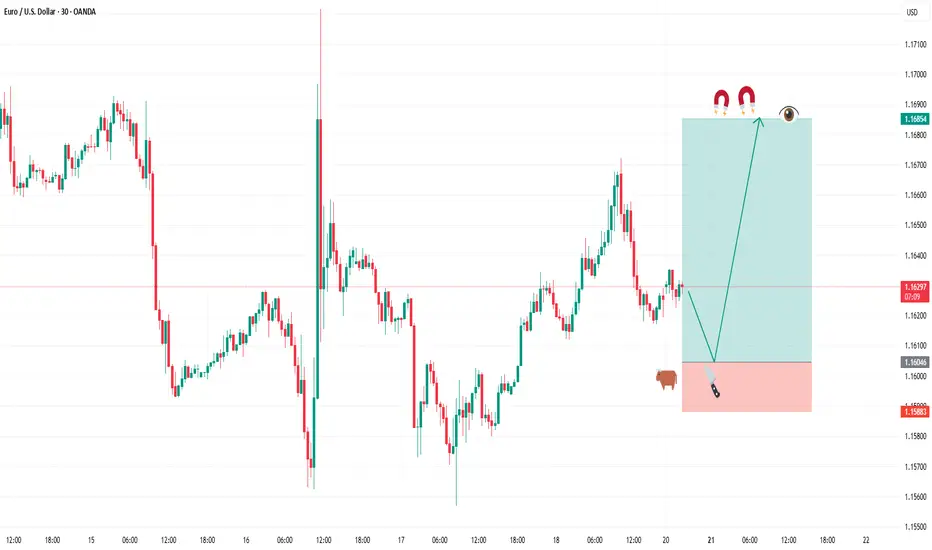
BUY FIBERGreetings traders, today we are looking for buys on EURUSD. Our first entry is at 1.16288 and second entry will be lower at 1.16046 our target is 1.16854 and stops are below 1.15883. use proper risk management and best of luck.
This trade is based on a fine tuned DAILY approach to the algo. Be careful and risk wisely.
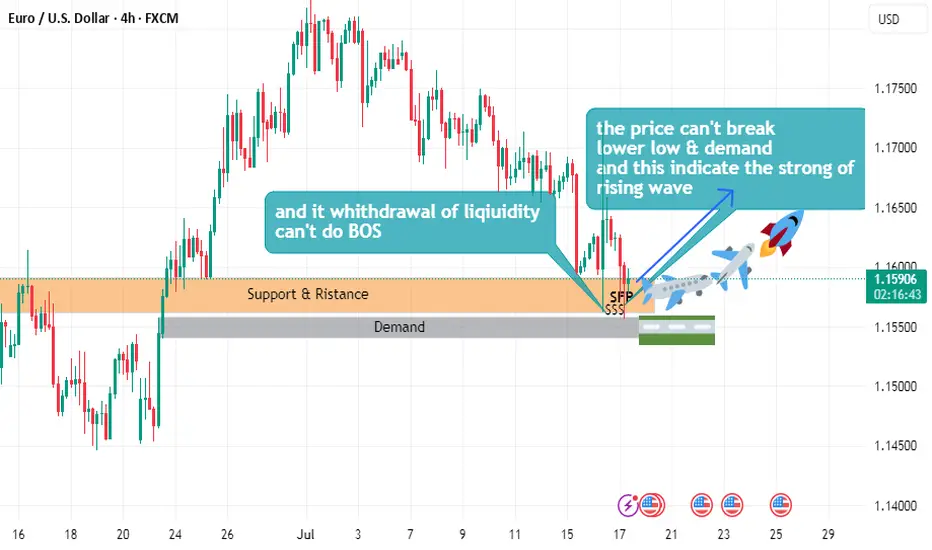
EURUSD buy plane Setuphello
the price can't break lower low
and can't demand
and this indicate the strong of uptrend wave
and it withdrawal of liquidity
and can't do beak of structure
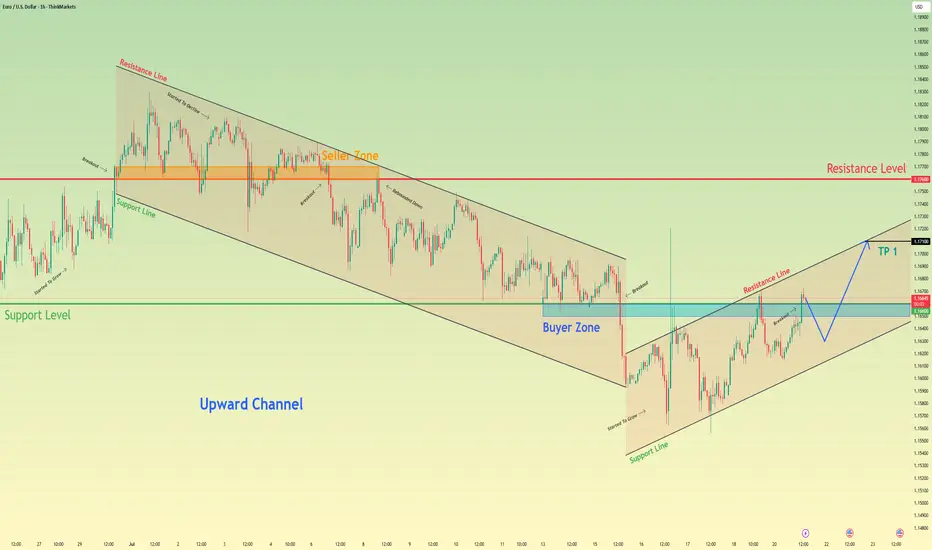
Euro may correct a little and then continue to rise in channelHello traders, I want share with you my opinion about Euro. Observing the recent price action, we can map out a clear transition in market structure. Previously, the pair was contained within a well-defined downward channel, where the seller zone around the 1.1760 resistance level consistently capped rallies, leading to multiple breakdowns and correctional movements. However, after a final push lower, the dynamic shifted, with the price action showing a clear downtrend-to-uptrend reversal. Currently, the euro has established a new upward channel, finding solid ground in the buyer zone around the 1.1660 support level. The price is now engaged in a constructive upward movement within the boundaries of this new channel. The prevailing hypothesis is that after a potential minor correction towards the channel's support line, the pair will resume its ascent. Therefore, the take-profit target for this scenario, tp 1, is strategically placed at 1.1710, as this level directly corresponds with the resistance line of the current upward channel, representing a logical point for price to react. Please share this idea with your friends and click Boost 🚀
Disclaimer: As part of ThinkMarkets’ Influencer Program, I am sponsored to share and publish their charts in my analysis.
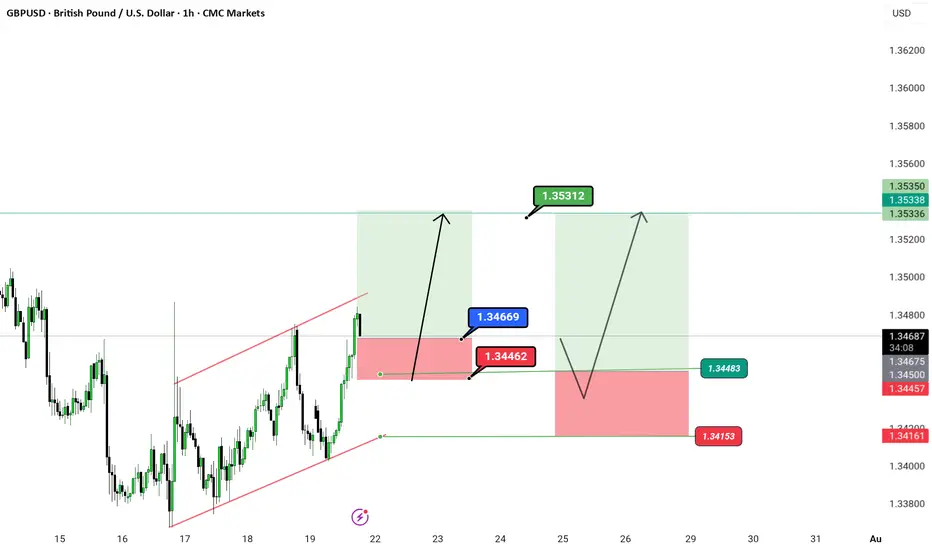
GBP/USD – Breakout bullish bias O_o🎉 GBP/USD – Breakout Party Above the Channel! 🎉
Pound-Dollar just said “bye-bye” to the red channel and is getting ready to dance its way up 💃💵
We have a clean breakout with two possible flight paths 🚀:
📍 Entry Zone: Around 1.34669
🎯 Targets:
1️⃣ 1.35312
2️⃣ 1.35350 (Double top zone – watch this closely 👀)
🛑 Stop Loss: 1.34462
❗ Invalidation below: 1.34153
📐 Structure: Parallel channel breakout 💥
📆 Timeframe: 1H
📌 Chart by: @greenfire_forex
🧠
---
#GBPUSD #ForexTrading #BreakoutSetup
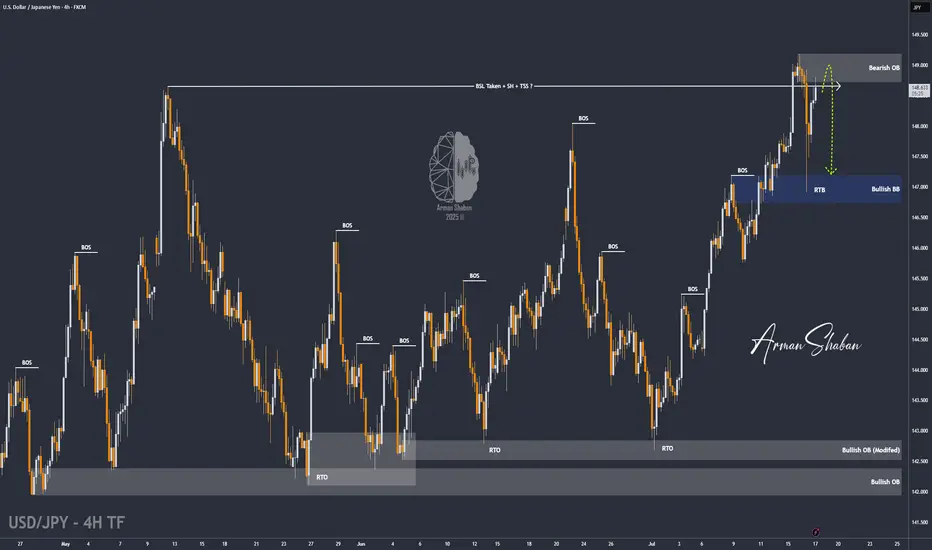
USD/JPY : Get Ready for another Fall ! (READ THE CAPTION)By analyzing the USDJPY chart on the 4-hour timeframe, we can see that after our last daily timeframe analysis, the price started its rally from the 144 zone and, as expected, hit all three targets at 145.5, 147.35, and 148.65, delivering over 500 pips in returns — even reaching as high as 149.2! Once the price broke above 148.65 and swept the liquidity above this level, it faced selling pressure and dropped to 146.9. Currently trading around 148.65, if USDJPY manages to hold below the supply zone between 148.65 and 149.2, we can expect further downside movement. This analysis will be updated with your support!
THE DAILY ANALYSIS :
Please support me with your likes and comments to motivate me to share more analysis with you and share your opinion about the possible trend of this chart with me !
Best Regards , Arman Shaban
DeGRAM | EURUSD moving in an ascending channel📊 Technical Analysis
● Bulls punched through the 11-day descending trend-line (circled “breakout”) and immediately based on it, keeping the rising 30-min channel of higher-lows intact.
● The next confluence lies at 1.1665 where the channel mid-line meets the prior swing top; clearance unlocks the upper band / July supply at 1.1692-1.1700.
💡 Fundamental Analysis
● Friday’s slide in US 2-yr yields after soft existing-home-sales and mixed Fed speak trims dollar carry, while pre-ECB-meeting sources stress “data-dependent patience,” limiting euro downside.
✨ Summary
Long 1.1635-1.1650; hold above 1.1665 targets 1.1692 → 1.1700. Bias void on an H1 close below 1.1615.
-------------------
Share your opinion in the comments and support the idea with a like. Thanks for your support!

EURUSD Will Go Up! Long!
Please, check our technical outlook for EURUSD.
Time Frame: 2h
Current Trend: Bullish
Sentiment: Oversold (based on 7-period RSI)
Forecast: Bullish
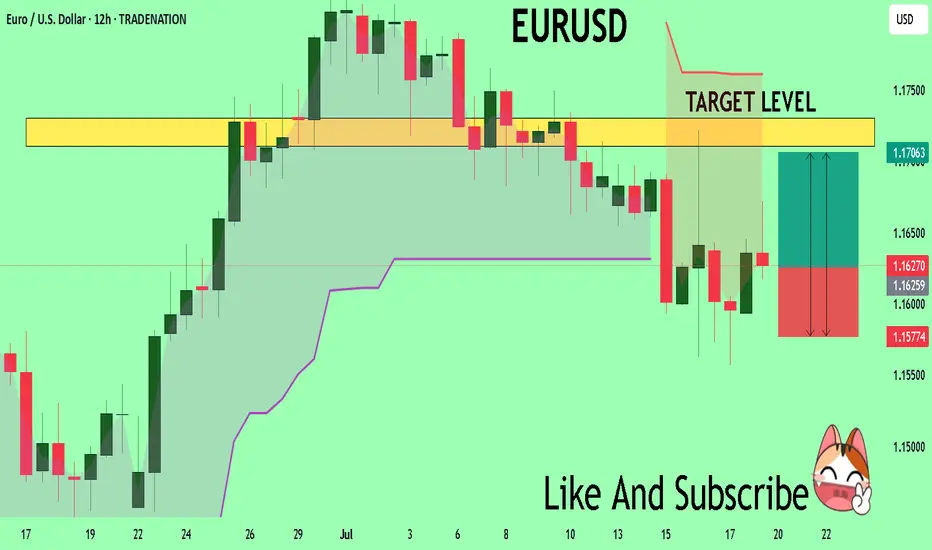
The market is approaching a significant support area 1.166.
The underlined horizontal cluster clearly indicates a highly probable bullish movement with target 1.170 level.
P.S
Overbought describes a period of time where there has been a significant and consistent upward move in price over a period of time without much pullback.
Disclosure: I am part of Trade Nation's Influencer program and receive a monthly fee for using their TradingView charts in my analysis.
Like and subscribe and comment my ideas if you enjoy them!

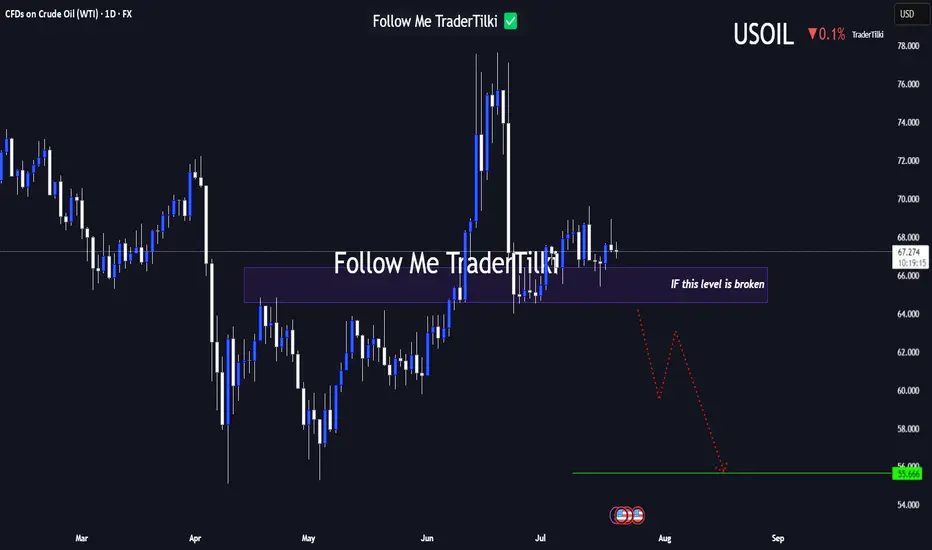
USOIL Under Technical Pressure: 1D Timeframe Breakdown Hey Guys,
The 66.584 level currently stands as the strongest support zone for USOIL. If this level breaks with a candle close, the next major target could drop to 55.666.
This setup is based on the 1-day timeframe. I highly recommend keeping a close watch on that key level.
Every like from you is my biggest motivation to keep sharing these insights. Thanks so much to everyone who’s showing support!
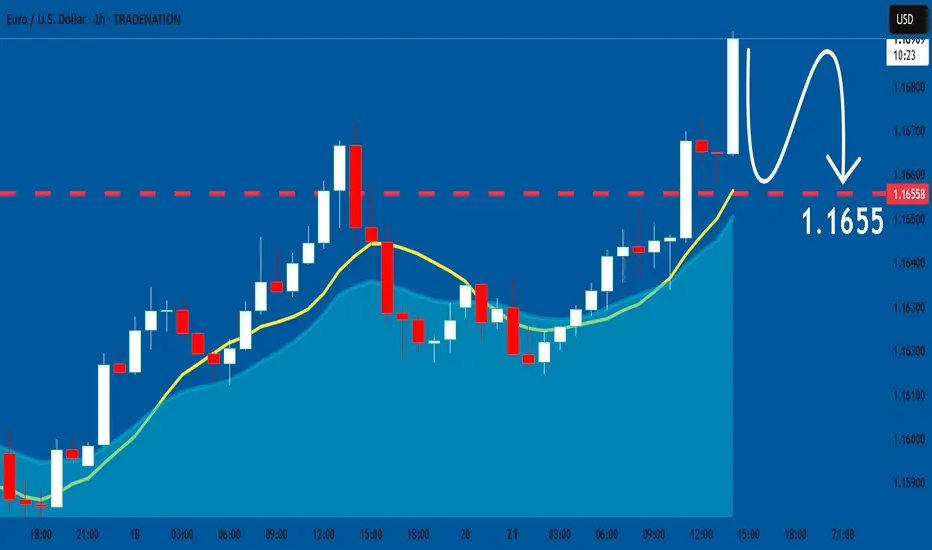
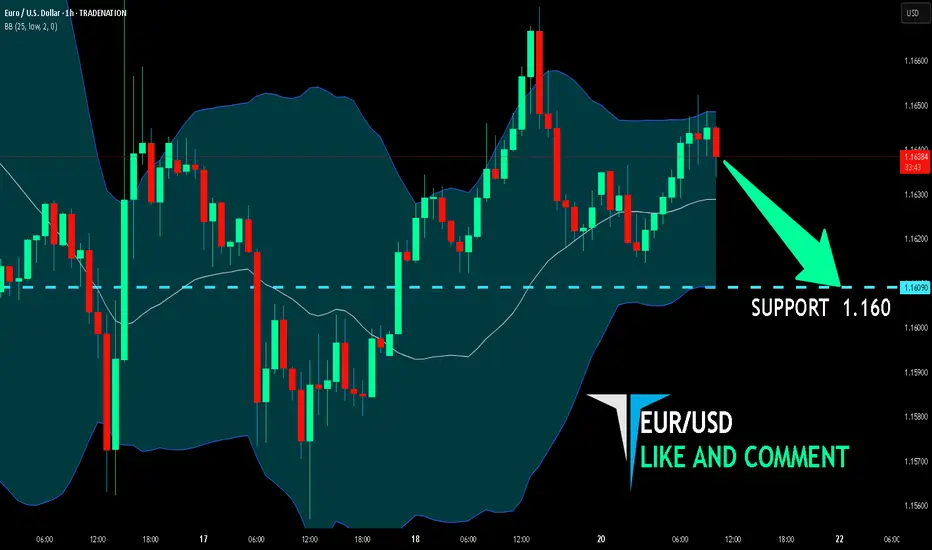
EUR/USD BEST PLACE TO SELL FROM|SHORT
Hello, Friends!
EUR/USD is making a bullish rebound on the 1H TF and is nearing the resistance line above while we are generally bearish biased on the pair due to our previous 1W candle analysis, thus making a trend-following short a good option for us with the target being the 1.160level.
Disclosure: I am part of Trade Nation's Influencer program and receive a monthly fee for using their TradingView charts in my analysis.
✅LIKE AND COMMENT MY IDEAS✅
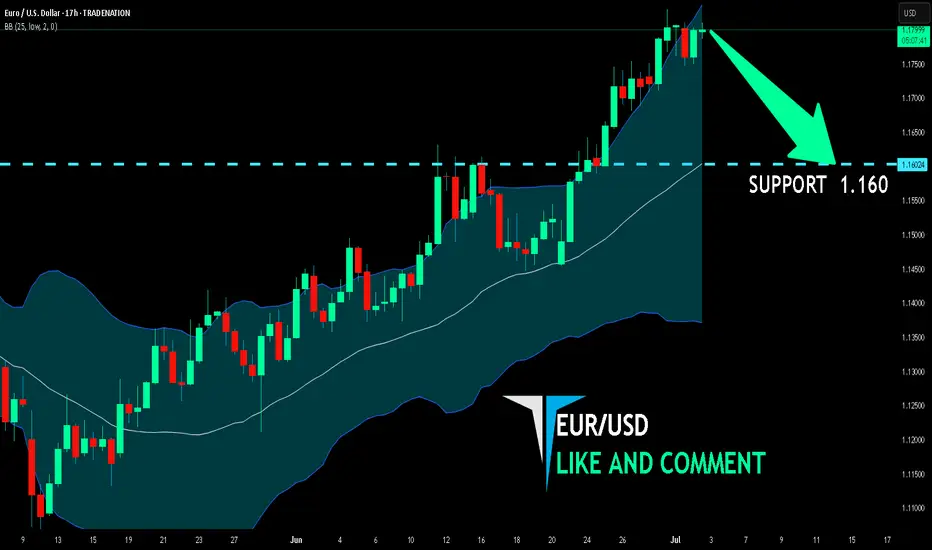
EUR/USD BEST PLACE TO SELL FROM|SHORT
Hello, Friends!
EUR/USD pair is trading in a local downtrend which know by looking at the previous 1W candle which is red. On the 17H timeframe the pair is going up. The pair is overbought because the price is close to the upper band of the BB indicator. So we are looking to sell the pair with the upper BB line acting as resistance. The next target is 1.160 area.
Disclosure: I am part of Trade Nation's Influencer program and receive a monthly fee for using their TradingView charts in my analysis.
✅LIKE AND COMMENT MY IDEAS✅
EURUSD is Nearing the Daily Uptrend! Hey Traders, in today's trading session we are monitoring EURUSD for a buying opportunity around 1.15800 zone, EURUSD is trading in an uptrend and currently is in a correction phase in which it is approaching the trend at 1.15800 support and resistance area.
Trade safe, Joe.

eurusd long positionin my opinion this is a good trade with a good r/r
hope hit the tp
consider this is my trade not your trade and i just like to share my trades with world