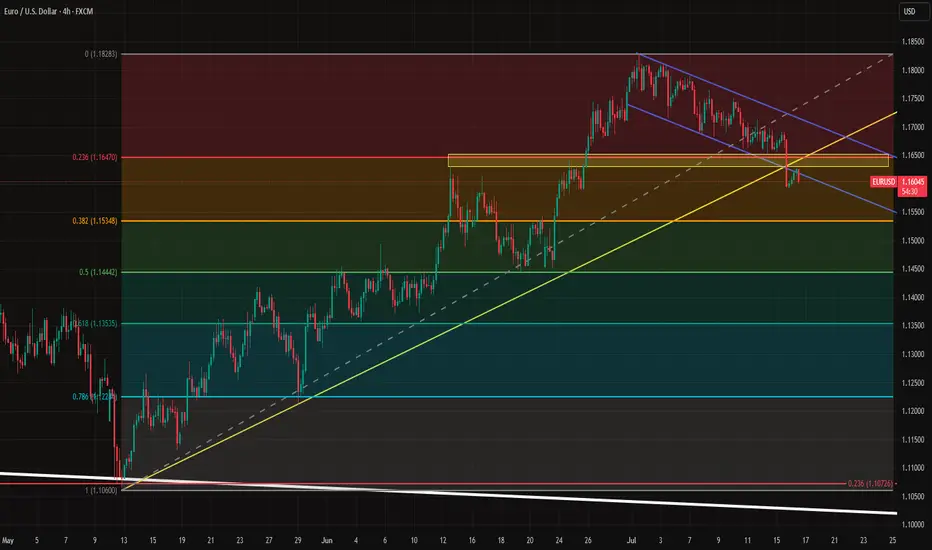
EURUSD - BEARISH TREND CONTINUESEURUSD - BEARISH TREND CONTINUES📉
On Tuesday, despite the bullish divergence (highlighted as green on RSI), the price broke through the trendline, formed since the beginning of May. Yesterday this trendline got retested on Bloomberg's rumor that Powell may resign. Currently the price is going through the support level of 1.16000.
I see the major way is to go towards 1.15000 support level with a further rebound and possible target of 1.16000. Another option is to go straight towards 1.14000. Will see.
EURUSD

Fundamental Market Analysis for July 17, 2025 EURUSDThe euro is edging back toward the 1.16 – 1.17 range highs after headlines suggesting former U.S. president Donald Trump might try to dismiss Fed Chair Jerome Powell and a softer-than-expected U.S. Producer Price Index (PPI) print pressured the dollar. Political noise around the Fed’s independence, coupled with a cooling inflation pulse, has pushed market pricing toward a longer policy pause; the pair is hovering near 1.16250 at the time of writing.
Fundamental support also stems from the upcoming 24 July ECB meeting. Governing-Council commentary reveals a split between hawks and would-be doves, yet consensus that euro-area inflation remains above target makes an aggressive rate cut unlikely for now. Meanwhile, subdued U.S. Treasury yields—futures price a 95 % probability of no change this month and only 50 bp of total easing over 12 months—help narrow the U.S.–German 10-year spread to about 150 bp.
Against a backdrop of ongoing U.S. trade tensions and steady inflows into euro-area assets, that narrower spread leaves room for EURUSD to grind toward the 1.1680 target if sentiment stays risk-positive.
Trading recommendation: BUY 1.16250, SL 1.15950, TP 1.16800

EURUSD Forming Bullish Continuation SetupEURUSD is currently retesting a key breakout zone that previously acted as resistance and is now serving as strong support around the 1.1620–1.1630 area. After a healthy bullish impulse in recent weeks, the pair is pulling back in a controlled manner, likely forming a bullish continuation setup. I entered from earlier levels and remain confident in a further upward move, with the structure showing signs of a new bullish wave forming.
From a fundamental perspective, the euro is gaining strength as the European Central Bank (ECB) continues to signal a more cautious stance on rate cuts compared to the Federal Reserve. US inflation data released last week came in softer than expected, increasing speculation that the Fed could start its rate-cutting cycle as early as September. This shift in monetary policy outlook has weighed on the US dollar, opening up room for EURUSD to push higher.
Additionally, eurozone macro data is showing early signs of recovery, especially in Germany, where industrial production and sentiment indicators are slowly improving. As inflation in Europe trends lower but remains sticky, the ECB has fewer reasons to rush into easing, which adds strength to the euro over the medium term. This divergence is a critical driver of the current bullish sentiment in EURUSD.
Technically, the market is respecting a clean demand zone, with momentum indicators starting to flatten after the recent correction. With the trend structure intact and fundamentals aligned, I'm targeting the 1.2180–1.2200 zone as the next leg of this bullish cycle. Price action remains favorable, and the broader sentiment on TradingView is also increasingly bullish, confirming my conviction in this setup.

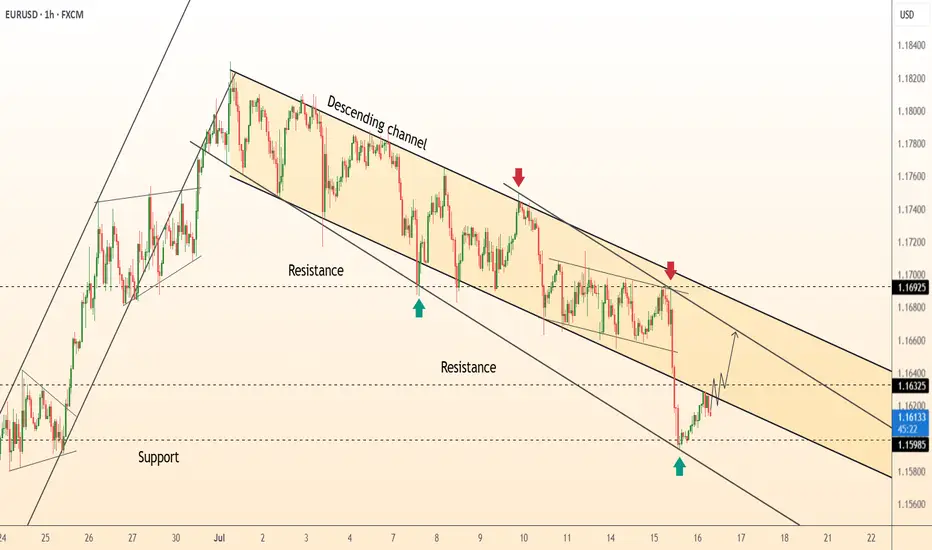
EURUSD – Weakness emerges at descending channel resistanceEURUSD remains within a well-defined descending channel and was recently rejected at the upper trendline – a key dynamic resistance zone. Price action shows the recovery is limited around 1.16600, with multiple FVG (Fair Value Gap) zones reinforcing the potential for further downside.
On the news front, the euro remains under pressure as Eurozone inflation data brought no surprises, while the US dollar is supported by June’s PPI rising exactly as expected at 0.2%. This combination leaves EURUSD with little momentum to break higher, making a move back toward the 1.15300 support area a scenario to watch.
If the price fails to break above 1.16600 and forms a lower high, the bearish trend will be further confirmed. Keep an eye on price behavior around the FVG zones to identify optimal entry points.

GOLD Set for Big Move? | Key Zones + CPI Impact Explained !Gold Analysis – Key Levels + CPI Outlook!
In this video, I broke down the recent rejection from the $3366–$3369 resistance zone, the drop to $3346, and current price action around $3357.
We’ll also look ahead at what to expect with the upcoming CPI report — and how it could shape gold’s next big move.
📌 I’ve covered both bullish and bearish scenarios, shared key demand/supply zones, and outlined possible targets.
👉 For full context and trading strategy, make sure to watch the video till the end — and don’t forget to drop your opinion in the comments:
Do you think gold will break $3380 next, or are we headed for another pullback?
THE MAIN ANALYSIS :

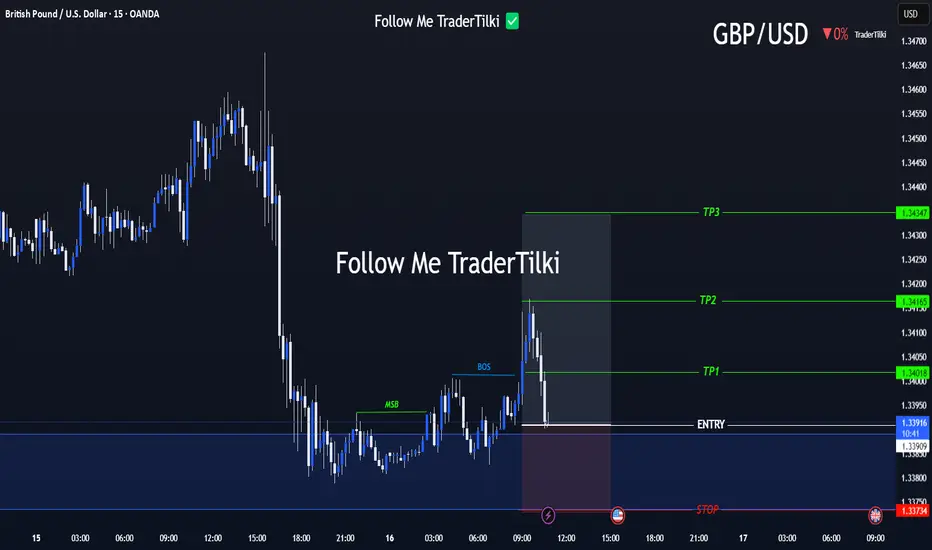
Strategic Entry, Clear Targets: The GBPUSD Game Plan Is Set📢 Hello Guys,
I've prepared a fresh GBPUSD signal for you:
🟢 Entry Level: 1.33918
🔴 Stop Loss: 1.33734
🎯 TP1: 1.34018
🎯 TP2: 1.34165
🎯 TP3: 1.34347
📈 Risk/Reward Ratio: 2,40
------
Your likes and support are what keep me motivated to share these analyses consistently.
Huge thanks to everyone who shows love and appreciation! 🙏
EURUSD Under Pressure After Hot CPI – More Downside Ahead?Today, the US released key inflation figures :
Core CPI m/m: 0.2% (vs 0.3% forecast)
CPI m/m: 0.3% (as expected)
CPI y/y: 2.7% (vs 2.6% forecast, up from 2.4%)
Fundamental Analysis ( EURUSD ):
The slightly lower Core CPI suggests some easing in underlying inflation pressures. However, the headline CPI y/y came in hotter than expected at 2.7%, reinforcing the idea that the Fed is not yet ready to ease policy aggressively.
This combination supports the US dollar, as sticky inflation could delay rate cuts.
EURUSD is likely to remain under pressure in the short term unless the ECB signals a more hawkish stance or US data starts showing broader weakness.
Now let's move on to the technical analysis of EURUSD ( FX:EURUSD ) on the 4-hour timeframe .
EURUSD is trading in a Heavy Resistance zone($1.1802-$1.1602) , having simultaneously managed to break the Support lines and the lower line of the Descending Channel , and is also trying to break the Support zone($1.1642-$1.1578) .
I expect EURUSD to continue its downtrend and decline to the Support zone($1.1549-$1.1520) at the first target .
Second target : $1.15043
Third target : $1.1464
Note: Stop Loss(SL)= $1.1660
Please respect each other's ideas and express them politely if you agree or disagree.
Euro/U.S. Dollar Analyze (EURUSD), 1-hour time frame.
Be sure to follow the updated ideas.
Do not forget to put a Stop loss for your positions (For every position you want to open).
Please follow your strategy and updates; this is just my Idea, and I will gladly see your ideas in this post.
Please do not forget the ✅' like '✅ button 🙏😊 & Share it with your friends; thanks, and Trade safe.

Market Outlook - Trump Questions Powell’s Job - Gold RalliesNordKern active market outlook, reacting to the latest news.
Market Alert | Trump Questions Powell’s Job - Gold Rallies, Dollar Slips
Jul 16 2025 16:56:19 CET: CBS CITING SOURCES:
TRUMP ASKED REPUBLICAN LAWMAKERS IF HE SHOULD FIRE FED'S POWELL
Market Reaction:
OANDA:XAUUSD +$45/oz intraday, currently trading near session highs.
Safe-haven demand and inflation hedge as Fed credibility is questioned.
TVC:DXY Weakens notably against both the TVC:EXY and the TVC:JXY
Markets pricing in higher political risk premium, potential dovish tilt under Trump.
Volatility: Spiking across FX and commodities. VIX and MOVE indexes also showing upward pressure.
Context Matters:
While the Fed Chair cannot be dismissed without cause, even the suggestion of removal injects significant uncertainty into the macro backdrop. Historically, markets react negatively to perceived threats to Fed autonomy (see: Nixon-Burns, Trump-Powell 2018). This development comes just months before the U.S. election, adding a new layer of complexity for macro traders.
What to Watch:
- Fed Speakers: Any defense of Powell or pushback could stabilize markets. Or not.
- Trump Campaign Statements: Will he double down or walk it back?
- Upcoming Data: A dovish-leaning CPI/Jobs print could supercharge gold and further weigh on the dollar.
- Volatility: Traders should adjust position sizing and risk accordingly.
Increased geopolitical and monetary risk are back on the table. Traders should remain nimble, reduce leverage where appropriate, and stay alert to headline risk. Gold and FX are likely to remain reactive into the US session.
NordKern
Euro may fall to support area and then start to growHello traders, I want share with you my opinion about Euro. The price previously moved inside a wedge formation, where it tested the buyer zone and showed a strong reaction from this area. After that, the pair broke out upward and started to trade inside an upward channel, building momentum and forming a clear bullish structure. Later, the price created a pennant pattern, often considered a continuation signal. But before continuing the upward trend, I expect the Euro to first exit from the pennant and decline toward the support area. This zone was previously resistantce, and now it may turn into a strong support. Now the price is trading near the pennant resistance, but I don’t expect a breakout right away. The market needs to correct before it resumes the uptrend. Once the price reaches the current support level or slightly lower, it may find demand again and bounce. That’s why I expect the Euro to retest the support zone and then grow further toward TP 1 - 1.1850 points. This target aligns with the upper border of the upward channel and would complete the continuation move after the pennant breakout. Given the previous structure, bullish momentum, and patterns on the chart, I remain bullish after the correction and expect the price to rise from the support zone. Please share this idea with your friends and click Boost 🚀
Disclaimer: As part of ThinkMarkets’ Influencer Program, I am sponsored to share and publish their charts in my analysis.

EURUSD: The Market Is Looking Down! Short!
My dear friends,
Today we will analyse EURUSD together☺️
The in-trend continuation seems likely as the current long-term trend appears to be strong, and price is holding below a key level of 1.15850 So a bearish continuation seems plausible, targeting the next low. We should enter on confirmation, and place a stop-loss beyond the recent swing level.
❤️Sending you lots of Love and Hugs❤️

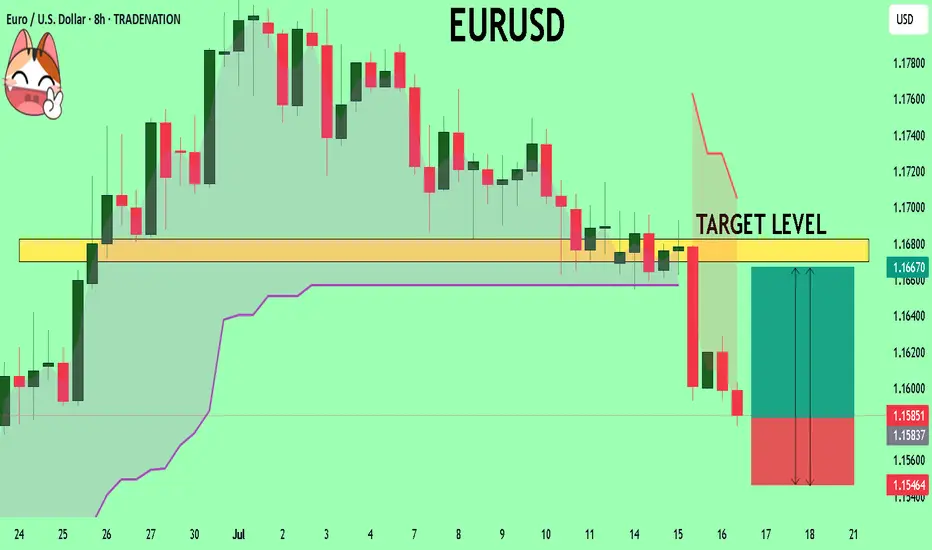
EURUSD My Opinion! BUY!
My dear friends,
Please, find my technical outlook for EURUSD below:
The price is coiling around a solid key level - 1.1584
Bias - Bullish
Technical Indicators: Pivot Points Low anticipates a potential price reversal.
Super trend shows a clear buy, giving a perfect indicators' convergence.
Goal - 1.1670
Safe Stop Loss - 1.1546
About Used Indicators:
The pivot point itself is simply the average of the high, low and closing prices from the previous trading day.
Disclosure: I am part of Trade Nation's Influencer program and receive a monthly fee for using their TradingView charts in my analysis.
———————————
WISH YOU ALL LUCK
EUR/USD : Another Fall Ahead ? (READ THE CAPTION)By analyzing the EURUSD chart on the 4-hour timeframe, we can see that the price is currently breaking through the 1.16–1.158 zone. If it manages to hold below 1.159, we can expect further downside movement. The next targets for EURUSD are 1.15580, 1.154, and 1.148.
Please support me with your likes and comments to motivate me to share more analysis with you and share your opinion about the possible trend of this chart with me !
Best Regards , Arman Shaban
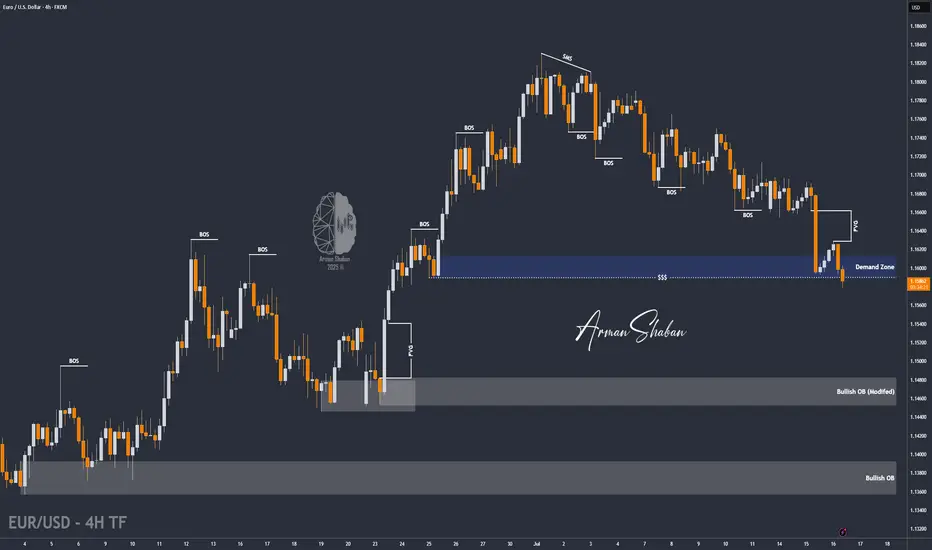
EUR/USD - Daily Chart (Wedge Breakout) (16.07.2025) The EUR/USD Pair on the D1 timeframe presents a Potential Selling Opportunity due to a recent Formation of a Wedge Pattern. This suggests a shift in momentum towards the downside in the coming Days.
Possible Short Trade:
Entry: Consider Entering A Short Position around Trendline Of The Pattern.
Target Levels:
1st Support – 1.0956
2nd Support – 1.0625
💡 Fundamental & Sentiment Context
Euro under pressure amid renewed concerns over EU‑US trade friction .
The USD is strengthening, supported by safe‑haven flows amid tariff uncertainties.
🎁 Please hit the like button and
🎁 Leave a comment to support for My Post !
Your likes and comments are incredibly motivating and will encourage me to share more analysis with you.
Best Regards, KABHI_TA_TRADING
Thank you.
Disclosure: I am part of Trade Nation's Influencer program and receive a monthly fee for using their TradingView charts in my analysis.

EURUSD Under Pressure as Macro Divergence WidensEURUSD is facing renewed downward pressure after rallying from 1.02 to 1.18 in a strong multi-month move. However, diverging inflation expectations between the EU and the U.S. are now weighing heavily on the pair.
One major signal comes from real yields. The Germany–U.S. 10-year real yield spread currently sits at -1.1182, the same level seen during the 2024 top near 1.11 and the 2023 top near 1.10. By that measure, EURUSD appears expensive. Over the past five years, 69% of EURUSD’s moves can be statistically explained by this real yield spread, making it a key macro indicator.
Inflation expectations are also diverging. The U.S. 5y5y inflation swap is trending upward, while the EU’s equivalent has remained flat. This suggests the Fed may keep rates elevated for longer than initially expected.
Beyond bond market dynamics, the August 1 tariff deadline is approaching with no deal in sight. In fact, tensions are rising, as the EU prepares possible countermeasures targeting $84 billion worth of U.S. goods. Adding to the pressure, political risk in France is building due to ongoing budget negotiations.
Technically, the recent break of both the uptrend (yellow) and the downtrend channel was significant. Euro bulls now need to reclaim and hold above 1.1660 to avoid deeper losses. If they fail, 1.1445 could become the next key support level, with further downside possible depending on how the news develops.
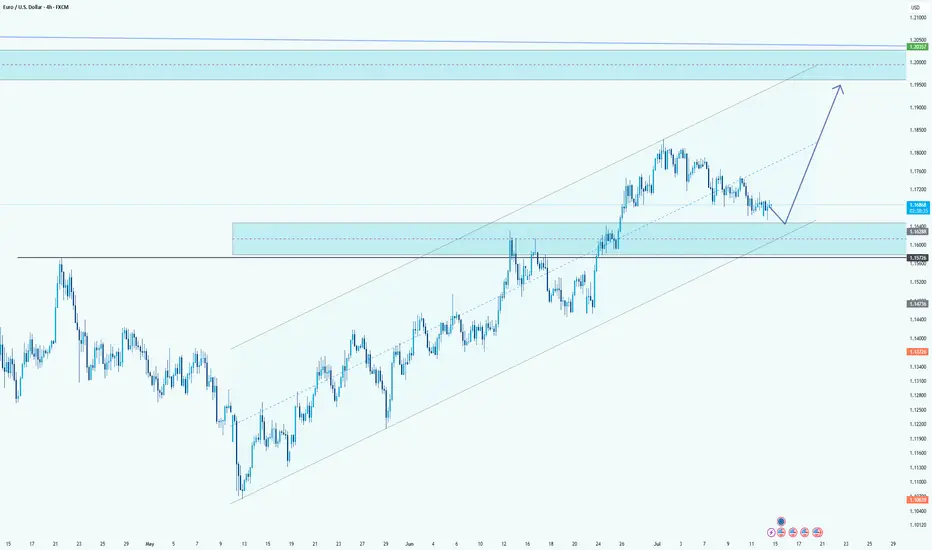
EUR/USD Retracement Into Demand ZoneHello guys!
EUR/USD is currently undergoing a healthy retracement after an extended bullish trend within the ascending channel. The price is now approaching a key demand zone, which aligns perfectly with the mid-line of the channel structure.
This zone previously acted as a strong resistance area and is now expected to serve as support, confirming a classic flip in market structure. The reaction around the 1.16288 - 1.15774 area will be crucial.
If buyers step in here, the bullish momentum is likely to resume with the next major target being the upper resistance zone near 1.20000 , as projected by the upward arrow. The overall structure remains bullish as long as the price holds above the channel support and doesn't close below the last demand zone.
EURUSD will continue to growIt is clear that EUR has broken through the support line, but I don't think the fall will continue. I expect growth to 1.19

EURUSD SHORT SETUP4hour structure is extremely bearish creating series of lower lows and lower highs.
Couple with the fact that GBPUSD is also bearish, while DXY is bullish.
So, I expect price to move lower and break the major swing low below price.

DeGRAM | EURUSD rebound from the trend line📊 Technical Analysis
● Price printed a hammer and bullish RSI divergence on the lower rail of the 3-week descending channel (green arrow 1.1598), breaking the inner wedge that guided last leg down.
● First resistance is the channel mid-line / prior pivot 1.1632; a move through it exposes the upper band near 1.1692, where July supply and the larger bearish trend-line converge.
💡 Fundamental Analysis
● Softer US retail-sales control-group and Daly’s “more evidence needed” remarks cooled 2-yr yields, trimming dollar support, while ECB’s Knot said additional cuts “are not imminent,” limiting euro downside.
✨ Summary
Long 1.1600-1.1620; hold above 1.1632 targets 1.1690. Long view void on an H1 close below 1.1580.
-------------------
Share your opinion in the comments and support the idea with a like. Thanks for your support!
EURUSD Will Go Down! Short!
Take a look at our analysis for EURUSD.
Time Frame: 15m
Current Trend: Bearish
Sentiment: Overbought (based on 7-period RSI)
Forecast: Bearish
The market is testing a major horizontal structure 1.161.
Taking into consideration the structure & trend analysis, I believe that the market will reach 1.159 level soon.
P.S
Please, note that an oversold/overbought condition can last for a long time, and therefore being oversold/overbought doesn't mean a price rally will come soon, or at all.
Disclosure: I am part of Trade Nation's Influencer program and receive a monthly fee for using their TradingView charts in my analysis.
Like and subscribe and comment my ideas if you enjoy them!

DeGRAM | EURUSD fixed under the resistance level📊 Technical Analysis
● Price is stalling against the upper band of a three-month rising channel (≈ 1.1790) after producing a false break and quick rejection—marking a potential bull-trap at trend resistance.
● Bearish divergence on the 4 h RSI and the first lower-high inside a micro rising wedge suggest momentum is fading; a slide through 1.1745 should trigger profit-taking toward the mid-channel support at 1.1595.
💡 Fundamental Analysis
● Solid US payrolls and a hawkish tone in FOMC minutes lift two-year yields, reviving the dollar bid, while post-election coalition wrangling in France keeps a risk premium on the euro.
✨ Summary
Sell 1.1785 ± 15 pips; break below 1.1745 targets 1.1595. Invalidate on a 4 h close above 1.1810.
-------------------
Share your opinion in the comments and support the idea with a like. Thanks for your support!

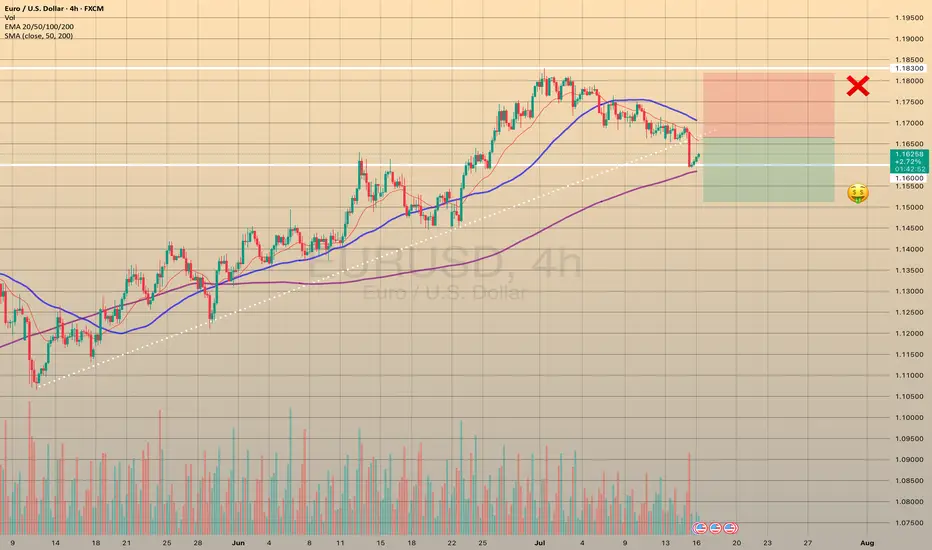
EURUSD TRIGGERED STOP LOSSTRADING IDEA UPDATE - EURUSD TRIGGERED STOP LOSS
The U.S. CPI report data came out right what the market expected (2.7% vs. 2.7% annually). After this report the pair went downwards on increased volume, triggering my stop loss and found the support only on 4-h sma200 and 1.16000 level.
What will be the possible scenario next?
I assume that the asset will go testing the trendline at 1.16650. If the test is successful, I will consider opening a
🔽 a pending sell stop order at 1.16651 with
❌a stop loss at 1.18180 and
🤑a take profit at 1.15122
Only if the retest is successful, not earlier! Let's observe first. Additionally, today is the U.S. PPI report coming out at 12:30 p.m. UTC, so got to be careful around this time
July 15 2025 -Sell Limit ActivatedGood day, folks!
Just sharing another learning from my ideas here:
EURUSD has been in a bearish structure since July 14, 2025 (1H Intraday). As you know, I always look for clear supply or demand validation before placing a sell or buy limit order. On the chart, you can see a valid supply zone that was generated on Monday. After that, I waited for a clear move during the Tuesday London and New York sessions, with the CPI news release acting as a catalyst for more volatility. The trade came to fruition during the New York session on Tuesday. (See chart for the complete breakdown of the movement and entry.)
RR: 1:3
Another Wyckoff schematics and structure analysis.

Eyes on 1.16300: EUR/USD Prepares for the Next Move.📉 EUR/USD Technical 📈
The pair has broken a strong support level and is now finding footing around 1.15970, forming a fresh bullish Fair Value Gap (FVG) at this zone.
At the moment, EUR/USD is moving within a bearish FVG. Here's what to watch next:
🔻 If the market dips from here, we could see a reversal from the lower edge of this FVG.
🔼 But if it holds and pushes higher, breaking above 1.16300 — the CE (Continuity Equation) level of the bearish FVG — that could unlock further bullish momentum.
🚨 Key Levels to Watch:
Support: 1.15970
Resistance/Breakout Zone: 1.16300
📊 Stay alert — price action at these levels could define the next move.
👉 DYOR – Do Your Own Research
📌 Not financial advice.
