Opportunity for buying and selling EURUSDI see that EURUSD has confirmed strong support and resistance, so I took a sell and buy trade with it.
EURUSD

EURUSD Long Setup – Bullish Rejection from Demand ZoneEURUSD remains supported by strong eurozone fundamentals and broad USD softness. The pair has retraced into a key demand zone around 1.1490 and is showing signs of bullish rejection. With the Fed likely to pause further rate hikes and the ECB maintaining a steady tone, the bias favors further upside toward recent highs.
⚠️ Geopolitical tensions in the Middle East (Israel-Iran conflict) have introduced mild safe haven demand, but so far the USD has underperformed versus the euro, suggesting EUR remains relatively insulated.
Watch for confirmation and entries within the blue demand box.
🔍 Technical Analysis:
Structure: Clear uptrend with higher highs and higher lows. Price retraced to a well-defined 1H demand zone between 1.1490–1.1500.
Setup: Anticipating a bounce from the demand zone targeting the recent high near 1.1620–1.1630.
Entry Zone: 1.1490–1.1500 (bullish reaction area)
Target: 1.1620–1.1630 (previous supply zone)
Stop Loss: Below 1.1439 (recent swing low)
Risk-Reward Ratio: Approximately 1:2.5
🧠 Fundamental Context (as of June 16):
EUR Bias: Bullish – ECB has paused cuts; euro is resilient despite geopolitical headwinds.
USD Bias: Bearish – Fed is on pause; soft inflation data and geopolitical risks weigh on dollar strength.
Key Drivers:
Fed dovish tone (FOMC pause, lower CPI)
Strong EU resilience despite global tensions
CHF and JPY attracting safe haven flows over USD
📅 Key Events to Watch:
US Core PCE (next major inflation readout)
FOMC commentary and Fed speakers
Eurozone CPI and sentiment data

Bearish drop?The Fiber (EUR/USD) has rejected off the pivot and could drop to the 1st support.
Pivot: 1.1611
1st Support: 1.1495
1st Resistance: 1.1649
Risk Warning:
Trading Forex and CFDs carries a high level of risk to your capital and you should only trade with money you can afford to lose. Trading Forex and CFDs may not be suitable for all investors, so please ensure that you fully understand the risks involved and seek independent advice if necessary.
Disclaimer:
The above opinions given constitute general market commentary, and do not constitute the opinion or advice of IC Markets or any form of personal or investment advice.
Any opinions, news, research, analyses, prices, other information, or links to third-party sites contained on this website are provided on an "as-is" basis, are intended only to be informative, is not an advice nor a recommendation, nor research, or a record of our trading prices, or an offer of, or solicitation for a transaction in any financial instrument and thus should not be treated as such. The information provided does not involve any specific investment objectives, financial situation and needs of any specific person who may receive it. Please be aware, that past performance is not a reliable indicator of future performance and/or results. Past Performance or Forward-looking scenarios based upon the reasonable beliefs of the third-party provider are not a guarantee of future performance. Actual results may differ materially from those anticipated in forward-looking or past performance statements. IC Markets makes no representation or warranty and assumes no liability as to the accuracy or completeness of the information provided, nor any loss arising from any investment based on a recommendation, forecast or any information supplied by any third-party.

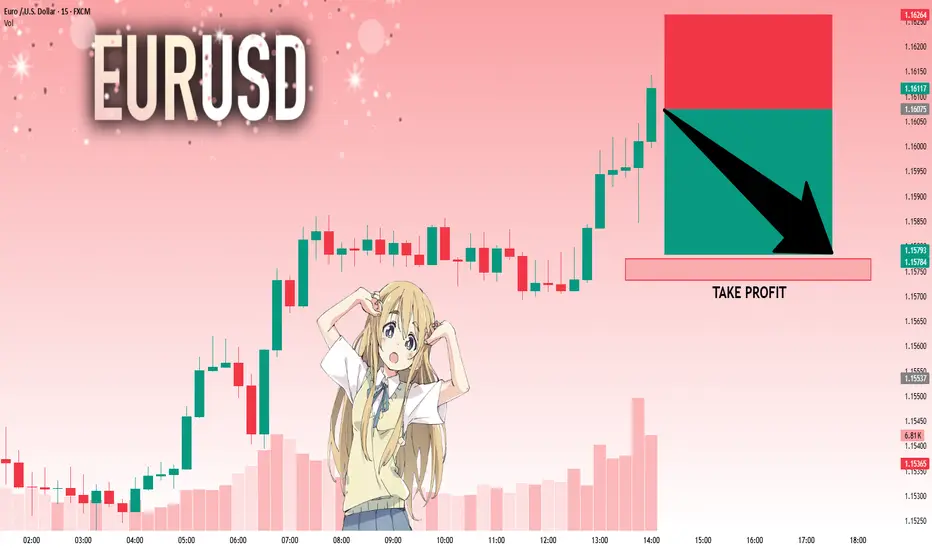
Bullish bounce?EUR/USD is falling towards the support level which is a pullback support that is slightly above the 61.8% Fibonacci retracement and could bounce from this level to our take profit.
Entry: 1.1546
Why we like it:
There is a pullback support level that is slightly above the 61.8% Fibonacci retracement.
Stop loss: 1.1497
Why we like it:
There is an overlap support level.
Take profit: 1.1611
Why we like it:
There is a pullback resistance.
Enjoying your TradingView experience? Review us!
Please be advised that the information presented on TradingView is provided to Vantage (‘Vantage Global Limited’, ‘we’) by a third-party provider (‘Everest Fortune Group’). Please be reminded that you are solely responsible for the trading decisions on your account. There is a very high degree of risk involved in trading. Any information and/or content is intended entirely for research, educational and informational purposes only and does not constitute investment or consultation advice or investment strategy. The information is not tailored to the investment needs of any specific person and therefore does not involve a consideration of any of the investment objectives, financial situation or needs of any viewer that may receive it. Kindly also note that past performance is not a reliable indicator of future results. Actual results may differ materially from those anticipated in forward-looking or past performance statements. We assume no liability as to the accuracy or completeness of any of the information and/or content provided herein and the Company cannot be held responsible for any omission, mistake nor for any loss or damage including without limitation to any loss of profit which may arise from reliance on any information supplied by Everest Fortune Group.

Gold Cooling After Spike – $3375 Key Level to WatchBy analyzing the gold chart on the 4-hour timeframe, we can see that after surging to $3450 amid the Iran–Israel conflict, gold faced a pullback following a liquidity sweep above that level.
Currently, gold is trading around $3392, and after a potential correction down to $3375, I expect to see further upside movement.
⚠️ Stay cautious — gold remains highly volatile and sudden moves are likely!

EURUSD Last push before correction.The EURUSD pair made a new High by breaking above the 1.15725 Resistance and is extending the rally since the January 13 2025 Low. That Low was the Higher Low of the multi-year Channel Up, so the current uptrend is technically its latest Bullish Leg.
The first Bullish Leg of that pattern peaked after a +15.75% rise. We expect a similar peak for the current rally, thus targeting 1.17750, before a new pull-back below the 1D MA50 (blue trend-line).
-------------------------------------------------------------------------------
** Please LIKE 👍, FOLLOW ✅, SHARE 🙌 and COMMENT ✍ if you enjoy this idea! Also share your ideas and charts in the comments section below! This is best way to keep it relevant, support us, keep the content here free and allow the idea to reach as many people as possible. **
-------------------------------------------------------------------------------
Disclosure: I am part of Trade Nation's Influencer program and receive a monthly fee for using their TradingView charts in my analysis.
💸💸💸💸💸💸
👇 👇 👇 👇 👇 👇

EUR/USD 2-Hour Chart Analysis2-hour candlestick analysis of the Euro/US Dollar (EUR/USD) pair, with a recent uptrend from a low of 1.15244 to 1.15816 (+0.26%). A breakout above the resistance level is highlighted, suggesting potential bullish momentum.

Testing Upper Channel Line || Eyes on 1.16 and Previous High📌 EURUSD 4H – Testing Upper Channel | Eyes on 1.1600-1.1666
🕓 June 12, 2025
👤 By: MJTrading
🔍 Technical Overview:
EURUSD continues its upward trajectory within a clean ascending channel, respecting both dynamic structure and EMA support zones. We're now retesting a key confluence area:
==============================================================
🔻 Bearish Setup Idea:
Entry Zone: 1.1570–1.1600
Stop Loss: Above 1.16666 (round number & psychological resistance)
Target: Channel midline (~1.1450) or lower band (~1.1380)
🧠 Why This Zone Matters:
🔺 Previous Swing Highs: Price is revisiting the April peak zone (~1.1570)
🧱 Round Number Confluence: 1.1600 & 1.1666
📉 Rising Channel Resistance: Upper boundary hit after extended leg
🔄 Potential Mean Reversion: EMAs are lagging behind price
⚠️ Invalidation:
A clean break and close above 1.1700 with follow-through may invalidate short bias and signal continuation toward 1.1800+
💬 Patience is power. Let the levels do the talking.
📎 #EURUSD #ForexAnalysis #TechnicalTrading #SmartMoney #PriceAction #RoundNumberLevels #MJTRADING

EURUSd a big move down
📉 EUR/USD Analysis | 2H Timeframe
Wave 5 in play! 🚨
Structure shift confirmed with BOS at key supply zone. Expecting liquidity sweep and a bearish reversal 📉
🧠 Smart Money + Elliott Wave Combo:
🔹 BOS at Wave 3 ✅
🔹 Wave 4 retracement held
🔹 Anticipating Wave 5 top-out and reversal
🔹 Targeting major demand zones (blue lines)
🔻 Potential Sell Setup Loading…
📆 Monday, 16 June | 2H Chart
🔍 PEPPERSTONE: EUR/USD
💬 Drop your thoughts below or DM “WAVE” to learn this strategy!
—
🔖 #eurusd #forexanalysis #elliottwave #smartmoneyconcepts #forextrader #fxsignals #technicalanalysis

EURUSD: The Market Is Looking Down! Short!
My dear friends,
Today we will analyse EURUSD together☺️
The market is at an inflection zone and price has now reached an area around 1.16075 where previous reversals or breakouts have occurred.And a price reaction that we are seeing on multiple timeframes here could signal the next move down so we can enter on confirmation, and target the next key level of 1.15775..Stop-loss is recommended beyond the inflection zone.
❤️Sending you lots of Love and Hugs❤️
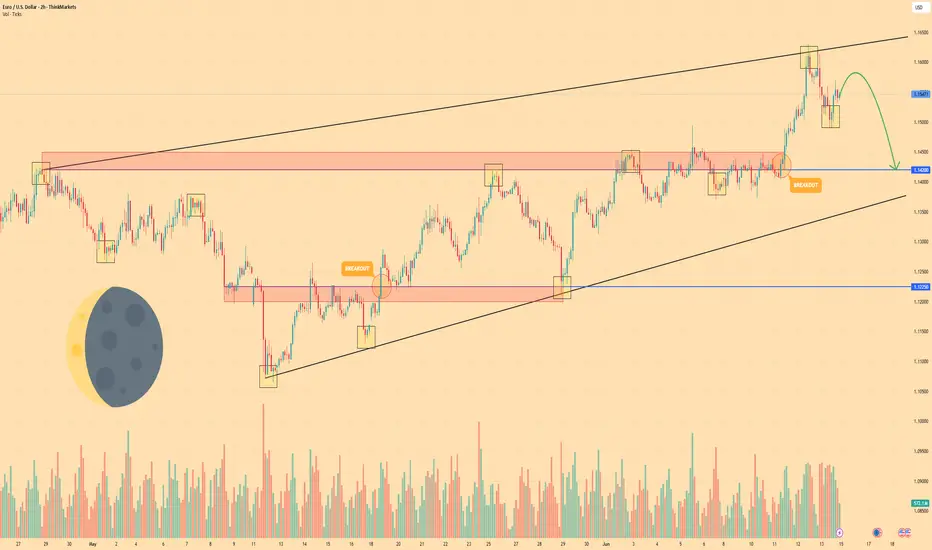
EURO - Pirce can make movement up and then drop to $1.1420Hi guys, this is my overview for EURUSD, feel free to check it and write your feedback in comments👊
After entering the wedge, Euro began to slow down, creating a tightening structure between support and resistance.
Price corrected toward the support line of the wedge, where it briefly paused and bounced with weak momentum.
The bounce triggered a breakout above local resistance, but buyers failed to hold the price at higher levels.
Soon after, the market reversed from the wedge’s upper boundary and began forming a bearish rejection pattern.
Now price trades just below the recent highs, showing fading demand and early signs of short-term reversal.
I expect Euro to move lower and reach the $1.1420 support level — my current target in this scenario.
If this post is useful to you, you can support me with like/boost and advice in comments❤️
Disclaimer: As part of ThinkMarkets’ Influencer Program, I am sponsored to share and publish their charts in my analysis.
EURUSD 1H. for 50 pips! :)Hello dear traders, this is EURUSD with Nika.
I want to share you this idea, with buy on limit perspective.
We may see this previous and current pattern are strong in connection.
So that's my opinion, about how we may receive some price movement.
It's good trading idea only in low budget. :)
Thank you!

EURUSD Is Bullish! Long!
Here is our detailed technical review for EURUSD.
Time Frame: 3h
Current Trend: Bullish
Sentiment: Oversold (based on 7-period RSI)
Forecast: Bullish
The market is trading around a solid horizontal structure 1.157.
The above observations make me that the market will inevitably achieve 1.165 level.
P.S
Please, note that an oversold/overbought condition can last for a long time, and therefore being oversold/overbought doesn't mean a price rally will come soon, or at all.
Disclosure: I am part of Trade Nation's Influencer program and receive a monthly fee for using their TradingView charts in my analysis.
Like and subscribe and comment my ideas if you enjoy them!

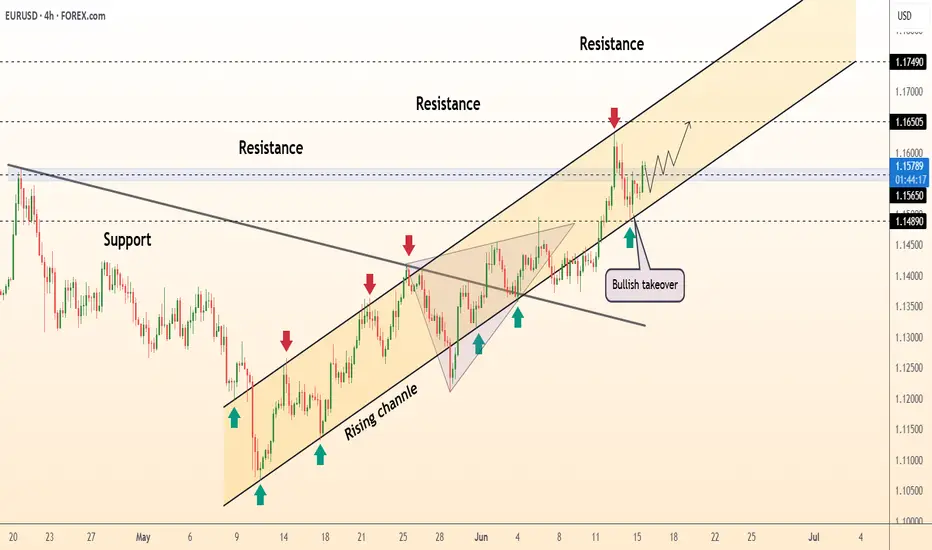
DeGRAM | EURUSD fixed above the lower boundary of the channel📊 Technical Analysis
● Euro keeps stair-stepping along the inner trend-line of the 2-month rising channel; each dip to the line (green arrows) is met with higher lows, confirming firm demand around 1.1485-1.1500.
● Friday’s break back above the former wedge cap turned 1.1550 into support; clearing the last swing high at 1.1605 would expose the channel median / fib cluster at 1.1650, with the upper rail near 1.1745 as an extension.
💡 Fundamental Analysis
● Softer US retail-sales and a slump in NY Fed manufacturing pulled Treasury 2-yr yields under 4.70 %, while ECB speakers warned that further cuts “are not a given,” narrowing the rate gap and reviving euro bids.
✨ Summary
Long 1.1520-1.1560; hold above 1.1550 targets 1.1650 ➜ 1.1745. Bias void on an H4 close below 1.1480.
-------------------
Share your opinion in the comments and support the idea with like. Thanks for your support!
EURUSD 16 June – Technical Rebound or Liquidity Trap? EURUSD 16 June – Technical Rebound or Liquidity Trap?
The EURUSD pair has shown sharp movements after testing key resistance near 1.1607. While the price action may appear bullish at first glance, deeper analysis suggests we might be facing either a continuation of the uptrend or a strategic liquidity hunt.
🌍 Macro & Fundamental Overview
The ECB remains hawkish with rates still high, but recent commentary hints at a more dovish tone possibly leading to rate cuts in late Q3 2025.
Meanwhile, the Federal Reserve maintains its cautious stance, holding off on rate cuts due to sticky core inflation.
This divergence in policy expectations creates a neutral to slightly USD-favorable bias, depending on upcoming economic data.
⏳ Bottom line: EURUSD remains in a choppy environment with compression–expansion cycles, and no confirmed macro-driven trend yet.
📉 Technical Outlook (H1 Chart)
Price Structure: The pair is moving within a short-term ascending channel, but current price is testing the upper boundary.
EMA Analysis (13/34/89/200): Still supports an uptrend, but flattening out — potential bearish crossover if price fails to hold.
Key Resistance:
1.1607: Major resistance and local top (double rejection zone).
Critical Support Zones:
1.15540: Minor structural support — a decisive level for intraday direction.
1.15261 & 1.14807: Unfilled FVG zones and liquidity pools that may get targeted if the price breaks lower.
🎯 Trade Setup Ideas
📘 Scenario A – BUY from 1.15540 support (bullish continuation)
Entry: 1.15540 (upon bullish candle confirmation or strong bounce)
Stop Loss: 1.15200
Take Profits: 1.15850 → 1.16070 → 1.16300+
✅ Ideal if European sentiment remains positive or if USD weakens across the board.
📕 Scenario B – SELL if price breaks and retests 1.15540
Entry: 1.15540 (after a breakdown + rejection retest)
Stop Loss: 1.15720
Take Profits: 1.15261 → 1.14807 → possibly 1.1450
✅ Best used if USD gains strength or EUR shows weakness after economic releases.
🧠 Market Psychology
The market is currently reactive to any shift in tone from ECB and Fed, causing price whipsaws near key zones.
Smart traders will avoid chasing breakouts and instead focus on reaction zones like 1.15540 for confirmation-based trades.
Watch for fakeouts, as institutional players may be hunting liquidity before choosing direction.
📌 Final Thoughts
EURUSD is in a sensitive zone, and 1.15540 is the intraday pivot. Holding above could trigger a push toward 1.1607 and higher. But failure to hold would likely attract sellers toward the 1.1480–1.1450 liquidity range.
🎯 Discipline is key. Avoid emotional entries. Let the market come to your level — and execute only with confirmation.

EUR/USD - Upside Bias Continues Amid Market EventsHi Everyone,
As outlined in our analysis last week, we continue to expect EUR/USD to advance further to the upside. A successful retest of the 1.15240 level provides support for the move.
This promises to be an eventful week as markets navigate geopolitical tensions and upcoming central bank decisions. As long as price holds above 1.14483, we anticipate a continuation higher toward the 1.16564 level, which would further reinforce our long-term bullish outlook.
A confirmed break above this resistance would likely open the door for a move toward 1.18325, where we anticipate encountering dynamic resistance.
We will provide further updates on the projected path for EUR/USD should price reach this level.
The longer-term outlook remains bullish, with expectations for the rally to extend toward the 1.2000 level, provided the price holds above the key support at 1.10649.
We will continue to update you throughout the week with how we’re managing our active ideas and positions. Thanks again for all the likes/boosts, comments and follows — we appreciate the support!
All the best for a good end to the week. Trade safe.
BluetonaFX

EurUsd Daily Profile and expectation for New YorkMy Monday Protocol normally is to sit on my hands and see how Monday prints and trade from Tuesday onwards. With FOMC coming Wednesday, I'm allowed to deviate from this because Monday can be trending to "get somewhere in a hurry", trap Traders and go the other way during FOMC.
When I now look at the Market I see that London kept Asia Lows in tact and expanded higher leaving Failure Swings. Now consolidating which is normally a continuation signature... But then it should first sweep the consolidation Low and make a Reversal Signature. When we sweep or run the Consolidation High first, then the Long idea is not valid anymore.
Im watching the FVG below and see how we trade there and then decide if a Long is in play... I don't want to lose the Equilibruim Level of London Session otherwise the Failure Swings below the Market are the target.
Bottom Line, no hard Bias because its Monday. Favoring the Bullish side with FOMC on the Agenda this week, but not in a hurry to trade.
Hope you appreciate my content 👍
Happy Hunting, Stay Safe!
Warm Regards,
Mariinus

SHOT ON EUR/USDEUR/USD Has given us a nice double top at a major resistance level.
Since then it has broken the neckline of that double bottom, creating a new low, engineering liquidity, sweeping it and now getting ready to tap into supply before it should fall.
The Dxy is also getting ready to rise from a demand level so this should also aid in pushing EU down.
Looking to catch over 200 pips.

MARKET TECHNICAL BREAK DOWN FOR 16TH TO 20TH JUNE📊 Market Technical Breakdown – EURUSD, AUDUSD, XAUUSD & BTCUSDT 🔍
Traders,
Get ready for this week’s precision-driven analysis across four major markets:
✅ EURUSD – Is the euro gaining strength or facing more downside?
✅ AUDUSD – Key zones to watch as the Aussie reacts to USD data.
✅ XAUUSD (Gold) – Will gold hold strong or give in to bearish pressure?
✅ BTCUSDT – Bitcoin’s momentum shift: Are bulls still in control?
This breakdown covers:
🔹 Clean chart analysis
🔹 Key levels (support & resistance)
🔹 Trade ideas with potential entries & exits
🔹 My personal trading insight for each pair
🎯 Whether you're a beginner or a seasoned trader, this breakdown will help sharpen your bias and build confidence in your trades.
👉 Watch the video till the end to catch all setups, confirmations, and bonus tips for the week.
Drop a comment if you found it helpful or want to see a pair included in the next breakdown!

ECB’s De Guindos Sees Balanced Inflation RisksEuropean Central Bank Vice President Luis de Guindos said Monday that the EUR/USD at 1.15 does not hinder the ECB’s inflation goal, noting the euro’s gradual rise and stable volatility.
He stated inflation risks are balanced, with little chance of falling short of the target, and that markets have clearly understood the ECB’s recent policy signals. De Guindos reaffirmed the ECB is close to its inflation objective
Looking ahead, he warned that tariffs could slow growth and inflation in the medium term but expressed confidence in the Fed maintaining swap line arrangements. He also confirmed there have been no discussions about repatriating gold reserves from New York.
At the time, EUR/USD was down 0.09%, trading near 1.1537.
Resistance is located at 1.1580, while support is seen at 1.1460.

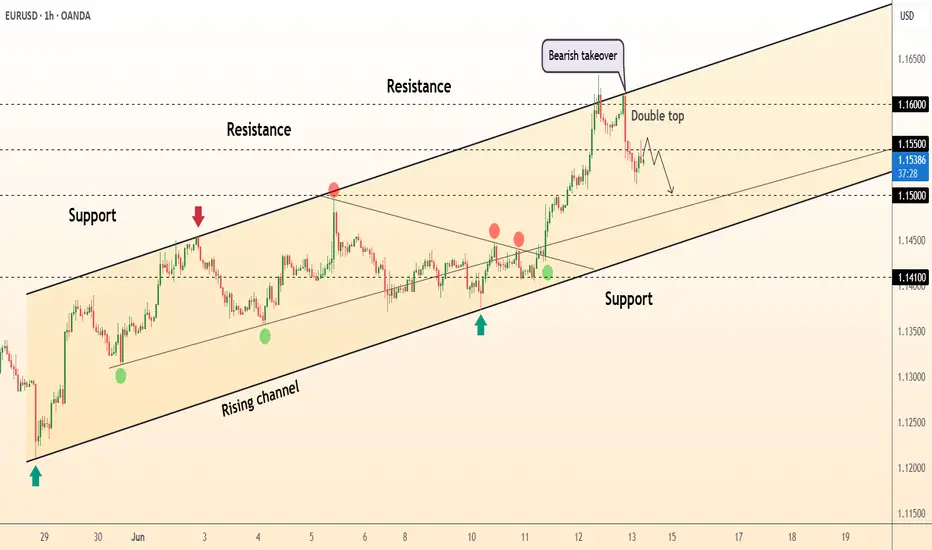
DeGRAM | EURUSD formed the double top📊 Technical Analysis
● A double-top printed at the channel roof (≈ 1.1600) and a bearish engulfing candle signal exhaustion; price is slipping back inside last week’s inner trend-median, turning 1.1550 into fresh resistance.
● Hourly RSI diverged lower and the grey return line from 1 June has broken; pattern depth points to 1.1500 support, with the channel mid-band / former triangle apex near 1.1470 as the next magnet.
💡 Fundamental Analysis
● Post-CPI profit-taking meets cautious ECB rhetoric: Lagarde reiterated “no preset easing path,” yet money-markets still price two Fed cuts by year-end, inviting near-term dollar reprieve.
✨ Summary
Short 1.1540-1.1560; break below 1.1520 targets 1.1500 → 1.1470. Bear view void on an H1 close above 1.1600.
-------------------
Share your opinion in the comments and support the idea with like. Thanks for your support!
EURUSD SHORT FORECAST Q2 W25 D16 Y25EURUSD SHORT FORECAST Q2 W25 D16 Y25
Professional Risk Managers👋
Welcome back to another FRGNT chart update📈
Diving into some Forex setups using predominantly higher time frame order blocks alongside confirmation breaks of structure.
Let’s see what price action is telling us today!
💡Here are some trade confluences📝
✅Weekly order block
✅15' order block
✅1 hour order block
✅Tokyo ranges to be filled
🔑 Remember, to participate in trading comes always with a degree of risk, therefore as professional risk managers it remains vital that we stick to our risk management plan as well as our trading strategies.
📈The rest, we leave to the balance of probabilities.
💡Fail to plan. Plan to fail.
🏆It has always been that simple.
❤️Good luck with your trading journey, I shall see you at the very top.
🎯Trade consistent, FRGNT X

Bullish continuation?The Fiber (EUR/USD) is falling towards the pivot which acts as a pullback support and could bounce to the 1st resistance that lines up with the 127.2% Fibonacci resistance.
Pivot: 1.1447
1st Support: 1.1210
1st Resistance: 1.1712
Risk Warning:
Trading Forex and CFDs carries a high level of risk to your capital and you should only trade with money you can afford to lose. Trading Forex and CFDs may not be suitable for all investors, so please ensure that you fully understand the risks involved and seek independent advice if necessary.
Disclaimer:
The above opinions given constitute general market commentary, and do not constitute the opinion or advice of IC Markets or any form of personal or investment advice.
Any opinions, news, research, analyses, prices, other information, or links to third-party sites contained on this website are provided on an "as-is" basis, are intended only to be informative, is not an advice nor a recommendation, nor research, or a record of our trading prices, or an offer of, or solicitation for a transaction in any financial instrument and thus should not be treated as such. The information provided does not involve any specific investment objectives, financial situation and needs of any specific person who may receive it. Please be aware, that past performance is not a reliable indicator of future performance and/or results. Past Performance or Forward-looking scenarios based upon the reasonable beliefs of the third-party provider are not a guarantee of future performance. Actual results may differ materially from those anticipated in forward-looking or past performance statements. IC Markets makes no representation or warranty and assumes no liability as to the accuracy or completeness of the information provided, nor any loss arising from any investment based on a recommendation, forecast or any information supplied by any third-party.
