EUR/USD Drifts Lower as Dollar ReboundsEUR/USD is struggling to hold onto Thursday’s rebound from the 1.1200 region—its lowest in nearly 10 days—and trades with a slight bearish bias in Friday’s Asian session. The pair is hovering near the mid-1.1300s, down around 0.15% on the day.
The US Dollar regained some ground due to renewed safe-haven demand after a federal appeals court reinstated former President Trump’s broad trade tariffs, injecting fresh uncertainty into the markets. However, the dollar’s momentum remains limited by concerns over the US fiscal outlook and expectations of Fed rate cuts in 2025.
The euro finds partial support as Trump postponed tariffs on EU imports. Market focus now shifts to the upcoming US PCE inflation data, which may influence Fed policy expectations, followed by next Thursday’s ECB meeting for further direction.
Resistance is seen at 1.1400, with higher levels at 1.1460 and 1.1500. Support is located at 1.1300, followed by 1.1260 and 1.1210.
EURUSD

GBPUSD BULLISH OR BEARISH DETAILED ANALYSIS ??GBPUSD has successfully completed its retest of the 1.34300–1.34500 support zone and is now showing strong signs of resuming its bullish momentum. The recent structure confirms a classic bullish continuation pattern, as price bounced cleanly off a critical support level that previously acted as resistance. This level has now flipped into a solid demand zone, giving buyers confidence to push toward the 1.40000 psychological target. Price action continues to respect the uptrend with higher lows forming since mid-April, suggesting strength and institutional accumulation.
From a macroeconomic perspective, the British pound remains fundamentally supported. Recent UK inflation data surprised to the upside, causing the market to delay rate cut expectations from the Bank of England. In contrast, the US dollar is weakening due to rising expectations that the Federal Reserve could initiate rate cuts later this year as inflation cools and labor market data softens. This divergence in policy outlooks between the BoE and the Fed is fueling bullish pressure on GBPUSD, making the 1.40000 level a realistic and high-probability target.
Technical confluence also supports this bullish wave. Fibonacci retracement levels drawn from the recent swing low to the high align closely with the support zone at 1.34300, which acted as a perfect retest before the next leg higher. Additionally, the bullish engulfing candles and consistent daily closes above the support level add further confirmation to the upside bias. As long as the pair holds above 1.34300, the structure favors bulls with strong momentum to test and potentially break the 1.38000 intermediate level on the way to 1.40000.
GBPUSD remains a high-confidence bullish opportunity, aligning both technically and fundamentally. The recent breakout and retest phase is complete, and the pair now appears poised for a sustained rally. With bullish market sentiment, favorable UK data, and USD softness across the board, this setup offers an excellent risk-to-reward ratio for medium-term swing traders targeting the 1.40000 zone.

EURUSD – Bullish trend at risk amid PCE and technical pressureEURUSD has just reached the 1.13860 resistance zone – a confluence with the previous peak and former supply area. A weak rebound and a rounding top pattern are gradually forming, indicating weakening buying momentum. The 34 and 89 EMAs on the H4 chart add further pressure from a technical perspective.
If the price continues to be rejected at 1.13860, it may drop toward 1.12670 – which aligns with the ascending trendline support. A break below this level would confirm a clearer bearish trend.
The upcoming Core PCE data is forecasted to rise – indicating inflation remains elevated. This raises the likelihood that the Fed will maintain high interest rates for longer, supporting the USD and weighing on EURUSD.

EUR/USD May Face Minor Pullback Amid USD Strength📊 Market Overview:
EUR/USD is trading around 1.1330, slightly retreating after reaching near 1.1390 earlier this week. The US dollar is strengthening due to robust consumer confidence data and expectations that the Federal Reserve will maintain higher interest rates for an extended period. Meanwhile, the euro faces pressure as investors await upcoming Eurozone inflation data.
📉 Technical Analysis:
• Key Resistance: 1.1390
• Nearest Support: 1.1255
• EMA: Price remains above the 9-day EMA, indicating the uptrend is still intact.
• RSI: Near 60, suggesting mild overbought conditions.
• MACD: Forming a bearish crossover, signaling potential short-term correction.
📌 Outlook:
EUR/USD may continue to pull back in the short term if it fails to break above the 1.1390 resistance and the US dollar maintains its strength.
💡 Suggested Trading Strategy:
Sell EUR/USD at: 1.1380 – 1.1390
🎯 Take Profit: 1.1255
❌ Stop Loss: 1.1420
Buy EUR/USD at: 1.1255
🎯 Take Profit: 1.1350
❌ Stop Loss: 1.1215

30.05.25 Morning ForecastPairs on Watch -
FX:EURUSD
A short overview of the instruments I am looking at for today, multi-timeframe analysis down to what I will be looking at for an entry. Enjoy!

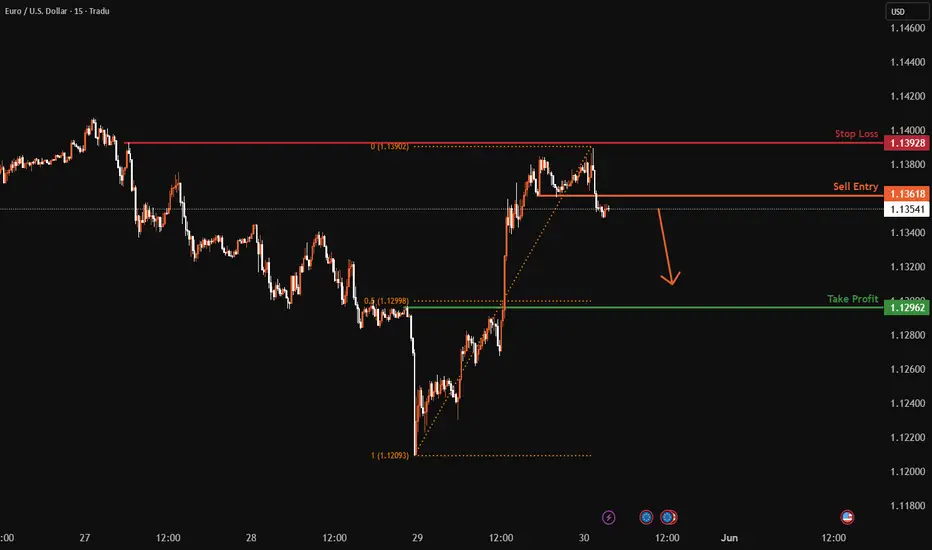
EURUSD M15 I Bearish Drop Based on the H4 chart, the price is rising toward our sell entry level at 1.1361, a pullback resistance.
Our take profit is set at 1.1296, a pullback support that aligns close the 61.8% Fibo retracement.
The stop loss is set at 1.1392 a swing high resistance.
High Risk Investment Warning
Trading Forex/CFDs on margin carries a high level of risk and may not be suitable for all investors. Leverage can work against you.
Stratos Markets Limited (tradu.com ):
CFDs are complex instruments and come with a high risk of losing money rapidly due to leverage. 63% of retail investor accounts lose money when trading CFDs with this provider. You should consider whether you understand how CFDs work and whether you can afford to take the high risk of losing your money.
Stratos Europe Ltd (tradu.com ):
CFDs are complex instruments and come with a high risk of losing money rapidly due to leverage. 63% of retail investor accounts lose money when trading CFDs with this provider. You should consider whether you understand how CFDs work and whether you can afford to take the high risk of losing your money.
Stratos Global LLC (tradu.com ):
Losses can exceed deposits.
Please be advised that the information presented on TradingView is provided to Tradu (‘Company’, ‘we’) by a third-party provider (‘TFA Global Pte Ltd’). Please be reminded that you are solely responsible for the trading decisions on your account. There is a very high degree of risk involved in trading. Any information and/or content is intended entirely for research, educational and informational purposes only and does not constitute investment or consultation advice or investment strategy. The information is not tailored to the investment needs of any specific person and therefore does not involve a consideration of any of the investment objectives, financial situation or needs of any viewer that may receive it. Kindly also note that past performance is not a reliable indicator of future results. Actual results may differ materially from those anticipated in forward-looking or past performance statements. We assume no liability as to the accuracy or completeness of any of the information and/or content provided herein and the Company cannot be held responsible for any omission, mistake nor for any loss or damage including without limitation to any loss of profit which may arise from reliance on any information supplied by TFA Global Pte Ltd.
The speaker(s) is neither an employee, agent nor representative of Tradu and is therefore acting independently. The opinions given are their own, constitute general market commentary, and do not constitute the opinion or advice of Tradu or any form of personal or investment advice. Tradu neither endorses nor guarantees offerings of third-party speakers, nor is Tradu responsible for the content, veracity or opinions of third-party speakers, presenters or participants.
Bearish reversal off pullback resistance?The Fiber (EUR/USD) is rising towards the pivot and could reverse to the support.
Pivot: 1.1424
1st Support: 1.1237
1st Resistance: 1.1555
Risk Warning:
Trading Forex and CFDs carries a high level of risk to your capital and you should only trade with money you can afford to lose. Trading Forex and CFDs may not be suitable for all investors, so please ensure that you fully understand the risks involved and seek independent advice if necessary.
Disclaimer:
The above opinions given constitute general market commentary, and do not constitute the opinion or advice of IC Markets or any form of personal or investment advice.
Any opinions, news, research, analyses, prices, other information, or links to third-party sites contained on this website are provided on an "as-is" basis, are intended only to be informative, is not an advice nor a recommendation, nor research, or a record of our trading prices, or an offer of, or solicitation for a transaction in any financial instrument and thus should not be treated as such. The information provided does not involve any specific investment objectives, financial situation and needs of any specific person who may receive it. Please be aware, that past performance is not a reliable indicator of future performance and/or results. Past Performance or Forward-looking scenarios based upon the reasonable beliefs of the third-party provider are not a guarantee of future performance. Actual results may differ materially from those anticipated in forward-looking or past performance statements. IC Markets makes no representation or warranty and assumes no liability as to the accuracy or completeness of the information provided, nor any loss arising from any investment based on a recommendation, forecast or any information supplied by any third-party.

Euraud final forecast!!Good day traders, I’m back with yet another update on EurAud and this time we wanna see price shoots!!

Smart Money waits for the retracement, not the breakout.” TradingView chart for EUR/USD (30-minute )
🧠 Smart Money Concepts (SMC) Breakdown:
🟨 Bullish Zone (Demand)
Marked in yellow, this is the strong demand zone where price recently reversed.
This zone aligns with a potential order block or a liquidity grab.
🟩 Green Box (Potential Re-entry Zone)
This is your optimal trade entry (OTE) zone.
Price is expected to retrace to this zone after facing resistance at the red supply zone.
It aligns with the discount level (below 50% of recent move).
🟥 Red Box (Supply Zone / POI)
Price is currently reacting to this zone.
This may be a short-term rejection point leading to the expected retracement.
🟦 Blue Box (Higher-Timeframe POI / Supply)
A major target zone likely acting as liquidity above swing highs.
If price breaks and holds above red zone, this is the next target for longs.
🟩 Light Green Box (Final Target / Weekly Level)
Likely a weekly supply level or final target for a full bullish expansion.
---
📈 Projection (Dashed Arrows):
1. Short-Term Bearish Move: Price dips into green demand zone.
2. Long Entry from Demand: Potential bullish continuation from green zone to break above red.
3. Target Blue Supply: If red is broken, price will head to the blue zone next.
---
Highlight entry point near green box for 1:3+ RR.
Show retracement plan instead of immediate breakout.
Emphasize liquidity hunt at red zone before continuation.
“
---
Would you like me to do analysis of. Other pair , mention in comments,🖇️

EURUSD: Bullish Megaphone unfolds its new bullish wave.EURUSD just turned bullish on its 1D technical outlook (RSI = 56.015, MACD = 0.004, ADX = 31.789) as it maintains a sustainable short term uptrend through a Bullish Megaphone pattern. The 1D MA50 has assumed the role of the medium term Support and the 3rd bullish wave is already under way. We expect it to repeat at least the previous +2.59% wave, having a TP = 1.14950.
## If you like our free content follow our profile to get more daily ideas. ##
## Comments and likes are greatly appreciated. ##

SHORT ON EUR/USDEUR/USD has pulled back to a major supply zone that previously formed a DOUBLE TOP in that area in the past. (This is technically the re-test)
I have placed a sell limit order in the supply area and I will be expecting EUR/USD to fall past the swing low for over 100 -150 pips.

EURUSD: Move Down Expected! Short!
My dear friends,
Today we will analyse EURUSD together☺️
The price is near a wide key level
and the pair is approaching a significant decision level of 1.13626 Therefore, a strong bearish reaction here could determine the next move down.We will watch for a confirmation candle, and then target the next key level of 1.13164.Recommend Stop-loss is beyond the current level.
❤️Sending you lots of Love and Hugs❤️

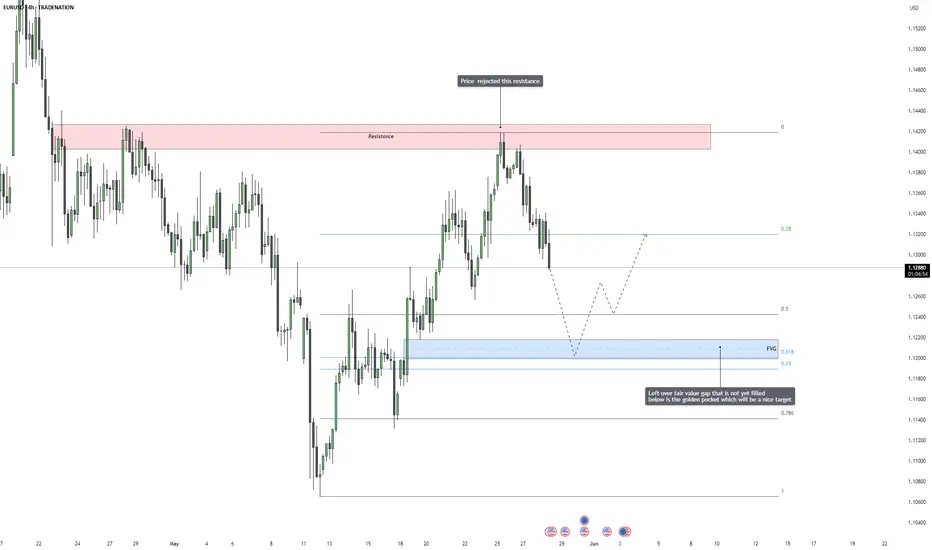
EURUSD – Bearish Reversal in Motion, Fair Value Gap Draws Price EURUSD has recently reacted strongly to a major resistance zone, where price previously stalled and reversed in the past. After running into this area again, we saw a sharp and immediate rejection, which confirms the presence of aggressive selling pressure. This rejection was not just a weak pullback, but a strong displacement candle that shows real intent from institutional participants.
This kind of price action is typically a sign that the market has found a short-term top, and will now look to rebalance lower, especially if there are inefficiencies left behind during the last move up. With the rejection now confirmed and price starting to rotate lower, the odds increase that we see a deeper retracement in the coming sessions.
Resistance Reaction and Liquidity Story
The price reached into a well-defined supply area and rejected cleanly. This level was likely filled with buy-side liquidity from breakout traders and late longs, which institutions needed in order to fill their sell orders. After sweeping above the previous highs and triggering breakout entries, price snapped back below, creating a shift in short-term structure.
That move also created a market imbalance, a price inefficiency that the market tends to come back and correct. With bullish liquidity absorbed at the highs, price is now looking for sell-side liquidity, which can typically be found below the previous higher lows and inside unfilled value areas.
Fair Value Gap and Fibonacci Confluence
Below the current market, we have a clean fair value gap that was left behind during the most recent impulsive bullish move. What makes this area even more attractive is that it overlaps perfectly with the golden pocket zone, the 0.618 to 0.65 Fibonacci retracement level. This confluence creates a high-probability target area, not just because of the imbalance, but also because this level acts as a common retracement zone where institutional traders often look to reaccumulate or exit short-term positions.
This area is also likely to hold resting liquidity from traders who placed stop losses under recent higher lows. All these factors combined make the fair value gap plus golden pocket area a natural draw for price, the market tends to gravitate toward these zones when there’s unfinished business left behind.
Expectations and Potential Development
Going forward, I expect price to continue bleeding lower in a controlled fashion, possibly forming minor lower highs along the way. Once the fair value gap is reached and filled, we could see signs of support or accumulation, depending on the context at the time. It’s important not to blindly long from that area, but instead wait for a market reaction, ideally a shift in structure on the lower timeframes, to signal that buyers are stepping back in.
If the market holds that area and confirms support, it could launch a new leg higher. However, if the fair value gap fails and price continues to break down, it would signal that this move is not just a retracement but possibly the start of a larger bearish leg.
Conclusion
The rejection from resistance has opened the door for a deeper retracement. With a clear fair value gap and Fibonacci golden pocket below, the market now has a logical destination to correct toward. This level offers a clean narrative for continuation lower, and it aligns with both price action structure and algorithmic models. Patience is key now, the best opportunities come when price delivers into clean zones like this one.
Disclosure: I am part of Trade Nation's Influencer program and receive a monthly fee for using their TradingView charts in my analysis.
___________________________________
Thanks for your support!
If you found this idea helpful or learned something new, drop a like 👍 and leave a comment, I’d love to hear your thoughts! 🚀
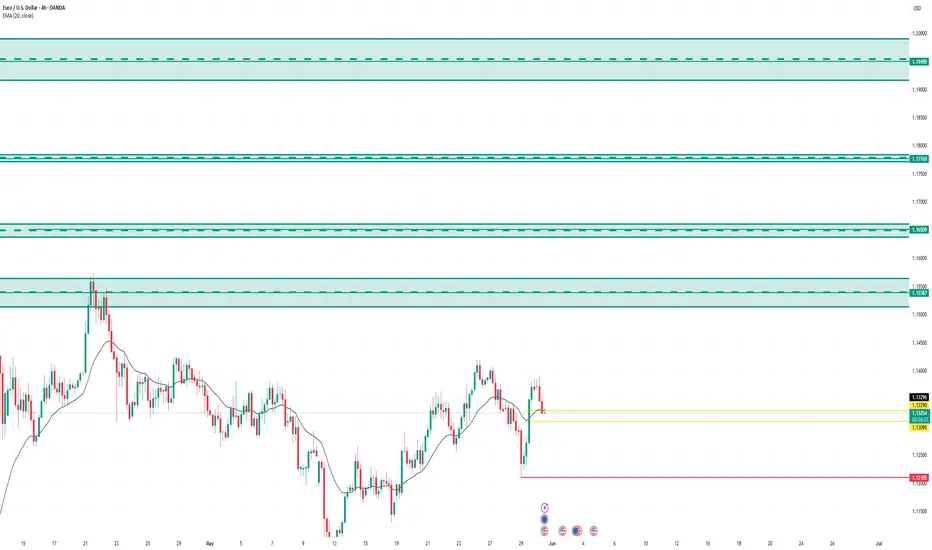
Bullish Breakout in EUR/USD: Key Levels to Watch This WeekHi everyone,
EUR/USD had a strong week, climbing higher from the May 12 low and further reinforcing our view of a potential long-term bullish trend.
We anticipate further upside towards the 1.13768–1.13940 zone, followed by a possible pullback toward the 1.1200 area. We’ll share more updates on the expected path for EUR/USD if and when price reaches that zone.
The longer-term outlook remains bullish, and we expect the rally to extend towards the 1.2000 level, as long as price holds above the 1.10649 support.
We’ll be keeping you updated throughout the week with how we’re managing our active ideas. Thanks again for all the likes/boosts, comments and follows — we appreciate the support!
All the best for the week ahead. Trade safe.
BluetonaFX

EURO - Price can make movement up and then drop to $1.1100 levelHi guys, this is my overview for EURUSD, feel free to check it and write your feedback in comments👊
Some time ago price declined inside a falling channel, where it fell to $1.0735 points and then made an upward impulse.
Price exited from channel and reached $1.1100 level, which it soon broke it and continued to move up.
Later Euro rose to $1.1425 points, and then made a correction, after which, in a short time, price rose higher this level.
After this movement, price turned around and started to decline, breaking $1.1425 level again and entered to flat.
In flat, Euro bounced from $1.1100 level and started to grow inside a flat, and later rose to resistance level.
Recently price started to decline, so I expect that Euro can rise a little and then continue to decline to $1.1100 level.
If this post is useful to you, you can support me with like/boost and advice in comments❤️
Disclaimer: As part of ThinkMarkets’ Influencer Program, I am sponsored to share and publish their charts in my analysis.

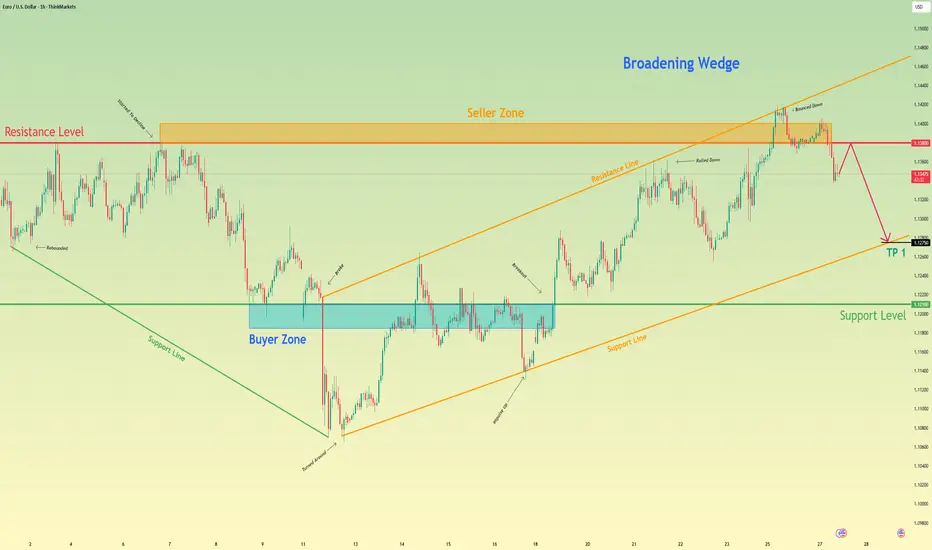
Euro may grow to resistance level and then drop to 1.1275 pointsHello traders, I want share with you my opinion about Euro. After forming a strong upward move from the buyer zone (1.11850–1.1210), the price rose sharply, broke the mid-range resistance, and entered the seller zone between 1.1380 and 1.1400. Once it reached the upper boundary of the broadening wedge, the price bounced down from resistance at 1.1380. Now the price is trading inside a broadening wedge, showing signs of a potential reversal. After failing to hold above resistance, the Euro started to decline from the seller zone, confirming selling pressure. The current movement points to a correction within the wedge structure. I expect the Euro will continue falling toward 1.1275, my TP 1, where the support line of the wedge coincides with the upper boundary of the previous buyer zone. This zone has already shown strong reactions before and could act as a short-term reversal area. Given the recent rejection from resistance, the broadening wedge formation, and return from the seller zone, I remain bearish and anticipate further decline. Please share this idea with your friends and click Boost 🚀
Disclaimer: As part of ThinkMarkets’ Influencer Program, I am sponsored to share and publish their charts in my analysis.
EURUSD My Opinion! BUY!
My dear friends,
Please, find my technical outlook for EURUSD below:
The price is coiling around a solid key level - 1.1282
Bias - Bullish
Technical Indicators: Pivot Points Lowanticipates a potential price reversal.
Super trend shows a clear buy, giving a perfect indicators' convergence.
Goal - 1.1325
About Used Indicators:
The pivot point itself is simply the average of the high, low and closing prices from the previous trading day.
Disclosure: I am part of Trade Nation's Influencer program and receive a monthly fee for using their TradingView charts in my analysis.
———————————
WISH YOU ALL LUCK

EURUSD PLAN – Is the Rebound Just a Pause Before the Drop? EURUSD PLAN – Is the Rebound Just a Pause Before the Drop? | All Eyes on PCE
📊 MACRO OUTLOOK:
Following the latest FOMC meeting, the Fed kept interest rates unchanged, as expected, but maintained a hawkish tone. Chair Powell reiterated that inflation remains too sticky to consider rate cuts in the near term.
Markets now await this week’s US PCE data — the Fed’s preferred inflation gauge — which could provide the next major catalyst for USD strength or weakness.
On the Euro side, weak consumer confidence and tepid growth have strengthened expectations for an ECB rate cut in June. This divergence in monetary policy is weighing on the Euro, as the Dollar finds new demand amid global risk recalibration.
📉 TECHNICAL OUTLOOK (H1):
EURUSD has broken down from recent highs near 1.1412 and is now forming a bearish retracement pattern.
Price has broken below the 89-EMA and 200-EMA, signaling bearish structure.
Current price action suggests a temporary bounce from the 1.1260–1.1280 support zone (Fibo 38.2%–50%), but the broader trend remains bearish.
Fibonacci retracement from recent swing lows highlights 1.1338 and 1.1372 as key resistance levels to watch.
🔑 KEY TECHNICAL ZONES:
Resistance Zones:
• 1.1313 – Minor intraday level (Fibo 0.5)
• 1.1338 – EMA confluence + former structure
• 1.1372 – Major rejection zone (previous distribution top)
Support Zones:
• 1.1280 – 1.1260 – Current support bounce area
• 1.1220 – Key liquidity sweep zone
🧭 TRADE STRATEGY:
Scenario A – Sell the Pullback:
• Wait for a rebound into the 1.1313 – 1.1338 zone
• Enter SELL if bearish rejection forms
• SL: 1.1376
• TP: 1.1280 → 1.1260 → 1.1220
Scenario B – Invalid Breakout:
• If price breaks above 1.1372 with momentum, this plan is invalidated — wait for a confirmed breakout retest.
Scenario C – Reactive Buy Scalp:
• If price shows strong rejection from 1.1260 again, scalpers may consider a temporary BUY back toward 1.1300–1.1310
• This is high-risk and counter-trend.
⚠️ STRATEGIC NOTES:
EURUSD remains in a bearish bias until major resistance levels are broken. With PCE data approaching, volatility is likely. Trade setups should be based on confirmation signals and managed tightly as macro data can shift momentum rapidly.

EURUSD – Technical rebound, but bearish pressure still loomsAfter a sharp drop to the support zone around 1.12255, EURUSD has made a mild recovery and is now retesting the 1.13360 resistance area – which aligns with both the 34 and 89 EMAs. This confluence zone could trigger renewed selling pressure if price fails to break above.
The 3-hour chart shows a zigzag-like recovery forming, but each new high is still lower than the previous one – indicating that the downtrend remains intact. If EURUSD continues to struggle at this resistance, it is likely to reverse and retest the 1.11910 support area.
On the news front, markets are awaiting CPI data from both the Eurozone and the U.S. this week. If U.S. inflation comes in higher than expected, the dollar may continue to strengthen – increasing short-term downside pressure on EURUSD.

EURUSD Tests 200-Hour SMA After 1.1425 RejectionEURUSD is sitting on the 200-hour simple moving average after failing to break the 1.1425 resistance. The implementation and then postponement of the proposed 50% tariffs on Europe added to short-term volatility. Formal trade talks between the EU and US are expected to begin soon.
A green trend channel has now formed, with previously tested key support and resistance levels continuing to play a major role. EURUSD tends to test these key points at the same time with the trendlines. The next major level to watch is 1.1275, which aligns closely with the lower bound of the channel. As long as this level holds, a bullish reaction is possible. To the upside, 1.1375–1.1425 remains the critical resistance zone.
If 1.1275 breaks, downside targets could include 1.1215 in the short term and the broader 1.1050–1.11 zone over the medium term.

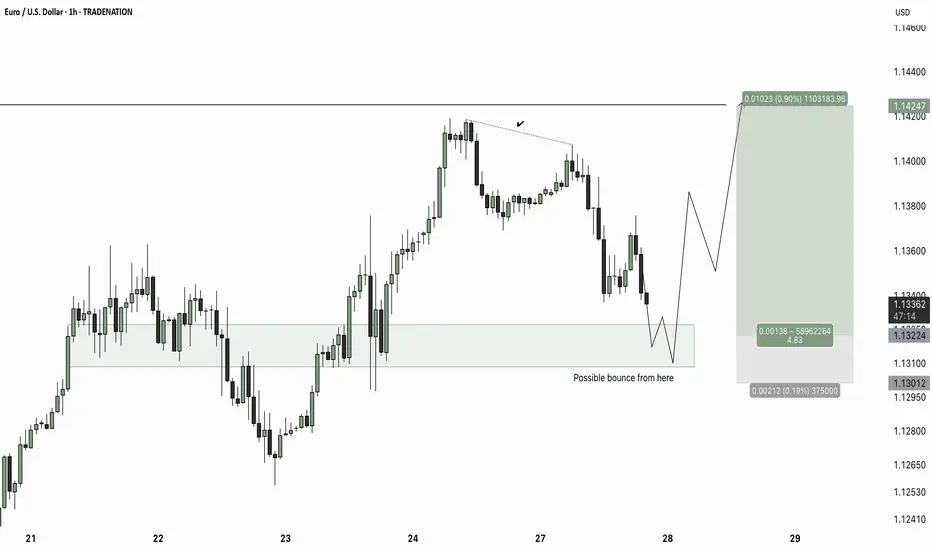
EUR/USD – Potential Short-Term TradeTime Frame: 1H
Bias: Long (Bullish Reversal Expected)
Setup Type: Reversal from Flip Zone
Date: May 27, 2025
🔍 Market Context:
The price is currently retracing after forming a short-term lower high.
It has entered a prior demand zone (highlighted box) that acted as resistance-turned-support — a classic flip zone.
The market has shown responsiveness to this zone in the past (bounces seen on May 22–23 and again on May 24), suggesting strong buyer interest remains here.
📌 Key Levels:
Interest Zone for Longs: 1.1300 – 1.1320
This is where buyers are expected to step in again. Look for bullish price action confirmation in this zone before entry.
Entry Trigger: Bullish engulfing, strong wick rejection, or bullish divergence within the demand zone.
Target Zone: 1.1424
A clean 90-pip move (approx. 0.90%) from the entry zone — aligns with the previous high and liquidity pool.
Stop Loss: Below 1.1300 (e.g., 1.1288)
To protect against deeper sweeps of the zone.
Risk-Reward: ~1:5
Excellent R:R if price reacts cleanly from the flip zone.
📈 Trade Idea Summary:
Buy EUR/USD around 1.130–1.132
Stop Loss: 1.1288
Take Profit: 1.1424
R:R Ratio: ~1:4.8
Confirmation Needed: Bullish candlestick pattern or rejection wick in the zone.
⚠️ Note:
If price slices cleanly through 1.1300 without wicks or slowing down, invalidate the setup — wait for a deeper retest or a fresh demand zone to form.
⚠️ Disclaimer
This post is purely for educational purposes. I am not a financial advisor, and nothing here should be taken as financial advice. Always consult your financial advisor before making any investment or trading decisions. Or at the very least, consult your cat. 🐱
EURUSD H4 | Bearish Reversal Based on the H4 chart, the price is approaching our sell entry level at 1.1286, a pullback resistance.
Our take profit is set at 1.1197, a pullback support.
The stop loss is set at 1.1363, a pullback resistance.
High Risk Investment Warning
Trading Forex/CFDs on margin carries a high level of risk and may not be suitable for all investors. Leverage can work against you.
Stratos Markets Limited (tradu.com ):
CFDs are complex instruments and come with a high risk of losing money rapidly due to leverage. 63% of retail investor accounts lose money when trading CFDs with this provider. You should consider whether you understand how CFDs work and whether you can afford to take the high risk of losing your money.
Stratos Europe Ltd (tradu.com ):
CFDs are complex instruments and come with a high risk of losing money rapidly due to leverage. 63% of retail investor accounts lose money when trading CFDs with this provider. You should consider whether you understand how CFDs work and whether you can afford to take the high risk of losing your money.
Stratos Global LLC (tradu.com ):
Losses can exceed deposits.
Please be advised that the information presented on TradingView is provided to Tradu (‘Company’, ‘we’) by a third-party provider (‘TFA Global Pte Ltd’). Please be reminded that you are solely responsible for the trading decisions on your account. There is a very high degree of risk involved in trading. Any information and/or content is intended entirely for research, educational and informational purposes only and does not constitute investment or consultation advice or investment strategy. The information is not tailored to the investment needs of any specific person and therefore does not involve a consideration of any of the investment objectives, financial situation or needs of any viewer that may receive it. Kindly also note that past performance is not a reliable indicator of future results. Actual results may differ materially from those anticipated in forward-looking or past performance statements. We assume no liability as to the accuracy or completeness of any of the information and/or content provided herein and the Company cannot be held responsible for any omission, mistake nor for any loss or damage including without limitation to any loss of profit which may arise from reliance on any information supplied by TFA Global Pte Ltd.
The speaker(s) is neither an employee, agent nor representative of Tradu and is therefore acting independently. The opinions given are their own, constitute general market commentary, and do not constitute the opinion or advice of Tradu or any form of personal or investment advice. Tradu neither endorses nor guarantees offerings of third-party speakers, nor is Tradu responsible for the content, veracity or opinions of third-party speakers, presenters or participants.
