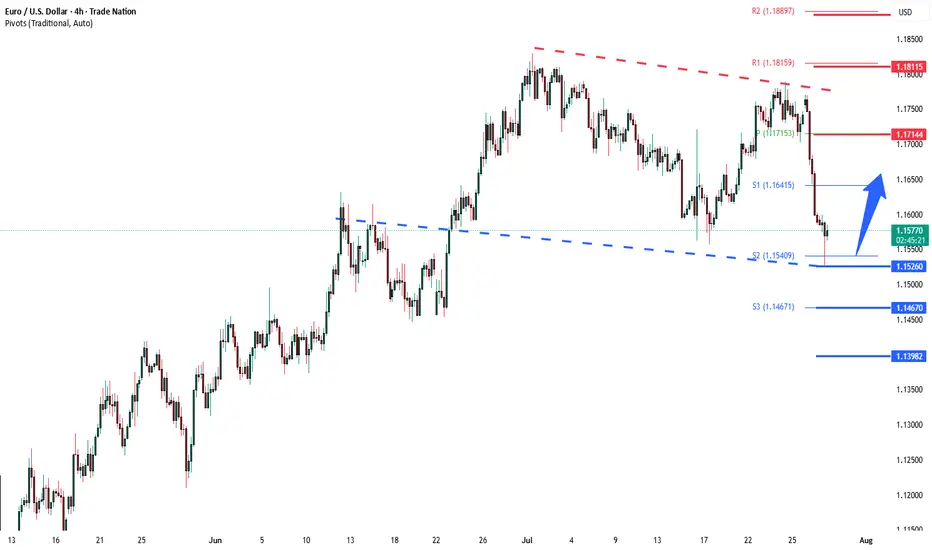
EUR/USD BULLISH BIAS RIGHT NOW| LONG
Hello, Friends!
EUR/USD pair is in the uptrend because previous week’s candle is green, while the price is obviously falling on the 1D timeframe. And after the retest of the support line below I believe we will see a move up towards the target above at 1.179 because the pair is oversold due to its proximity to the lower BB band and a bullish correction is likely.
Disclosure: I am part of Trade Nation's Influencer program and receive a monthly fee for using their TradingView charts in my analysis.
✅LIKE AND COMMENT MY IDEAS✅
EURUSD

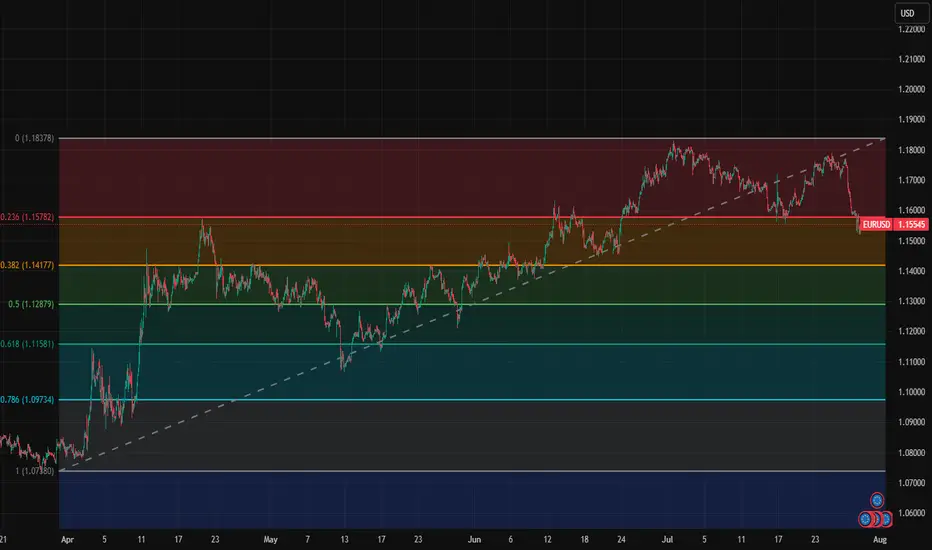
EurUsd short term key levelsThese are short term key levels for intra day and swing trading on 1h chart.
1.0718
1.0973
1.1158
1.1288
1.1418
1.1578
1.1838
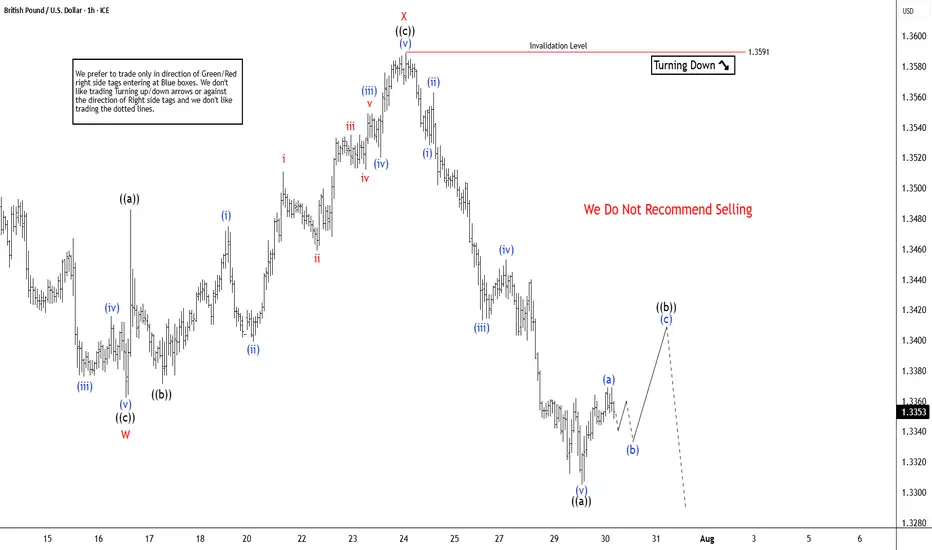
GBPUSD Elliott Wave Insight Bounce Should Fail Into Support ZoneThe GBPUSD is trading in higher high sequence from 9.22.2022 low in weekly. The bounce is corrective Elliott Wave sequence & expect further upside. It favors pullback in proposed 7 swings from 7.01.2025 high & extend into 1.3162 – 1.2898 area, while below 7.23.2025 high. It should find buyers into extreme area for next leg higher in daily or at least 3 swings bounce. In 4-hour, it started correcting lower from 7.01.2025 high. It ended W at 1.3362 low of 7.16.2025 & X at 1.3589 high of 7.23.2025 each in 3 swings. Below X high, it favors downside in Y in 3 swings as it broke below 7.16.2025 low, expecting into extreme area. Within W, it ended ((a)) at 1.3523 low, ((b)) at 1.3620 high & ((c)) at 1.3362 low. Above there, it placed ((a)) at 1.3486 high, ((b)) at 1.3371 low & ((c)) as X connector at 1.3589 high. The double correction unfolds in 3-3-3 structure, which will complete, when current bounce fails below 7.23.2025 high to new low into extreme area. It ended ((a)) of Y into 0.618 – 0.764 Fibonacci extension area of W & expect 3 or 7 swings bounce in ((b)).
Below X high, it placed ((a)) of Y at 1.3305 low & favors bounce in ((b)) in 3 or 7 swings against 7.23.2025 high. Within ((a)), it ended (i) at 1.3528 low, (ii) at 1.3563 high, (iii) at 1.3413 low, (iv) at 1.3543 high & (v) at 1.3305 low. Above there, it favors bounce in (a) of ((b)) and expect small upside before it should pullback in (b). The next pullback in (b) should stay above 1.3305 low choppy price action before continue upside in (c). Ideally, ((b)) can bounce between 1.3413 – 1.3481 area as 0.382 – 0.618 Fibonacci retracement of ((a)) before continuing lower. Wave ((b)) bounce expect to fail below 1.3591 high before extending lower in ((c)) into 1.3162 – 1.2898 to finish double correction. Because of higher high in daily since September-2022 low, it should find buyers in extreme area to resume higher. It expects sideways to higher until FOMC event followed by selloff, while bounce fail below 7.23.2025 high. We like to buy the pullback into extreme area for next leg higher or at least 3 swings reaction.
EUR/USD Slips Again – Just a Pullback or More to Come?Hey everyone! Great to have you back for another market chat today.
As of writing, EUR/USD remains under significant bearish pressure, currently trading near 1.154 — marking a rather gloomy start to the new trading week. The euro is clearly struggling to attract buying interest as traders reassess the ECB’s stance and digest the newly announced EU–US trade agreement. Meanwhile, the U.S. dollar is gaining momentum, flipping the trend unexpectedly.
From a technical perspective, EUR/USD is showing clear weakness. The pair has broken below both its rising wedge and previous uptrend line, with candles closing firmly lower — a strong sign that the bears are in control.
In my personal view, I expect EUR/USD to continue sliding toward the next two support zones, although a minor pullback could occur first as part of a typical correction.
But what do you think? Is this just a dip… or the start of something bigger for EUR/USD? Let me know your take in the comments!

The euro extends sharp losses following the US-EU tariff deal
The euro weakened sharply against the dollar amid views that the US-EU tariff deal favors the US. European leaders voiced mixed reactions. Germany’s Chancellor Merz welcomed the agreement as a safeguard against economic damage, while Hungary’s PM Orbán criticized it as a one-sided win for the US. Meanwhile, the IMF raised its eurozone growth forecast from 0.8% to 1.0% in its July outlook, citing the lower-than-expected tariff levels as supportive of the region’s economy.
EURUSD broke below the ascending trendline and briefly tested the support at 1.1520. EMA21 has death-crossed EMA78, indicating the potential extension of bearish momentum.
If EURUSD fails to hold above the support at 1.1520, the price could decline further toward 1.1450. Conversely, if EURUSD breaches above the resistance at 1.1590, the price may gain upward momentum toward 1.1640.

Bullish reversal off pullback support?The Fiber (EUR/USD) has bounced off the pivot, which is a pullback support, and could rise to the 1st resistance, which is a pullback resistance.
Pivot: 1.1537
1st Support: 1.1456
1st Resistance: 1.1659
Risk Warning:
Trading Forex and CFDs carries a high level of risk to your capital and you should only trade with money you can afford to lose. Trading Forex and CFDs may not be suitable for all investors, so please ensure that you fully understand the risks involved and seek independent advice if necessary.
Disclaimer:
The above opinions given constitute general market commentary, and do not constitute the opinion or advice of IC Markets or any form of personal or investment advice.
Any opinions, news, research, analyses, prices, other information, or links to third-party sites contained on this website are provided on an "as-is" basis, are intended only to be informative, is not an advice nor a recommendation, nor research, or a record of our trading prices, or an offer of, or solicitation for a transaction in any financial instrument and thus should not be treated as such. The information provided does not involve any specific investment objectives, financial situation and needs of any specific person who may receive it. Please be aware, that past performance is not a reliable indicator of future performance and/or results. Past Performance or Forward-looking scenarios based upon the reasonable beliefs of the third-party provider are not a guarantee of future performance. Actual results may differ materially from those anticipated in forward-looking or past performance statements. IC Markets makes no representation or warranty and assumes no liability as to the accuracy or completeness of the information provided, nor any loss arising from any investment based on a recommendation, forecast or any information supplied by any third-party.

EUR/USD: The Last Bear Standing...As indicated on my previous EUR/USD idea ( that's still currently open ), I remain short EUR/USD given the technical aspect of things are still valid.
Divergences are still in play along with a rising broadening pattern and the fact that we're trading at the yearly R3 level ( which is rare ).
I suspect we will have some volatility with the ECB press conference tomorrow, so that should get things moving hopefully in the bearish direction. If we begin trading aggressively above 1.1800+, that will invalidate the short idea overall.
If we roll over, I'm still looking for 1.13000 - 1.12000 as the target range for Q3 going into Q4.
We'll see how this all develops.
As always, Good Luck & Trade Safe!

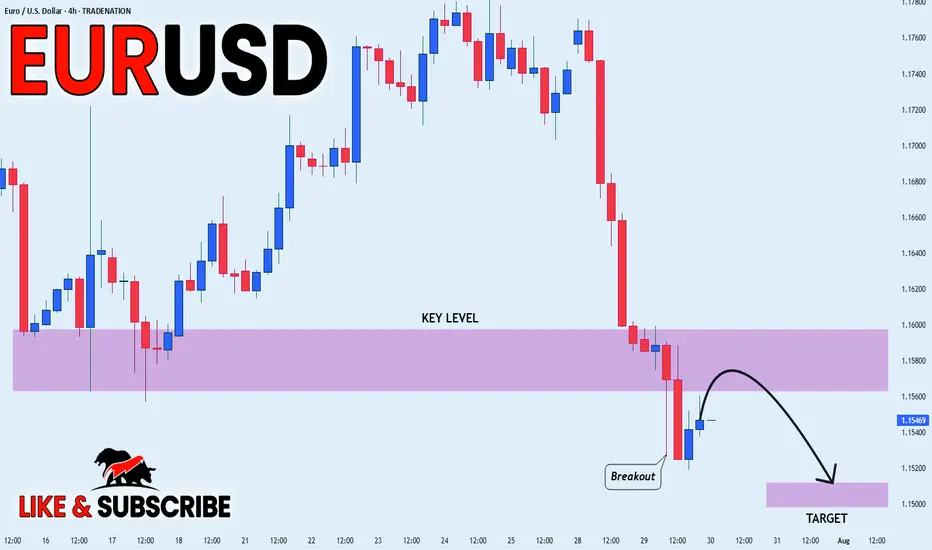
EUR_USD BEARISH BREAKOUT|SHORT|
✅EUR_USD broke the key
Structure level of 1.1580
While trading in an local downtrend
Which makes me bearish
And I think that after the retest of
The broken level is complete
A bearish continuation will follow
SHORT🔥
✅Like and subscribe to never miss a new idea!✅
Disclosure: I am part of Trade Nation's Influencer program and receive a monthly fee for using their TradingView charts in my analysis.
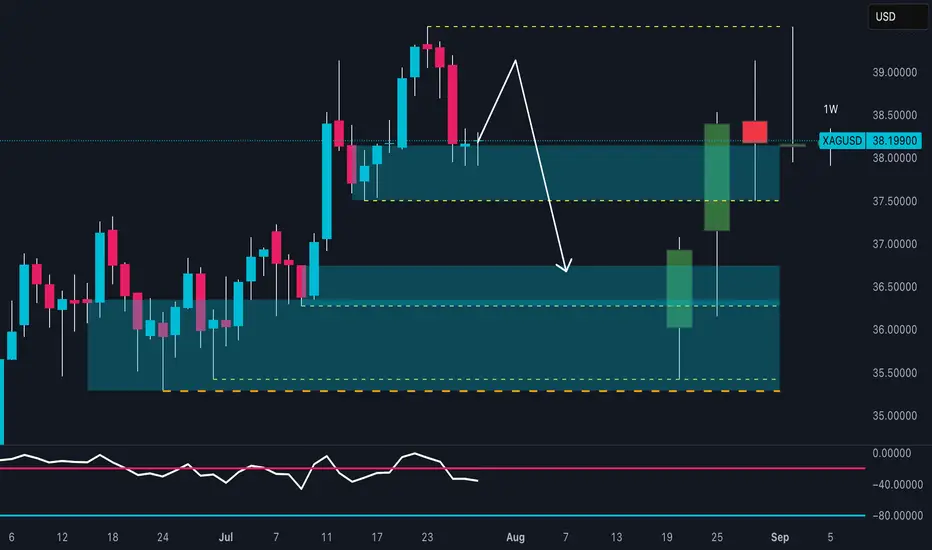
SILVER Is About to Collapse? Watch This Critical Supply Zone!Price recently tapped a high near 39.20 before sharply rejecting from the 38.80–39.20 supply zone, confirming strong selling pressure. The current structure shows:
- Supply zone tested and rejected
- Likely return to the previous demand zone (36.50–36.00)
- RSI is turning down, confirming loss of momentum
A pullback toward 38.30–38.50, followed by a bearish continuation toward the 36.50 area, which acts as a key structural and institutional support.
🗓️ Seasonality
Historically, July is bullish for silver:
Last 5Y average: +0.89%
Last 2Y average: +2.18%
However, August–September are bearish months:
August: mildly positive, but weak
September: consistently negative across all time frames (-0.86% to -1.10%)
This increases the probability of a downward move starting in early August, in line with current price action rejection.
🪙 Commitment of Traders (COT) – July 22
Non-Commercials (speculators):
Longs: +656
Shorts: -516
Commercials (hedging):
Longs: +1,337
Shorts: +916
➡️ Commercials are increasing both long and short exposure, while non-commercials remain net long — a sign of moderate optimism.
However, long positioning is slowing down compared to previous weeks. A potential exhaustion in bullish momentum is forming.
📉 Sentiment
52% short vs 48% long
Volume: more lots on the short side (492 vs 454)
Sentiment remains neutral to slightly contrarian bullish, but not extreme. This may allow for a fake breakout before a deeper move down.
🧩 Operational Summary
Main bias: Bearish short to mid-term (starting August), supported by:
- Technical rejection at supply
- Negative seasonal tendencies ahead
- RSI showing momentum loss
- COT showing stabilization, not accumulation
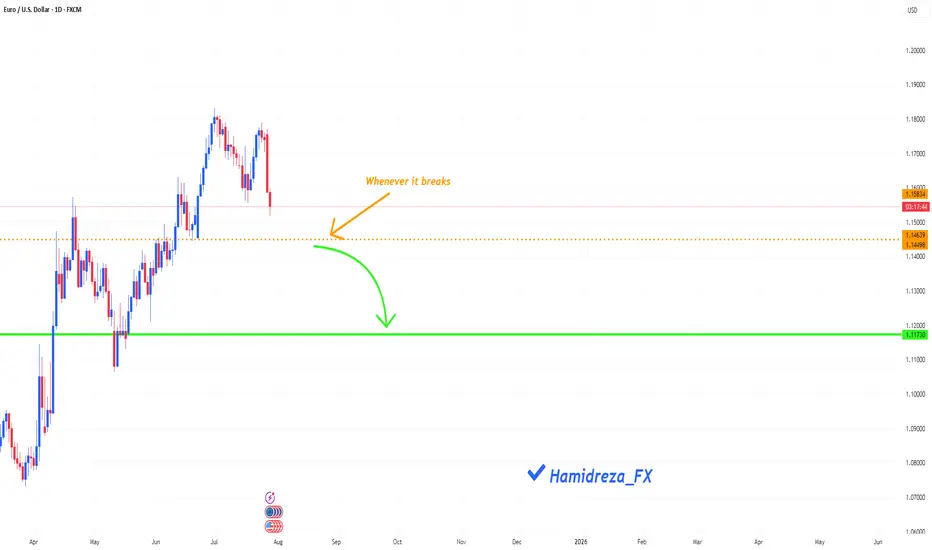
Is the EURUSD in a downtrend?
Hi my dears
It seems that the Eurusd has started a downward and corrective trend, however, the orange line condition must be met in order to enter a good trade with certainty.
I would be happy to hear your opinion.
Bullish reversal?EUR/USD has bounced off the support level, which serves as a pullback support and could rise from this level to our take-profit target.
Entry: 1.1534
Why we like it:
There is a pullback support.
Stop loss: 1.1455
Why we like it:
There is a multi-swing low support.
Take profit: 1.1655
Why we like it:
There is a pullback resistance that aligns with the 50% Fibonacci retracement.
Enjoying your TradingView experience? Review us!
TradingView (www.tradingview.com)
Please be advised that the information presented on TradingView is provided to Vantage (‘Vantage Global Limited’, ‘we’) by a third-party provider (‘Everest Fortune Group’). Please be reminded that you are solely responsible for the trading decisions on your account. There is a very high degree of risk involved in trading. Any information and/or content is intended entirely for research, educational and informational purposes only and does not constitute investment or consultation advice or investment strategy. The information is not tailored to the investment needs of any specific person and therefore does not involve a consideration of any of the investment objectives, financial situation or needs of any viewer that may receive it. Kindly also note that past performance is not a reliable indicator of future results. Actual results may differ materially from those anticipated in forward-looking or past performance statements. We assume no liability as to the accuracy or completeness of any of the information and/or content provided herein and the Company cannot be held responsible for any omission, mistake nor for any loss or damage including without limitation to any loss of profit which may arise from reliance on any information supplied by Everest Fortune Group.

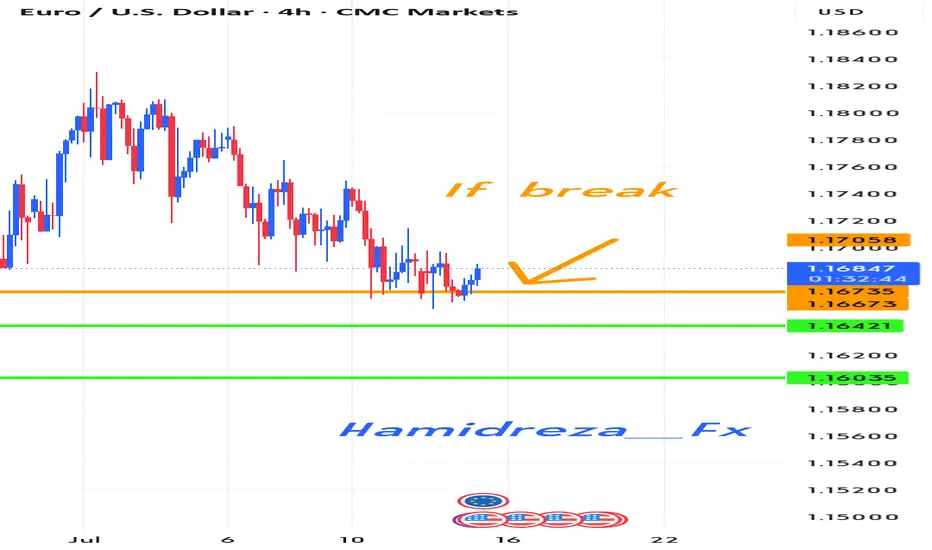
Could something similar happen to the EURUSD?
Hi everyone
We are in a state of downward suffering
This state of suffering seems to continue
Of course, there is a condition that if the condition is met, we will probably see the first and second goals.
DXY Buyers Catching BidSee chart for analysis but even with price sitting inside levels of supply, we could easily see stronger Fundamentals coming out to drive this dollar back up into 100.5 areas of monthly supply. Short-term I remain bullish with long term views to the downside.

EUR/USD Will Continue Melting Be Sure To Be Part Of That!Here is my thought of EURUSD chart today. I think that this pair can go down further more specially after breaking this strong area of support and old resistance. as shown on the chart we can wait for the price to come back again and retest this area once and then this will be the best place to enter a sell trade. I am targeting around 250n pips in this trade. as I said I will wait for a retest and a good bearish price action and from there I will enter a sell trade.

EURUSD: Bullish Continuation is Expected! Here is Why:
Remember that we can not, and should not impose our will on the market but rather listen to its whims and make profit by following it. And thus shall be done today on the EURUSD pair which is likely to be pushed up by the bulls so we will buy!
Disclosure: I am part of Trade Nation's Influencer program and receive a monthly fee for using their TradingView charts in my analysis.
❤️ Please, support our work with like & comment! ❤️

EURUSD: Will Go Up! Long!
My dear friends,
Today we will analyse EURUSD together☺️
The price is near a wide key level
and the pair is approaching a significant decision level of 1.15675 Therefore, a strong bullish reaction here could determine the next move up.We will watch for a confirmation candle, and then target the next key level of 1.16318.Recommend Stop-loss is beyond the current level.
❤️Sending you lots of Love and Hugs❤️

EUR/USD | Sweeps Liquidity and Rebounds – Eyes on 1.16700!By analyzing the EURUSD chart on the 4-hour timeframe, we can see that after our previous analysis, the price continued its decline and eventually swept the liquidity below 1.15580. Following that, strong demand kicked in, and the pair is currently trading around 1.15810. If the price can hold above this level, we can expect further bullish movement. The next potential targets are 1.1600, 1.16280, 1.16430, and 1.16700.
Please support me with your likes and comments to motivate me to share more analysis with you and share your opinion about the possible trend of this chart with me !
Best Regards , Arman Shaban

Euro Drops Hard — Is a 100-Pips Slide Toward 1.1500 Next?Euro’s current situation doesn’t look great — we’re clearly seeing strong selling pressure across the board.
Price has now reached the block zones near 1.1600, and I want to break down what this area means to me.
The lower pivot of the 1.1600 zone was created after the 50% level of the previous bullish leg was consumed — which is typical in many bullish trends. Based on that, we expected a move toward 1.1800 to break the structure and continue the uptrend.
However, the recent bullish move lacked strength, which became quite clear during the last upward leg. And now, after that weak rally, we’re witnessing a sharp and aggressive selloff.
This reaction weakens the 1.1600 block in my eyes — and I’m now watching 1.1500 as the more probable target. It’s a major price level and also aligns with a bank-level midline zone.
In my view, it’s still too early to buy. I’d want to see price range and confirm before looking for longs.
That said, this area could be a good place to partially exit short positions and lock in some profits.
🔁 This analysis will be updated whenever necessary.
Disclaimer: This is not financial advice. Just my personal opinion!!!

EURUSD corrective pullback support at 1.1526The EURUSD remains in a bullish trend, with recent price action showing signs of a corrective pullback within the broader uptrend.
Support Zone: 1.1526 – a key level from previous consolidation. Price is currently testing or approaching this level.
A bullish rebound from 1.1526 would confirm ongoing upside momentum, with potential targets at:
1.1714 – initial resistance
1.1810 – psychological and structural level
1.1885 – extended resistance on the longer-term chart
Bearish Scenario:
A confirmed break and daily close below 1.1526 would weaken the bullish outlook and suggest deeper downside risk toward:
1.1470 – minor support
1.1400 – stronger support and potential demand zone
Outlook:
Bullish bias remains intact while the EURUSD holds above 1.1526. A sustained break below this level could shift momentum to the downside in the short term.
This communication is for informational purposes only and should not be viewed as any form of recommendation as to a particular course of action or as investment advice. It is not intended as an offer or solicitation for the purchase or sale of any financial instrument or as an official confirmation of any transaction. Opinions, estimates and assumptions expressed herein are made as of the date of this communication and are subject to change without notice. This communication has been prepared based upon information, including market prices, data and other information, believed to be reliable; however, Trade Nation does not warrant its completeness or accuracy. All market prices and market data contained in or attached to this communication are indicative and subject to change without notice.
EURUSD – DAILY FORECAST Q3 | W31 | D29 | Y25📊 EURUSD – DAILY FORECAST
Q3 | W31 | D29 | Y25
Daily Forecast 🔍📅
Here’s a short diagnosis of the current chart setup 🧠📈
Higher time frame order blocks have been identified — these are our patient points of interest 🎯🧭.
It’s crucial to wait for a confirmed break of structure 🧱✅ before forming a directional bias.
This keeps us disciplined and aligned with what price action is truly telling us.
📈 Risk Management Protocols
🔑 Core principles:
Max 1% risk per trade
Only execute at pre-identified levels
Use alerts, not emotion
Stick to your RR plan — minimum 1:2
🧠 You’re not paid for how many trades you take, you’re paid for how well you manage risk.
🧠 Weekly FRGNT Insight
"Trade what the market gives, not what your ego wants."
Stay mechanical. Stay focused. Let the probabilities work.
FX:EURUSD

EURUSD Is Bearish! Short!
Take a look at our analysis for EURUSD.
Time Frame: 2h
Current Trend: Bearish
Sentiment: Overbought (based on 7-period RSI)
Forecast: Bearish
The market is approaching a key horizontal level 1.166.
Considering the today's price action, probabilities will be high to see a movement to 1.159.
P.S
We determine oversold/overbought condition with RSI indicator.
When it drops below 30 - the market is considered to be oversold.
When it bounces above 70 - the market is considered to be overbought.
Disclosure: I am part of Trade Nation's Influencer program and receive a monthly fee for using their TradingView charts in my analysis.
Like and subscribe and comment my ideas if you enjoy them!

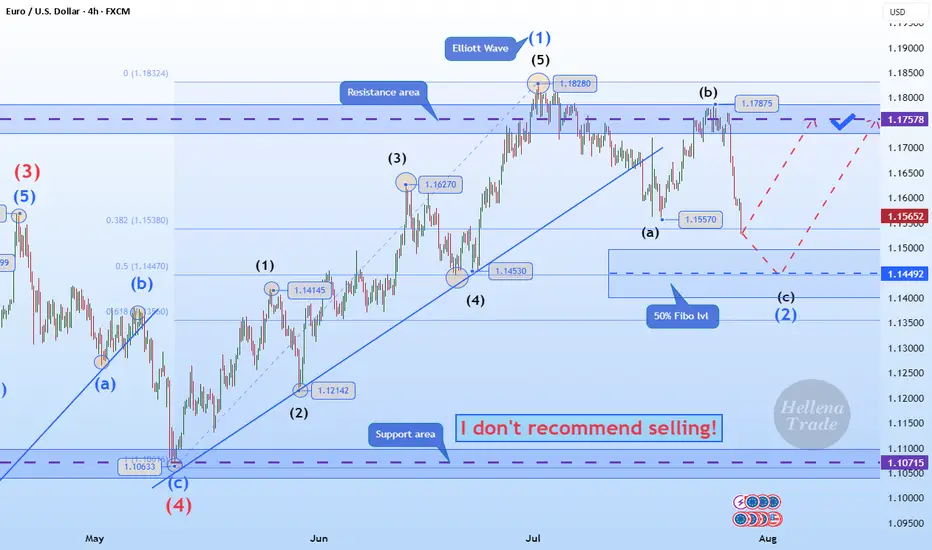
Hellena | EUR/USD (4H): LONG to the resistance area 1.17578.Colleagues, the price has made a strong downward movement, which can only mean one thing: the correction is not complete.
This means that the latest upward movement is wave “1” of medium order.
Therefore, I now expect the correction to end in wave “2” at the 50% Fibonacci level and thean upward movement to continue to at least the resistance level of 1.17578.
It is quite possible that after updating the level of 1.15570, the price will immediately begin an upward movement — this is a more risky option for entering a position.
Manage your capital correctly and competently! Only enter trades based on reliable patterns!
EURUSD Analysis : Rejection at Demand – Institutional Buy Setup🔍 Technical Storyline – What the Chart Tells Us:
🔸 1. Previous Bearish Structure – Descending Channel:
Price has been moving within a well-respected bearish channel, signifying structured sell-side liquidity control.
This channel served as a trap zone, where retail sellers were induced while institutions accumulated buy-side positions below the range.
The controlled movement inside the channel ended with a breakout to the upside, signaling a disruption in bearish control.
🔸 2. QFL Zone Formation – Manipulation & Liquidity Grab:
QFL (Quasimodo Failure Level) is evident in two phases here:
The first QFL acts as a reaction point where the market dropped to test demand and rallied aggressively.
The second QFL near the highs shows price swept previous liquidity before dumping, hinting at institutional profit-taking and possible redistribution into discount areas.
🔸 3. Central Reversal Zone (CRZ):
Price reversed sharply from this CRZ, which acted as a major supply level. The CRZ marks the top of the manipulation range.
This was a liquidity sweep targeting trapped long positions that entered too late at the highs.
🔸 4. Demand Revisit + Positive Rejection Pattern (Current Phase):
Price has now reached the MMC-validated demand zone, which previously launched a strong bullish move.
The long lower wick in the latest candle shows buyer absorption, suggesting early signs of a Positive Reversal Pattern.
This area is marked with high probability for bullish continuation, as it aligns with both technical support and smart money logic.
💡 Trading Plan & Market Mindset:
🔸 📈 Bullish Scenario (High-Probability Play):
Wait for bullish confirmation, such as:
Bullish engulfing on 1H/4H
Break of minor intraday structure (e.g., break of internal LH)
Strong volume surge from the zone
Entry zone: Within the demand block – 1.15500 to 1.15750
Stop-loss: Just below the demand zone (1.15250)
Target 1 (TP1): 1.16500 – minor intraday resistance
Target 2 (TP2): 1.17500–1.18000 – retest of QFL high and Central Reversal Zone
🔸 ❌ Bearish Invalidator:
A 4H candle close below 1.15250 would break the demand zone structure.
Invalidation of MMC reversal – move toward deeper liquidity (1.14500–1.14800)
🧠 Trader’s Psychology & Institutional Mindset:
Institutions often induce price spikes to trap both buyers and sellers.
This entire structure reflects classic accumulation → manipulation → distribution → reaccumulation.
The retest of the original demand zone allows institutions to re-enter at discount before pushing price back toward the highs.
“In MMC, patterns are not just shapes – they are footprints of institutional intent.”
