EURUSD H1 | Bullish Bounce Off Based on the H1 chart analysis, the price is falling toward our buy entry level at 1.1284, a pullback support that aligns closely with the 61.8% Fibonacci retracement.
Our take profit is set at 1.1367, a pullback resistance.
The stop loss is placed at 1.1229, a multi swing low support.
High Risk Investment Warning
Trading Forex/CFDs on margin carries a high level of risk and may not be suitable for all investors. Leverage can work against you.
Stratos Markets Limited (tradu.com ):
CFDs are complex instruments and come with a high risk of losing money rapidly due to leverage. 63% of retail investor accounts lose money when trading CFDs with this provider. You should consider whether you understand how CFDs work and whether you can afford to take the high risk of losing your money.
Stratos Europe Ltd (tradu.com ):
CFDs are complex instruments and come with a high risk of losing money rapidly due to leverage. 63% of retail investor accounts lose money when trading CFDs with this provider. You should consider whether you understand how CFDs work and whether you can afford to take the high risk of losing your money.
Stratos Global LLC (tradu.com ):
Losses can exceed deposits.
Please be advised that the information presented on TradingView is provided to Tradu (‘Company’, ‘we’) by a third-party provider (‘TFA Global Pte Ltd’). Please be reminded that you are solely responsible for the trading decisions on your account. There is a very high degree of risk involved in trading. Any information and/or content is intended entirely for research, educational and informational purposes only and does not constitute investment or consultation advice or investment strategy. The information is not tailored to the investment needs of any specific person and therefore does not involve a consideration of any of the investment objectives, financial situation or needs of any viewer that may receive it. Kindly also note that past performance is not a reliable indicator of future results. Actual results may differ materially from those anticipated in forward-looking or past performance statements. We assume no liability as to the accuracy or completeness of any of the information and/or content provided herein and the Company cannot be held responsible for any omission, mistake nor for any loss or damage including without limitation to any loss of profit which may arise from reliance on any information supplied by TFA Global Pte Ltd.
The speaker(s) is neither an employee, agent nor representative of Tradu and is therefore acting independently. The opinions given are their own, constitute general market commentary, and do not constitute the opinion or advice of Tradu or any form of personal or investment advice. Tradu neither endorses nor guarantees offerings of third-party speakers, nor is Tradu responsible for the content, veracity or opinions of third-party speakers, presenters or participants.
EURUSD

EUR/USD Update: Bullish Outlook Towards 1.14190 and BeyondHi Everyone,
As we projected in our analysis last week, EUR/USD corrected throughout the week and approached a retest of the 1.12000 level.
We expect the price to potentially retest 1.12000 and confirm it as support before advancing further to challenge the May 26 high of 1.14190. This would further reinforce our outlook for a potential long-term bullish trend.
Of course, the price could also challenge the 1.14190 high without a second retracement, should there be strong buying pressure early in the week. A successful breach of this level would likely drive the price higher towards the 1.15240 level.
We will provide further updates on the expected path for EUR/USD should the price reach this target.
The longer-term outlook remains bullish, with expectations for the rally to extend toward the 1.2000 level, provided the price holds above the key support at 1.10649.
We will continue to update you throughout the week with how we’re managing our active ideas and positions. Thanks again for all the likes/boosts, comments and follows — we appreciate the support!
All the best for the week ahead. Trade safe.
BluetonaFX

Bearish reversal off pullback resistance?The Fiber (EUR/USD) is rising towards the pivot, which is a pullback resistance, and could drop to the 1st support, which is a pullback support.
Pivot: 1.1521
1st Support: 1.1065
1st Resistance: 1.1665
Risk Warning:
Trading Forex and CFDs carries a high level of risk to your capital and you should only trade with money you can afford to lose. Trading Forex and CFDs may not be suitable for all investors, so please ensure that you fully understand the risks involved and seek independent advice if necessary.
Disclaimer:
The above opinions given constitute general market commentary, and do not constitute the opinion or advice of IC Markets or any form of personal or investment advice.
Any opinions, news, research, analyses, prices, other information, or links to third-party sites contained on this website are provided on an "as-is" basis, are intended only to be informative, is not an advice nor a recommendation, nor research, or a record of our trading prices, or an offer of, or solicitation for a transaction in any financial instrument and thus should not be treated as such. The information provided does not involve any specific investment objectives, financial situation and needs of any specific person who may receive it. Please be aware, that past performance is not a reliable indicator of future performance and/or results. Past Performance or Forward-looking scenarios based upon the reasonable beliefs of the third-party provider are not a guarantee of future performance. Actual results may differ materially from those anticipated in forward-looking or past performance statements. IC Markets makes no representation or warranty and assumes no liability as to the accuracy or completeness of the information provided, nor any loss arising from any investment based on a recommendation, forecast or any information supplied by any third-party.

Week of 6/1/25: EU AnalysisEU 1h and 4h structure are bearish, but there was a large rejection of the daily CHoCH last week leading to large bullish price movement. Our 1h internal structure is bullish, so we will follow that trend for now.
Major news:
PMI - Monday
PMI/ADP NFP - Wed
Unemployment Claims - Thurs
NFP/Unemployment rate - Friday

EURUSD is in a Downside DirectionHello Traders
In This Chart EURUSD HOURLY Forex Forecast By FOREX PLANET
today EURUSD analysis 👆
🟢This Chart includes_ (EURUSD market update)
🟢What is The Next Opportunity on EURUSD Market
🟢how to Enter to the Valid Entry With Assurance Profit
This CHART is For Trader's that Want to Improve Their Technical Analysis Skills and Their Trading By Understanding How To Analyze The Market Using Multiple Timeframes and Understanding The Bigger Picture on the Charts

EURUSD: Bearish Continuation
The recent price action on the EURUSD pair was keeping me on the fence, however, my bias is slowly but surely changing into the bearish one and I think we will see the price go down.
Disclosure: I am part of Trade Nation's Influencer program and receive a monthly fee for using their TradingView charts in my analysis.
❤️ Please, support our work with like & comment! ❤️

EURUSDHello Traders! 👋
What are your thoughts on EURUSD?
EURUSD is still trading below a key resistance zone, showing signs of weakness and lack of strong bullish momentum. At this stage, it seems unlikely that the pair will break above the resistance in the short term.
We expect a downward correction toward the specified support levels, before any potential resumption of the uptrend.
Despite short-term weakness, our long-term outlook remains bullish, and this pullback could offer a better entry opportunity in line with the broader trend.
Don’t forget to like and share your thoughts in the comments! ❤️

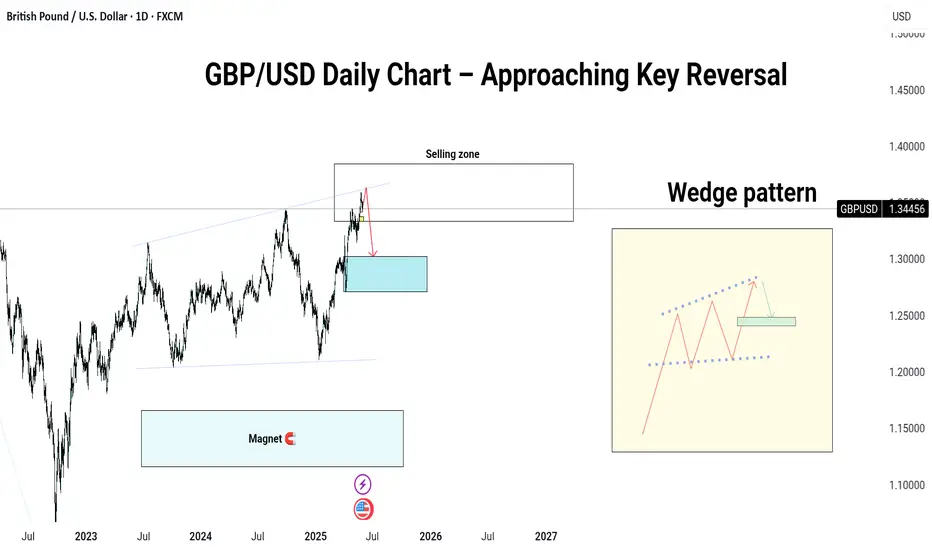
GBP/USD Daily Chart – Approaching Key Reversal
📉 GBP/USD Daily Chart – Approaching Key Reversal Zone
Price has tapped into the major selling zone (around 1.38000), aligned with long-term trendline resistance.
🔻 Bearish Outlook Active:
If this level holds, we may see a rejection and a drop toward the demand zone near 1.29000–1.30000.
⚠️ Short-term buyers beware — this could be the last push before reversal.
💡 Watch for confirmation candles or a break of the minor support (yellow zone) to validate the move.
🗣️ Do you see a sell setup here, or are bulls still in control? Drop your view below 👇
#GBPUSD #ForexAnalysis #GreenFireForex #TechnicalAnalysis #PriceAction #SupplyAndDemand #ForexTrading
---
What's your view ( scenerio 1 or 2 )
---
📈 EUR/USD Weekly Chart – Wave 4 in Progress?
Wave 3 looks complete and price is now hovering in a key correction zone, hinting at the start of Wave 4.
Two possible paths are unfolding:
🔴 Scenario 1: Shallow Wave 4 correction → breakout to Wave 5, targeting 1.16667 and beyond.
🔵 Scenario 2: Deeper Wave 4 correction → retest of demand zone near 1.08, followed by a strong Wave 5 rally.
🧠 Elliott Wave traders, it’s time to stay sharp!
The reaction near the mid-box and support zone could define the next major move for the Euro.
💬 What’s your bias here — is this the start of Wave 5 or a fakeout before a deeper drop?
Comment your view 👇
#EURUSD #ElliottWave #ForexWeekly #GreenFireForex #WaveAnalysis #TechnicalAnalysis #SupplyAndDemand
---

EURUSD Support & Resistance LevelsThese zones have been generated using a custom-built software tool, developed and refined over an extended period of time. The tool is the result of dedicated effort and research, aiming to identify high-probability support and resistance areas with precision.

6E Weekly Trajections I've marked out the FVG's on the 15m TF. This is my idea on where the price will be going over the next week. Make sure we watch for tariff news since a lot is going on with the courts.

How to Secure Prop Firm Funding: Proven Strategies to Pass1️⃣ How to Secure Prop Firm Funding: Proven Strategies to Pass Challenges 📈
Introduction ✨
Securing prop firm funding opens the door to trading substantial capital and achieving financial freedom. However, passing these evaluations requires meticulous strategy, disciplined execution, and smart risk management. This article provides actionable strategies, optimized trading setups, and insights on leveraging AI to ensure you successfully navigate and pass your prop firm challenges.
Understanding Prop Firm Evaluations 📊🔍
Prop firm challenges typically include specific trading objectives:
💰 Profit targets (8–10% within 30 days)
⛔ Daily loss limits (usually 5%)
📉 Maximum drawdown limits (typically 10%)
💡 Tip: Print the rules and display them at your workspace to avoid rule breaches.
Focus on One High-Probability Strategy 📌🎯
Consistently profitable traders use one rigorously tested strategy. For example, a popular setup:
🔄 Liquidity Sweep: Wait for price to clear stops above recent highs or lows.
⚡ Market Structure Break (BOS): Enter after price breaks and confirms a new trend.
📥 Entry: Order block (OB) or Fair Value Gap (FVG).
Example Trade:
🔗 Pair: EUR/USD
🔽 Entry: OB after sweep at 1.0800
🛑 Stop Loss (SL): 1.0820
🎯 Take Profit (TP): 1.0740
📊 Risk-to-Reward Ratio (RRR): 3:1
Start Small, Think Big 🧠🌱
Initially, risk only 0.5% per trade to maintain psychological comfort and buffer against drawdowns. Increase risk gradually once you have a profit cushion.
Leverage AI Insights 🤖📊
Modern traders enhance decision-making using AI-driven tools:
🟢 AI indicators for real-time liquidity detection
🔵 Predictive analytics for entry confirmations
Efficient Risk Management 🛡️⚖️
Set daily and weekly risk limits. For instance:
⏳ Maximum daily risk: 1%
📅 Weekly drawdown cap: 3%
Practical Example:
💵 If trading a $100,000 account, never risk more than $1,000 in a single day.
Journaling for Improvement 📒📝
Record every trade’s rationale, execution details, and outcome. This fosters accountability and improvement.
Conclusion ✅
Securing prop funding isn't about luck but disciplined, strategic execution. Optimize your trading, leverage technology, and strictly manage risk to ensure long-term success. 🏆

Final BTCUSD update..Good day traders, here is my final update on BTCUSD and I like how price has been respecting our PD arrays. Keep in mind traders price moving in waves and what again😂😂🏃🏾♂️, point is today is the last trading day for the week and my thoughts is that we can expect BTCUSD to start going higher today and tomorrow maybe till Tuesday …sorry I’m being too sure but if you focus on time and price you start to KNOW(ledge) things or maybe I should say secrets?!🤨🤔
I always expect price to manipulate higher if my bias is shorts, ICT’s power of 3 works wonders when it come to this thought process.
Watch how price reacts to the FVG where price is trading now, it’s not a signal just watch out price moves always from it for the rest of today.
We only going high to shoot lower…keep that in mind!!🤯

EURUSD Weekly Analysis (MMC) – Bearish Path to Target Zone📈 Market Narrative – Understanding EURUSD's Path with MMC
The EURUSD pair is currently navigating a critical phase in its macro price structure, aligning closely with the Mind Market Concept (MMC) methodology — a trading framework rooted in institutional price behavior, psychological arcs, and structured market mapping.
This chart reveals a story of accumulation, expansion, manipulation, and rebalancing — classic smart money behavior playing out on the higher timeframe. The current move is not just price action — it's a strategic delivery of price toward imbalance, guided by volume vacuums, liquidity zones, and engineered traps.
🧩 Phase-by-Phase Technical Analysis
🔷 1. Arc Accumulation Zone – The Beginning of Institutional Positioning
In the latter half of 2024, EURUSD entered a rounded arc formation, which marks a textbook accumulation phase.
This "bowl-like" curve represents gradual absorption of sell-side liquidity by institutions.
The lows became progressively higher, indicating demand stepping in while supply weakened.
Volume during this time was suppressed — another smart money tactic to accumulate without causing price spikes.
📌 Why This Matters: Arcs often precede explosive breakouts, particularly when aligned with time-based liquidity cycles (quarterly/yearly rebalancing). This zone gave birth to the breakout that followed.
🔷 2. The Central Zone – Consolidation Before Expansion
Once the arc base was complete, price broke out impulsively, then pulled back into what is labeled the Central Zone.
This zone acts as a mid-range liquidity pocket — where orders are stacked and reaccumulation occurs.
It also became the launchpad for the final markup wave that tapped the previous target around 1.1250.
🔍 This move was the realignment phase, where smart money took price above key highs to:
Hit their internal targets.
Trap breakout traders.
Induce euphoria before distribution.
🔷 3. Major BOS – Break of Macro Structure
The breakout through 1.1150–1.1200 confirmed a Major Break of Structure (BOS).
This BOS acted as a signal for:
Trend reversal confirmation for many retail traders.
A "green light" to buy — which was anticipated and exploited by institutions.
But here’s the twist:
Price rejected the SR Interchange Zone (support turned resistance), signaling that the breakout was engineered to trap liquidity.
🔷 4. Distribution & Manipulation – The Trap Layer
The chart clearly shows two critical supply areas:
Minor Resistance (around 1.1400s)
Major Resistance (around 1.1550–1.1600s)
Price briefly approached these zones but failed to hold, forming a complex distribution range.
This is where:
Smart money distributed their long positions.
Retail buyers got trapped.
Volume increased during sell-side preparation.
📌 The rejection from these zones sent price into a clean markdown, forming lower highs and confirming the bearish structure mapping.
🔷 5. Structural Mapping – Downtrend Control
Price action is now clearly in a bearish delivery phase, as shown by:
Lower highs & lower lows
Repeated rejections from minor resistance
Large red candles with little retracement (showing momentum)
This phase is often misunderstood by retail traders. But within MMC, it’s identified as the delivery to imbalance — a controlled descent into unmitigated demand.
🔷 6. Target + Reversal Zone – Where the Real Opportunity Begins
We are approaching the most important area on the chart:
🟡 Target + Reversal Zone (around 1.0950–1.1000)
This zone is not randomly drawn:
It's the origin of the arc breakout, a high-volume node.
It's a discounted price level where institutions may re-engage.
It’s untapped demand from the earlier accumulation — meaning no major reaction has occurred here yet.
If price slows down here, forms a liquidity sweep, or gives a bullish engulfing on the lower timeframe — this could be the reversal point.
But:
If price slices through with strong momentum, it may signal macro weakness, opening room to test the 1.0800 region.
🧭 Trade Plan & Execution Guide
Setup Type Actionable Guidance
📉 Bearish Pullback Entry Short entries near 1.1300–1.1350 with stop above minor resistance
🟡 Demand Reversal Watch Wait for reaction in 1.0950–1.1000, assess volume & candle response
📊 Structure Confirmation Use lower timeframe BOS for entry alignment
🛡️ Risk Management Keep risk below 1% per trade, avoid chasing mid-zone prices
💬 Key Takeaways
EURUSD has completed its accumulation → expansion → manipulation cycle.
We are now entering the rebalancing phase, where the market returns to fair value (demand).
Smart money flow is visible — from engineered highs to controlled selloffs.
The Target + Reversal Zone will likely dictate the next macro direction.

EURUSD: weekly focus on jobs dataThe previous week started with US macro data related to Durable Goods Orders. This indicator surprisingly dropped by -6,3% in April compared to the previous month. Although negative, the indicator was better from the market estimate of -6,8%. The second estimate of US GDP Growth rate for Q1 was -0,2%, and was a bit better from the market estimate of -0,3%. Fed's favorite inflation gauge, PCE data, was posted during the previous week. The PCE in April increased by 0,1%, which was in line with market anticipation. Core PCE was also standing at the level of 0,1% for the month. At the same time, Personal Income was higher by 0,8% in April, highly above forecasted 0,4%, while Personal Spending was higher by 0,2% for the month, and in line with market estimate. The week was closed with University of Michigan Consumer Sentiment. Final indicator level for May was 52,2, modestly above market expectation of 51. The five years inflation expectations were also modestly decreased to the level of 4,2%, which was below market estimate of 4,6%.
The GfK Consumer Confidence in Germany continues to move in a negative territory in June with the level of -19,9, a bit higher from market consensus at -19. The Unemployment rate in Germany in May remained unchanged from the previous month, at the level of 6,3%, and in line with market expectations. The Retail Sales in Germany in April dropped by -1,1% on a monthly basis, bringing the indicator to 2,3% when compared with the previous year. Preliminary Inflation estimate for Germany in May stands at 0,1% for the month and 2,1% on a yearly basis.
The currency pair moved in a mixed manner during the previous week. The highest weekly level at 1,1414 marked the start of the week, however, eurusd is ending the week lower, at the level of 1,1348. Still the lowest weekly level was shortly touched at Thursday's trading session at the level of 1,1213. The RSI moved between levels of 53 and 59, without a clear indication that the market is heading toward either side. The MA50 continues to diverge from MA200, without an indication of a potential change of course in the coming period.
The week ahead brings some important news, which the market is currently following with high anticipation. The US jobs data will be in focus in the week ahead, including the Non-farm payrolls for May. This might bring some higher volatility in case that the official data are not in line with market anticipation. On the other hand, the ECB meeting is scheduled for the week ahead, where ECB members will make a decision whether to cut interest rates for another time during this year. As per Reuters pool, there is a high probability that the ECB will make another cut at the June 5th meeting, by 25bps, bringing the facility rate to the level of 2%. This day might be another volatile day on the market. As per current charts, there is probability for eurusd to test 1,1250 short term support level in the week ahead, and this would be the level to watch. If it holds, then the eurusd will revert back with high probability to reach levels above the previous week's highs at 1,14. In this case, the currency pair will head to test 1,15 levels for one more time, but it might occur in more than one week. For the week ahead, the 1,14 resistance would be the level to watch. Current charts are showing low probability that the short term support at 1,1250 will be breached to the downside. Just in case that this move occurs, then the next level to watch will be 1,11. However, such a move currently has a low probability of occurrence.
Important news to watch during the week ahead are:
EUR: Inflation rate in EuroZone, flash for May, ECB rate decision, ECB Press conference, Trade Balance for Germany in April,
USD: ISM Manufacturing PMI for May, JOLTs Jobs Openings in April, ISM Services PMI for May, Non-farm Payrolls in May, Unemployment rate in May.

EUR/USD4H Bearish Trade Setup Supply Zone Rejection with 3:1 RRR🔷 Trend Overview
📈 Price was in a rising channel (trend line + support line).
❌ Channel broken on downside → potential trend reversal.
🟧 🔼 Supply Zone (Sell Area)
📍 Zone: 1.13707 – 1.14432
🟠 Price faced rejection here.
💡 Institutional selling likely in this zone.
🔥 This is the ideal short-entry area.
🟦 🔽 Entry Point
🎯 Entry: Around 1.13694
🧩 Sits just below supply zone = safer trigger.
✅ Wait for a bearish confirmation candle before entering.
🟨 Support Level
📉 Support Zone: ~1.13100 – 1.13400
📊 Recently broken with a strong bearish candle.
🧱 Used to act as a floor, now may act as resistance.
🟩 🎯 Target Point
✅ Take Profit: 1.10970
📎 Matches previous structure support.
💰 Lock in profits before the psychological level at 1.1100.
🟥 ⛔ Stop Loss
❌ Stop: 1.14419
📏 Placed above the supply zone for protection.
🛡️ Shields from false breakouts or spikes.
⚖️ Risk-to-Reward Ratio (RRR)
💡 Approx. 3:1 ✅
📉 Risk: ~70 pips
📈 Reward: ~270 pips
🔥 High-probability setup
📌 EMA (Exponential Moving Average – 70)
📍 EMA 70 at 1.13102
🔻 Price is below the EMA → favors bearish momentum
🧠 Pro Tips:
🔍 Watch for bearish engulfing or rejection candles at the entry zone.
🗓️ Be aware of major news events (ECB, Fed).
🧮 Adjust lot size for risk management (based on SL size).
✅ Summary:
🧩 Element 📊 Value
Trade Type 🔻 Short (Sell)
Entry Point 📌 1.13694
Stop Loss ⛔ 1.14419
Take Profit 🎯 1.10970
RRR ⚖️ ~3:1
Sentiment 📉 Bearish
