EURUSD price structure analysis for two weeks
Nice example of structure break, price is above the previous swing high.
Now we are making higher shing hing and higher swing low. Which can be considered as up trend.
Yellow lines and ellipse marked may work like support or resistance in coming future. I am not suggesting any trade but wanted to share nice example of structure analysis and trading.
Hence traders can use these levels in their own trade plane to book profits or to enter into the trade or for keeping stops.
Such system of analysis can be used by traders in their own stocks or commodities or forex or in indexes they trade.
Eurusd30m


EURUSD longterm positionIt is in a steady upward channel on 4h, recently broke through a pretty strong resistance and key level at 1.07. I don't see the trend line stopping it from continuing bullish and I believe with a weakening DXY we could see the start of a steady and long term overall bullish move from EU

Long EURUSD @ contrarian recovery bet (into, while & after FOMC)Take care
& analyzed it again
- it`s always your decission ...
(for a bigger picture zoom the chart)
This is only a trading capability - no recommendation !!!
Buying/Selling or even only watching is always your own responsibility ...
Best regards
Aaron

Future posible development of EUR/USDThis how maybe EURUSD will perform for the days and weeks to come!


Daily Template 2. EUR USDHello!
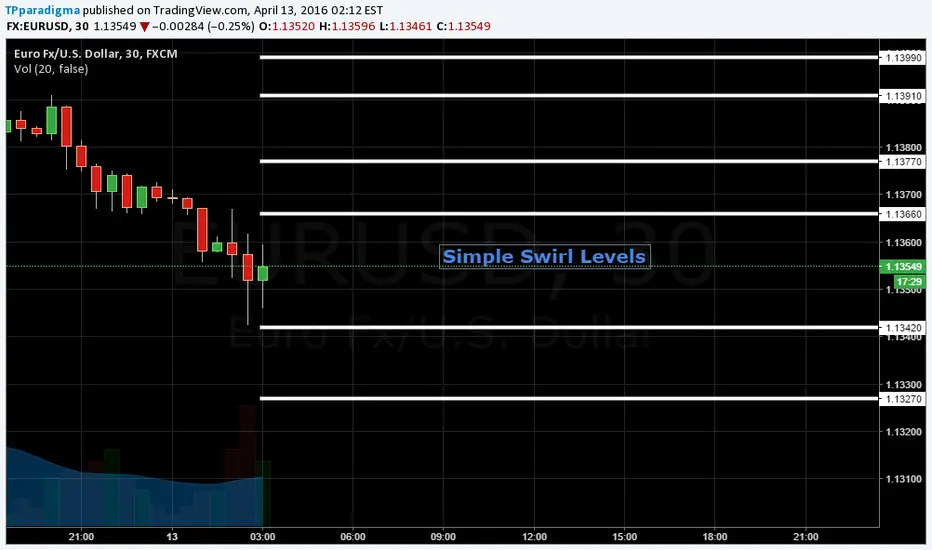
These are simple swirl levels, with simple yet powerful trading opportunities. I will update during the day, where will be opened positions and TP's, if EUR USD interacts with these levels.
Yesterday we made nice short and TP was hit.
Trading rules are simple, if eurusd breaks one of these levels up and down or down and up by 5 pips ( without touching the next level ), we wait for it to travel away and look for entry. TP is the level that was broken down/up.
Download this template - www.tpparadigma.com
Register in Forum - www.tpparadigma.org
Don't miss live trades on Periscope.
Login into our MT4 terminal live account and monitor our trades!
Sincerely, TP PARADIGMA.
Target EURUSD for 28.03 - 01.04Hello my friends!
Based on my calculations 1398 has to be seen during the time frame from 28.03 - 01.04.
If it does not happen I Abandon my system!
SL is very WIDE and I could drop it down more based on situation!
Fingers crossed!
My project is coming out soon and all of you will get the templates I am trading!

100 - 200 Pip Opportunity - EUR/USD Long - 05/02/2016100 - 200 Pip Opportunity - EUR/USD Long - 05/02/2016
The primary trend of EUR/USD is bullish on charts and price is trading above the trend line in its daily chart. In 4 hourly chart the price is sustaining above 200 day SMA and taking support of 50 day SMA indicating uptrend of the pair. It is having an important resistance at the level of 1.12750 and support at the level of 1.12232. If it breaks its resistance level on the upside and sustains above it then we can expect it to show further bullish movement in the pair.
EUR/USD
RECOMMENDATION BUY TARGET 1.12750
The Major trend of Euro it is showing strength for buying If it crosses the resistance level then one can initiate buying position in the pair . If it crosses the level of 1.12689 then it can test level for the target of 1.13000 with second target at 1.1430 with the stop loss 1.1175.
CHART FORMATION:-
Euro is trading in a range and trading near the trend line. Breaking the support line will lead to upside movement. Eur is trading above the 50 DMA with a negative bias.
INDICATORS:-
RSI is trading near to 65 levels with a positive bias, in upcoming session upside movement is expected.
MACD and Signal line is sustained above the zero level line.
www.tradingsignalreviews.com

Synced Patterns // IF=THEN ®FX:EURUSD
With a major target around 1.10 (check previous published idea - link below) the market present us with a few shot opportunities today...
Check ratios here:
Safe trades;
