EURUSD Short Term Buy Idea Update!!!Hi Traders, on April 15th I shared this idea "EURUSD Short Term Buy Idea"
Expected retraces and further continuation higher until the strong support zone holds. You can read the full post using the link above.
Price is moving as per the plan!!!
Retraces happening as expected, my bullish view still remains the same here.
If you enjoy this idea, don’t forget to LIKE 👍, FOLLOW ✅, SHARE 🙌, and COMMENT ✍! Drop your thoughts and charts below to keep the discussion going. Your support helps keep this content free and reach more people! 🚀
--------------------------------------------------------------------------------------------------------------------
Disclosure: I am part of Trade Nation's Influencer program and receive a monthly fee for using their TradingView charts in my analysis.
Eurusdanalysis

EUR/USD Bullish Setup – Targeting 1.16950Entry Zone (Buy Area): Between 1.12729 and 1.13101
Stop Loss: 1.12100
Target (TP1): 1.16950
Risk-Reward Ratio (R:R):
Risk: 1.13101 - 1.12100 = 101 pips
Reward: 1.16950 - 1.13101 = ~385 pips
R:R ≈ 1:3.8 — excellent risk-to-reward
📈 Technical Observations
Bullish Momentum: Strong bullish candles leading into the setup suggest buyers are currently in control.
Support Zone (Entry Area):
The purple zone has acted as a previous resistance, now turned support.
Price may retest this zone before moving higher (as indicated by the blue path on the chart).
Moving Averages:
Red (likely 50 EMA) and blue (possibly 200 EMA) are showing a bullish crossover.
Price is above both MAs, reinforcing a bullish trend.
Projected Move:
The setup anticipates a pullback before a continuation to the upside toward 1.16950.
🧠 Trade Idea Summary
This is a buy-the-dip strategy within a bullish trend.
Entering on the pullback allows for:
Tighter stop loss
Better entry price
Higher R:R ratio
⚠️ Risk Considerations
A break below 1.12100 would invalidate the setup.
Monitor for bearish reversal patterns or news around the EUR/USD that might shift sentiment.

DeGRAM | EURUSD Bullish Breakthrough📊 Technical Analysis
- Uptrending channel
The chart shows stable price movement inside the ascending channel, where the price is bouncing off the lower support line and aiming for the upper one.
- Key resistance
The main barrier is fixed around $1.135. A breakdown of this level promises further growth.
- Predictive scenario
A solid breakdown of the resistance confirms the bullish bias, which may lead to further upside.
💡 Fundamental Analysis
The publication of key macroeconomic indicators (inflation, labor market data, PMI) may push the price to confirm the technical scenario. Stability in the Eurozone with positive data will contribute to growth, and favorable for the US - on the contrary, strengthening the bearish momentum.
✨ Summary
The technical picture in the form of an ascending channel with the key resistance at $1.135 is combined with positive fundamental factors. A breakdown of the resistance is a signal for the continuation of growth. Watch the news and macro data to confirm the scenario!
-------------------
Share your opinion in the comments and support the idea with like. Thanks for your support!

EURUSD Short Term Buy IdeaH4 - Strong bullish momentum
Higher highs on the moving averages of the MACD
No opposite signs
Expecting retraces and further continuation higher until the strong support zone holds.
If you enjoy this idea, don’t forget to LIKE 👍, FOLLOW ✅, SHARE 🙌, and COMMENT ✍! Drop your thoughts and charts below to keep the discussion going. Your support helps keep this content free and reach more people! 🚀
--------------------------------------------------------------------------------------------------------------------
Disclosure: I am part of Trade Nation's Influencer program and receive a monthly fee for using their TradingView charts in my analysis.

EUR/USD Closing the Symmetrical Triangle PatternEURUSD is trading bullishly but has eased after hitting a high of $1.1470. Currently, it trades sideways near $1.1342. Despite the bullish trend, the pair is overbought and may dip below $1.1296 toward $1.1296 support.
If bulls close above $1.1470, a further rally could target $1.1710.
>>> No Deposit Bonus
>>> %100 Deposit Bonus
>>> Forex Analysis Contest
All at F enzo F x Decentralized Forex Broker

EURUSD TECHNICALS & FUNDAMENTALS🧱 Wave Structure & Pattern
Wave (1)–(5) structure is complete with strong impulse.
Wave (5) looks extended with a steep angle — could mean temporary exhaustion before a pullback or sideways correction.
Volume surged heavily during Wave (5), suggesting high participation and buying climax potential.
✏️ Key Levels:
Current Price: ~1.1394
Support Zone: Around 1.1300–1.1250 (previous resistance = now support)
Next Resistance Levels:
Minor: 1.1450
Major: 1.1600 (psychological and historical)
📈 Trendlines:
Clear rising trendline support from late January — keep an eye on any break below for early reversal signs.
A healthy retest of the 1.1300 zone could offer a long re-entry if bullish structure holds.
⚠️ Risk Watch:
After a 5-wave move, expect either an ABC corrective phase or a consolidation range.
Don’t get faked out by small pullbacks — corrections are normal after strong impulses.
🧠 Fundamental Analysis
📰 Key Drivers Today:
🇺🇸 U.S. Data / Sentiment:
Retail Sales (March) — stronger data could push the USD higher, putting pressure on EUR/USD.
Fed’s rate outlook: any hawkish hints from FOMC speakers or stronger data can boost USD.
🇪🇺 Eurozone Factors:
ECB’s recent dovish pivot is in focus.
German ZEW Economic Sentiment release is coming — a major sentiment mover.
Slower EU inflation data may keep ECB from tightening further, limiting euro upside unless the dollar weakens.
💸 Bond Yields & Dollar Index (DXY):
Rising U.S. yields or a DXY bounce could be a headwind.
DXY is hovering at key support — a rebound could stall EUR/USD's rally.
📊 Sentiment Overview:
Short-term: Bullish, but approaching overbought.
Medium-term: Cautious bullish — possible retest of support before continuation.
Macro: Dependent on U.S. data surprises and ECB tone.
🔍 Summary & Strategy Thoughts:
Bias Levels to Watch Trigger Idea
⚡ Bullish Break above 1.1450 Target 1.1600 if dollar weakens further
⚠️ Neutral / Pullback Retest of 1.1300–1.1250 support Buy-the-dip zone if trendline holds
🐻 Bearish (Short-Term) Break below 1.1250 Possible deeper correction toward 1.1100–1.1050

EUR/JPY Eyes Breakout — Can Bulls Push Through Resistance?EUR/JPY Weekly Chart Analysis
EUR/JPY is holding strong above a rising trendline that’s acted as support since 2022. The pair recently bounced from a key support zone and is now testing a major resistance area.
A breakout above this zone could trigger a bullish continuation, while rejection may lead to another pullback toward the trendline.
Key Levels:
Support: 153.5–155.0
Resistance: 163.5–165.0
Watch for: Weekly close above resistance for bullish confirmation.
Structure remains bullish as long as the trendline holds.

Expecting more USD selling overall: Weekly Market PreviewIn this video I go over last week's epic volatility and what I am looking for going forward.
Long positions on EUR/USD at 1.0980 will remain in tact and still eyeing a target of 1.2000 out of the falling wedge displayed on both the monthly and quarterly charts.
I do expect some pullback after a massive move to the upside to end the week however, the bull can become relentless and continue it's strength due to the U.S. Dollar weakness across the board.
USD/JPY is another one I am watching and initiated a short position at 143.31 with a target at 133. If the large weekly broadening pattern runs it's course, I expect for that target to get hit.
Tech may get relief after Trump announced over the weekend that there will be exemptions but the market can remain irrational and continue overall weakness especially since the U.S. economy as a whole is not well.
Hope you enjoy the video and we'll see what we get this upcoming week, especially with Federal Reserve Powell set to speak on Wednesday.
As always, Good Luck & Trade Safe.

DeGRAM | EURUSD retest of the upper boundary of the channelEURUSD is in an ascending channel above the trend lines.
The price is moving from the upper boundary of the channel.
The chart has already reached the triangle exit target.
RSI is in the overbought zone and a bearish divergence has formed on the 30m Timeframe.
We expect a correction.
-------------------
Share your opinion in the comments and support the idea with like. Thanks for your support!

DeGRAM | EURUSD held in the channelEURUSD is in an ascending channel between trend lines.
The price is moving from the lower trend line, which has already acted as a rebound point, and the lower boundary of the channel, above which it has successfully consolidated.
The chart formed a harmonic pattern while testing the boundaries and is now approaching the upper boundary of the triangle.
On the main timeframes RSI is above 50 pips, but 30m is overbought.
We expect EURUSD to continue rising after consolidating above the upper trend line.
-------------------
Share your opinion in the comments and support the idea with like. Thanks for your support!

EUR/USD Bullish Breakout & Retest Setup – Targeting 1.10955Instrument: EUR/USD
Timeframe: 30-Minute
Indicators Used:
EMA 30 (Red): 1.09821
EMA 200 (Blue): 1.09698
Key Levels Identified:
Entry Point: 1.09695
Stop Loss: Around 1.09067
Resistance Zone: ~1.09911
Target Zone: ~1.10918 to 1.10955
Projected Gain: ~147.3 pips (1.35%)
Price Action Analysis:
Bullish Breakout:
The price broke out from a consolidation zone (marked in purple).
A bullish trend is forming as price moves above the 200 EMA.
EMAs Alignment:
The 30 EMA is currently above the 200 EMA, indicating a potential bullish trend continuation.
However, price is slightly below the 30 EMA now, suggesting some short-term pullback or resistance.
Retest at Entry Zone:
Price retested the entry zone at 1.09695 after the breakout and is now hovering near it.
This retest is healthy for confirming support before another move up.
Trade Setup Insight:
Entry Strategy: A long (buy) entry at or around 1.09695.
Stop Loss Placement: Below the previous support zone near 1.09067 to manage risk.
Target Strategy: Aiming for the resistance zone around 1.10918–1.10955 for profit booking.
Conclusion:
This looks like a bullish continuation setup with a favorable risk-reward ratio. The confluence of:
EMA support,
Price structure (breakout & retest),
and defined resistance/target zone

DeGRAM | EURUSD came out of the triangleEURUSD is in an ascending channel above the trend lines.
Price is moving from the lower trend line, lower channel boundary and support level.
The chart, maintaining the ascending structure, has exited the triangle and is holding above the support level coinciding with the 38.2% retracement level.
The relative strength index is above 50 pips on the major timeframes.
We expect a retest of the current support level with further movement towards $1.1145.
-------------------
Share your opinion in the comments and support the idea with like. Thanks for your support!

EURUSD Found Support at $1.0992FenzoFx—EUR/USD trades bullish above the immediate support level of $1.0992, in conjunction with the 50-period simple moving average.
The bullish trend remains valid above this level. In this scenario, the price can potentially revisit $1.1090, followed by $1.1147.
>>> Trade EUR/USD with low spread, and no swap at FenzoFx Decentralized Forex Broker.

Market Analysis: EUR/USD Resumes IncreaseMarket Analysis: EUR/USD Resumes Increase
EUR/USD started a fresh increase above the 1.0950 resistance.
Important Takeaways for EUR/USD Analysis Today
- The Euro started a decent upward move from the 1.0880 zone against the US Dollar.
- There was a break above a key bearish trend line with resistance at 1.0955 on the hourly chart of EUR/USD at FXOpen.
EUR/USD Technical Analysis
On the hourly chart of EUR/USD at FXOpen, the pair started a fresh increase from the 1.0775 zone. The Euro cleared the 1.0950 resistance to move into a bullish zone against the US Dollar, as mentioned in the last analysis.
The bulls pushed the pair above the 50-hour simple moving average and 1.1000. Finally, the pair tested the 1.1150 resistance. A high was formed near 1.1146 before the pair corrected gains. It dipped below 1.1000 and tested 1.0880.
The pair is again rising from the 1.0880 zone. There was a break above a key bearish trend line with resistance at 1.0955. The pair climbed above the 50% Fib retracement level of the downward move from the 1.1146 swing high to the 1.0880 low.
Immediate resistance on the EUR/USD chart is near the 1.1045 zone and the 61.8% Fib retracement level of the downward move from the 1.1146 swing high to the 1.0880 low.
The first major resistance is near the 1.1080 level. An upside break above the 1.1080 level might send the pair toward the 1.1145 resistance. The next major resistance is near the 1.1165 level. Any more gains might open the doors for a move toward the 1.1200 level.
Immediate support on the downside is near the 1.0955 level. The next major support is the 1.0880 level. A downside break below the 1.0880 support could send the pair toward the 1.0830 level. Any more losses might send the pair into a bearish zone toward 1.0775.
This article represents the opinion of the Companies operating under the FXOpen brand only. It is not to be construed as an offer, solicitation, or recommendation with respect to products and services provided by the Companies operating under the FXOpen brand, nor is it to be considered financial advice.

EURUSD Sell and Buy Trading Plan Update!!!Hi Traders, on March 19th I shared this "EURUSD Sell and Buy Trading Plan"
I expected short term bearish moves towards the Fibonacci support zones and then continuation higher. You can read the full post using the link above.
Price moved as per the plan here!!!
If you enjoy this idea, don’t forget to LIKE 👍, FOLLOW ✅, SHARE 🙌, and COMMENT ✍! Drop your thoughts and charts below to keep the discussion going. Your support helps keep this content free and reach more people! 🚀
-------------------------------------------------------------------------------------------------------------------
Disclosure: I am part of Trade Nation's Influencer program and receive a monthly fee for using their TradingView charts in my analysis.

EURUSD LONG/BUYBy utilizing Fibonacci retracement levels, historical patterns, , we can formulate a hypothesis that the market might follow a similar trajectory if bullish sentiment prevails.

EUR/USD Bullish Reversal Setup – Buy from Demand Zone Near 200 EEMA 30 (Red): 1.09984
EMA 200 (Blue): 1.08869
🧠 Trade Idea: Long (Buy) Setup
📍 Entry Zone (Support/Buy Area):
Entry Point: Around 1.08868 – 1.08869
This zone aligns with the 200 EMA, acting as dynamic support.
There's also a clear demand zone (purple box), indicating historical buying interest.
⛔ Stop Loss:
Set at 1.08080
Placed below the demand zone to minimize risk if support fails.
🎯 Take Profit (Target):
Target Point: Around 1.11452
Coincides with a previous supply zone/resistance area (top purple box).
⚖️ Risk-to-Reward (R:R):
Risk: ~80 pips
Reward: ~250 pips
R:R Ratio: ~3.1:1 — A solid risk-to-reward setup.
🔍 Market Structure Observations:
Recent bullish momentum followed by a correction.
Price is approaching major support (near 200 EMA).
Likely scenario: Pullback into the demand zone, then bullish continuation toward the target.

EURUSD - UniverseMetta - Analysis#EURUSD - UniverseMetta - Analysis
W1 (Weekly Timeframe)
🔹 Price has reached the 261 Fibonacci level, marking the completion of the 5th wave.
🔹 This level also aligns with a major structure established back in 2023.
🔹 To confirm potential short opportunities, it's recommended to:
• Wait for a confirmed fractal on W1
• Look for reversal patterns on lower timeframes (D1 / H4)
D1 (Daily Timeframe)
🔹 Possible development of a 1st wave within an expanding triangle structure.
🔹 All recent movements appear corrective until a valid 2nd wave begins to form.
🔹 Nearest downside targets:
• 1.08264
• 1.07184
H4 / H1 (4H / 1H Timeframes)
🔹 Potential start of wave C on H4
🔹 Triggered by the formation of the 3rd wave + breakout from the descending channel on H1
🔹 Trade setup details:
Entry: 1.09501
Take Profits (TP):
1. 1.08264
2. 1.07184
3. 1.06163
4. 1.04493
Stop Loss: 1.10620
📌Conclusion:
EURUSD has hit a major resistance zone (261% Fibo), which may mark the end of the bullish 5-wave structure. A correction or reversal could follow.
Lower timeframes offer early opportunities to enter wave C, with confirmation via fractals and breakouts.
Use tight stops and respect your risk management.

DeGRAM | EURUSD will continue to decline in the channelEURUSD is in an ascending channel between the trend lines.
The price is moving from the upper boundary of the channel and has already successfully consolidated under the 62% retracement level.
We expect the chart to continue the decline towards $1.084
-------------------
Share your opinion in the comments and support the idea with like. Thanks for your support!

DeGRAM | EURUSD preparing for the pullbackEURUSD is in an ascending channel between the trend lines.
The price is moving from the lower boundary of the channel and dynamic support.
We expect a pullback after a retest of the upper channel boundary.
-------------------
Share your opinion in the comments and support the idea with like. Thanks for your support!

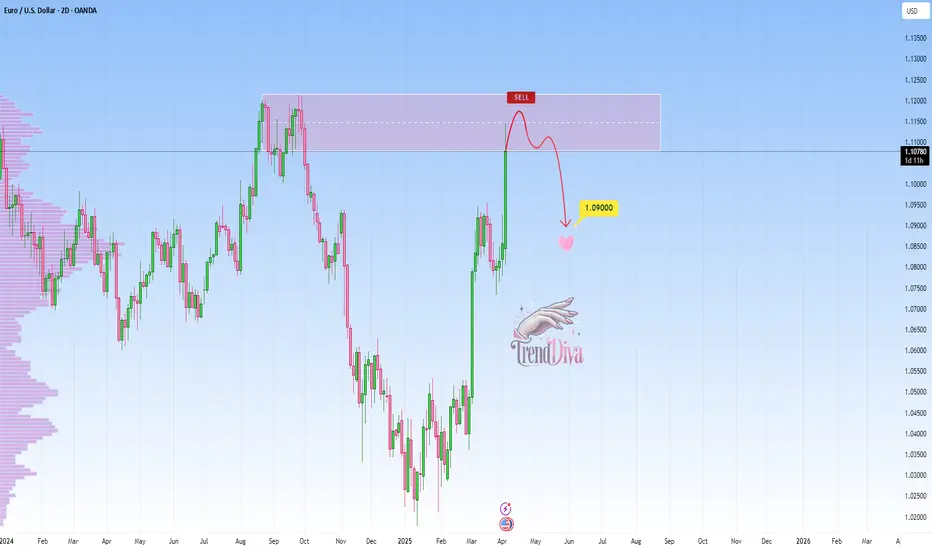
EURUSD at Major Resistance: Will it Drop To 1.09000?OANDA:EURUSD reached a major resistance level that has previously acted as a strong barrier, triggering bearish momentum in the past. This zone also aligns with prior supply areas where sellers have stepped in, making it a potential point of interest for those looking for short opportunities. Given its historical significance, how price reacts here could set the tone for the next move.
If bearish signals emerge, such as rejection wicks, bearish candlestick patterns, or signs of weakening bullish pressure, I anticipate a move toward the 1.09000 level. However, a clear breakout above this resistance could challenge the bearish outlook and open the door for further upside. It's a pivotal area where price action will likely provide clearer clues on the next direction.
Just my take on support and resistance zones, not financial advice. Always confirm your setups and trade with a proper risk management.
Best of luck!
Cup & Handle Pattern on EUR/USD – Bullish Breakout Setup🏗️ 1. Pattern Structure Breakdown
🔵 Cup Formation:
The left side of the chart illustrates a steep decline beginning around mid-October 2024, forming the left lip of the cup.
The bottom of the cup was established between late December 2024 and early February 2025, where the market found a strong support level near 1.0220.
A rounded bottom formed, which indicates accumulation and decreasing bearish momentum.
The right side of the cup shows a strong bullish reversal from the support zone, gradually returning to the previous highs around 1.1050–1.1100, completing the cup shape.
⚫ Handle Formation:
A slight pullback or consolidation occurred after reaching the resistance zone, forming the handle between late March and early April 2025.
This handle appears as a small descending channel or flag, which is typical for this pattern.
Price remained above the support trendline, showing strength in the handle without breaking the overall bullish structure.
🔍 2. Key Technical Zones
📌 Resistance Level (Breakout Zone): 1.1050 – 1.1100
Marked by prior price rejection and the top of the cup.
The successful breakout above this zone confirms the cup and handle breakout.
📌 Support Level: 1.0220 – 1.0300
This zone provided a base during the cup’s rounding bottom and serves as a critical demand area.
📌 Stop Loss: 1.07380
Positioned below the recent swing low (handle low), providing a safe buffer.
This placement respects both market structure and risk management.
🎯 3. Target Projection
✅ Price Target: 1.14780
Based on the measured move technique:
Measure the depth of the cup (approx. 1.1100 - 1.0220 = 880 pips).
Project that distance above the breakout point (around 1.1050).
Target = 1.1050 + 0.0880 = 1.1930 (but a conservative target of 1.14780 is used here).
This target aligns with a previous resistance level from mid-2023, adding confluence.
📈 4. Trade Setup Summary
Component Description
Pattern Cup and Handle (Bullish Continuation)
Entry Point Breakout above 1.1050 resistance
Stop Loss Below 1.0738 (recent low)
Target 1.1478 (based on measured move)
Risk/Reward Ratio Approx. 1:2.5 or better
💡 5. Technical Insights and Confluence
Volume Consideration (if available): Typically, volume decreases during the cup and increases during the breakout. Although volume is not shown here, this pattern suggests accumulation.
Handle Behavior: The handle did not breach the mid-point of the cup, maintaining a strong bullish structure.
Market Sentiment: Given the steady incline and the bullish breakout, it suggests buyers are in control.
🏁 Conclusion
This is a textbook Cup and Handle breakout setup on the EUR/USD daily chart. The structure shows a clear transition from bearish to bullish sentiment, accumulation at support, and a confirmed breakout with strong potential upside.
It offers an excellent long opportunity with favorable risk-reward, clear invalidation, and a historically reliable price pattern.

EUR/USD – Bullish Flag Pattern & Trade SetupTechnical Analysis & Trade Plan for TradingView Idea
This chart illustrates a Bullish Flag Pattern on the EUR/USD 1-hour timeframe, suggesting a potential continuation of the prevailing uptrend. Below is a detailed breakdown of the market structure, key levels, and a professional trading strategy.
📌 Chart Pattern: Bullish Flag Formation
The Bullish Flag is a continuation pattern that forms after a strong upward price movement, followed by a short period of consolidation within a downward-sloping channel. It signals a brief pause before the trend resumes.
Flagpole: The sharp price increase before the consolidation.
Flag: The corrective downward movement forming a small parallel channel.
Breakout Potential: A confirmed breakout above resistance could lead to a further bullish rally.
🔍 Key Technical Levels & Market Structure
🔵 Resistance Level (Supply Zone)
The upper boundary of the flag pattern acts as resistance.
A breakout above this level could trigger a strong buying opportunity.
🟢 Support Level (Demand Zone)
The lower boundary of the flag provides support.
Price is currently testing this zone, which is a critical decision point.
🎯 Target Price: 1.14544 (Projected Move)
The price target is calculated based on the height of the flagpole added to the breakout point.
This aligns with a previous significant resistance area.
📈 Trading Strategy & Execution Plan
✅ Entry Criteria:
A confirmed breakout above the flag's resistance level with a strong bullish candlestick.
Increased trading volume supporting the breakout.
🚨 Risk Management:
Stop Loss: Placed below the support zone of the flag to manage risk in case of a false breakout.
Take Profit Target: At 1.14544, aligning with the measured move of the flag pattern.
📊 Trade Confirmation Indicators:
RSI (Relative Strength Index): A reading above 50 confirms bullish momentum.
Moving Averages (50 EMA/200 EMA): A bullish crossover would strengthen the buying signal.
Volume Analysis: A breakout should be accompanied by high trading volume for confirmation.
⚠️ Potential Risks & Alternative Scenarios
Fake Breakout: If the price breaks out but lacks volume, it could be a false signal.
Bearish Reversal: If price breaks below the support zone, the bullish flag setup becomes invalid.
Market Sentiment Shift: Unexpected news events can impact price movement.
📝 Summary
The EUR/USD pair has formed a Bullish Flag Pattern, signaling a possible continuation of the uptrend.
A breakout above the resistance level would confirm the pattern and provide a strong buying opportunity.
Risk management is essential, with a stop loss placed below the support level.
Final Target: 1.14544, based on the flagpole’s measured move.
💡 Conclusion: A well-structured breakout above resistance could lead to a bullish rally toward 1.14544. However, patience and confirmation are key before entering the trade.
