EURUSD after the FedEURUSD continues to trade within the reversal zone highlighted in our previous analyses.
Following yesterday’s Fed decision, we’re seeing additional downside movement, though price hasn’t yet reached the support level at 1,1346.
Our outlook remains unchanged – we’re watching for the end of the pullback and will look for buying opportunities afterwards.
The H1 candle formed during the news release can serve as a reference. A break and close above it would signal a potential reversal to the upside.
Conversely, if price breaks and closes below that candle, it would suggest the correction is likely to continue toward lower levels.
Eurusdbreakout

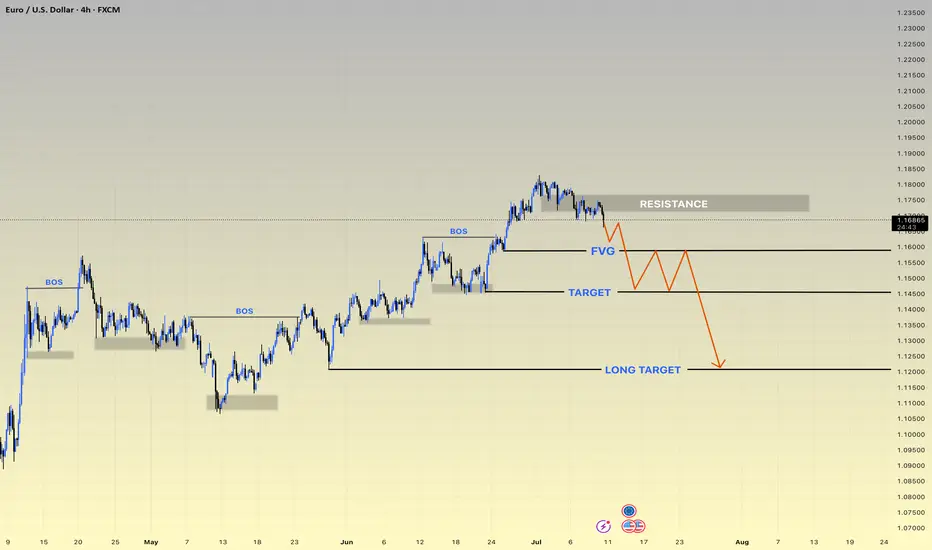
EURUSD h4 update ⚠️ Current Outlook: Reversal Zone Hit
• Price tapped into the strong RESISTANCE zone (~1.1800), failing to break higher.
• Market structure BOS (Break of Structure) confirms bearish intent.
• FVG (Fair Value Gap) likely to act as a short-term liquidity trap.
📍 Disrupted Bearish Flow:
1. Price rejects resistance aggressively ✅
2. Pullback into FVG may trigger a liquidity hunt 🧲
3. Fake bounce → Smart Money re-entry expected 👀
4. Target levels:
• 🥅 TARGET: 1.1550 zone (first major support)
• 🎯 LONG TARGET: 1.1200 zone (high probability zone for HTF buyers)
🔁 Bear Trap Setup Possibility:
• After hitting the LONG TARGET, price could reverse sharply.
• Watch for accumulation signs and deviation below key levels.
⸻
🔥 Key Zones to Watch:
• 🔳 Resistance: 1.1790–1.1820
• 🟦 FVG Retest Zone: 1.1630–1.1660
• 📉 Target Zone: 1.1500–1.1550
• 🚨 Long-Term Demand Zone: 1.1180–1.123
EUR/JPY Potential Bullish ContinuationEUR/JPY Potential Bullish Continuation 📈🔍
📊 Technical Overview:
The EUR/JPY chart presents a bullish channel structure, indicating an overall upward trend. Price action respected the channel boundaries with multiple confirmations before the latest bearish correction.
🔹 Structure Highlights:
🔵 Ascending Channel: Price moved steadily within an upward-sloping channel.
🟠 Support Rebound: A strong bullish candle formed on June 20th after touching the lower boundary — a clear support confirmation.
🔴 Recent Rejection: On July 1st, price tested the upper channel resistance and faced rejection, forming a bearish engulfing candle.
🟫 Support Zone Marked: Around the 167.800 level, this zone has been tested multiple times, indicating a possible demand area.
🔁 Current Scenario:
The pair has broken down from the internal trendline (light brown line) and is heading toward the support zone. A bullish bounce from this area may lead to a rally toward the Target Point at ~172.000 🎯.
📌 Key Levels:
Support Zone: 167.600 – 168.000
Resistance Zone: 170.500 – 172.000
Current Price: 168.994
📈 Outlook:
If support holds and bullish momentum returns, there's potential for a move toward the target area at the top of the channel. However, a break below the support zone could invalidate the bullish scenario and suggest a deeper correction.
🧠 Conclusion:
Wait for bullish confirmation near support before considering long positions. A clean break and retest of the support zone could signal a continuation of the upward trend.

EUR/USD Weekly – Two Long Setups Hello guys!
It is my perspective on eurusd!
Before we even reach the major resistance zone around 1.2050–1.2100, I’ve highlighted two long-term opportunities that may unfold as the price continues to climb.
✔ First Long Position:
It looks like a more conservative entry. The price is already above it. You can set a pending position!
It was likely aiming to catch the momentum as the price broke above the previous structure.
TP is near the descending trendline, around 1.2050–1.2100. a smart place to exit before major resistance hits.
✔ Second Long Position:
Positioned slightly lower. probably in case of a pullback or retest into the broken zone.
This one offers better risk-reward, but requires patience and a cleaner retracement.
Both longs are short-to mid-term swing ideas, aiming to ride the bullish leg into the bigger trendline rejection zone, where I’d personally be more cautious or even look for reversal setups.

EUR/USD Bullish Continuation Analysis EUR/USD Bullish Continuation Analysis 🚀💶
📊 Chart Summary:
The EUR/USD pair is demonstrating a strong bullish structure with consistent higher highs and higher lows. Recent price action shows a breakout above the 1.16386 resistance level, now acting as support 🛡️. The market is currently retracing and might retest this new support zone before continuing its upward move toward the target.
🔍 Key Observations:
🔸 Bullish Structure:
Multiple bullish impulses have formed a clean staircase pattern (🔼⬆️), indicating sustained buying momentum.
🔸 Support Zone 🟦 (1.13200 - 1.14000):
This zone has been tested multiple times, confirming its strength and the base of this bullish rally.
🔸 Breakout & Retest 🟠:
Price broke above the 1.16386 resistance level, pulled back slightly (highlighted by the orange circle), and now looks ready for a potential continuation to the upside.
🔸 Target 🎯: 1.18010
A clear target has been set based on measured move or resistance projection. If the price respects the current structure, we may see a continuation toward this level.
✅ Trade Outlook:
Bias: Bullish 📈
Entry Zone: Around 1.16386 (upon bullish confirmation)
Target 🎯: 1.18010
Invalidation ❌: Break below 1.1600 with bearish momentum
🧠 Technical Tip:
Always wait for confirmation on the retest before entering. Wick rejections or bullish engulfing candles at the support zone can provide additional entry confidence. 🔍✅

Chartanalyse: Der Chart zeigt eine Seitwärtskonsolidierung mitTechnical Overview:
The EUR/USD chart exhibits signs of a bearish reversal pattern forming near a key resistance zone (1.15800 - 1.16000), highlighted with repeated rejection wicks (🔴 red arrows). Price is currently trading at 1.15222, after failing to hold above the neckline of the rounded bottom pattern.
🔍 Key Observations:
🔺 Resistance Zone: Strong resistance has been confirmed multiple times (red arrows), indicating sellers are active at the top.
🟠 Double Top / Head & Shoulders Behavior: Price action shows topping formations (highlighted with orange circles), suggesting exhaustion of bullish momentum.
📉 Bearish Breakdown Possibility:
Price rejected near neckline and is showing bearish candle formations.
Breakdown from the current consolidation zone could push price toward the target zone at 1.14491, marked in purple.
This aligns with previous support structure, reinforcing a technical downside projection.
🔻 Support Zone: Around 1.13800 - 1.14000 is a strong area of demand and may act as the next bounce point if the bearish move continues.
📐 Chart Pattern Structure:
Rounded bottom formed earlier, but the failure to continue higher and breakout suggests a false breakout trap for buyers.
Downward sloping trendline broke, but now price is struggling to sustain above previous highs.
📌 Conclusion:
⚠️ Caution for bulls as price shows signs of weakness at resistance. A move below 1.15000 may initiate further downside toward 1.14491 and possibly lower. Short-term traders can watch for confirmation candles near this zone for entries.
📅 Short-Term Bias: Bearish
🎯 Target: 1.14491
⛔️ Invalidation: Strong breakout above 1.16000

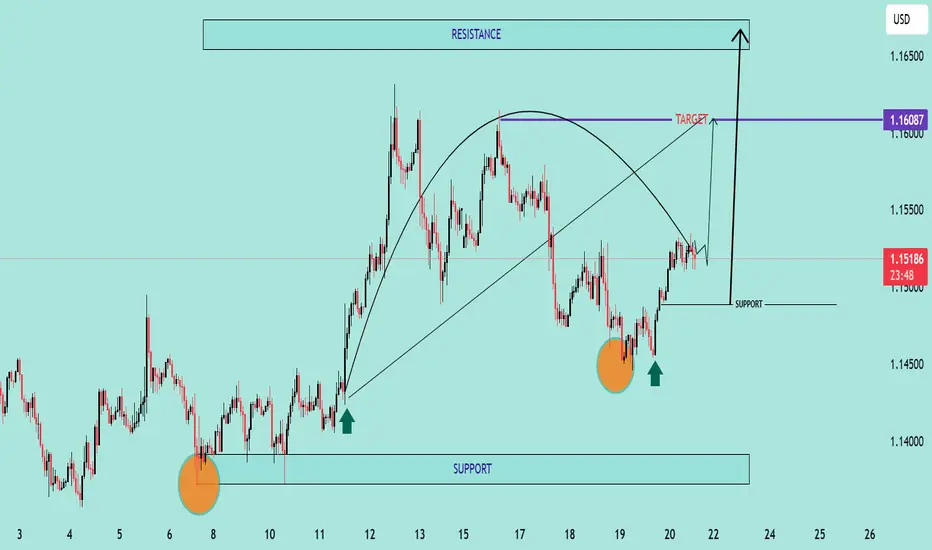
EUR/USD Bullish Reversal Breakout Pattern Technical Analysis Summary:
The chart illustrates a strong bullish reversal pattern forming on the EUR/USD pair:
🔹 Double Bottom Formation (🔶🔶):
Two clear bottom zones are marked with orange circles near the 1.14400–1.14500 area, indicating strong buying interest and support.
The second bottom confirms the double bottom pattern, often a precursor to an upward trend.
🔹 Support Zone (📉):
Firm support around 1.14450, as highlighted on the chart.
Price has respected this zone twice, bouncing back with bullish momentum each time.
🔹 Neckline Breakout (🔼):
Price is approaching the neckline zone at 1.16087, which acts as the bullish target.
A break and close above this neckline will confirm the reversal and open the way toward the resistance zone around 1.16500.
🔹 Projected Move (🎯):
If the neckline breaks, price is expected to surge towards 1.16500, aligning with the historical resistance.
This move completes the measured target projection from the double bottom structure.
🔹 Bullish Structure:
Higher lows and strong bullish candles are reinforcing the uptrend momentum.
Curved trajectory shows accumulation followed by a breakout phase.
📌 Key Levels to Watch:
Support: 1.14450 – 1.14500
Neckline/Target: 1.16087
Resistance: 1.16500
🛑 Invalidation:
A strong breakdown below support (1.14450) would invalidate this bullish setup.
EUR/USD Bearish Reversal AnalysisEUR/USD Bearish Reversal Analysis 📉🧭
🔍 Technical Breakdown:
Trend Structure:
EUR/USD was trading inside an ascending channel, respecting both support and resistance trendlines.
🔴 Double Rejection at Resistance:
Price action faced strong rejection near the upper boundary of the channel and resistance zone (~1.16500), forming a lower high, suggesting bearish exhaustion.
🟠 Key Breakdown Zone:
A critical horizontal support around 1.13560 has been identified as a short-term target zone. This level previously acted as a demand zone and now may be retested.
🔽 Forecast Path:
A projected bearish wave is anticipated:
A potential pullback or consolidation may occur before resuming the downtrend.
Once 1.13560 is broken, price could drop further toward the major support zone around 1.12000, marked by the previous accumulation area.
🟦 Support Zone:
This final target aligns with a major structural support from late May, strengthening the bearish outlook if the breakdown continues.
📌 Conclusion:
EUR/USD is showing signs of a bearish reversal after failing to sustain above resistance. As long as it remains below the mid-channel region, further downside toward 1.12000 is likely, with 1.13560 as the key short-term level to watch.

EUR/USD remains bullish
💡Message Strategy
The EUR/USD exchange rate continued to rise in the European session, gradually approaching the previous high of around 1.1600. The US dollar continued to be under pressure due to the market's rising expectations for the Federal Reserve to cut interest rates this year and the increasing uncertainty surrounding the US foreign trade policy.
US President Trump recently said that he would send letters to trading partners in the next one to two weeks to notify them of unilateral new tariff measures, which once again plunged the market into a state of worry. In addition, the US CPI annual rate in May was 2.4%, lower than the expected 2.5%, which strengthened the bet that the Federal Reserve will restart the interest rate cut cycle in September.
At the same time, the relatively hawkish signal of "interest rates close to neutral levels" released by ECB President Lagarde, coupled with the market's rethinking of the role of the euro in the context of "de-dollarization", jointly supported the upward structure of the exchange rate. Currently, traders are paying close attention to the US PPI data and initial jobless claims to be released in the evening, which may have a traction on the short-term trend of the US dollar.
📊Technical aspects
Judging from the chart, the current price of EUR/USD is near the upper track of the Bollinger Band (1.1548), and the Bollinger Band is in an expanding state. The width of the Bollinger Band has widened, reflecting the increase in volatility, suggesting that there may be a possibility of a large-volume breakthrough in the future.
In terms of MACD indicator, the DIFF line continues to rise and forms a golden cross with the DEA line. Although the momentum of the bar chart is not strong, it has not turned negative, indicating that the bullish momentum is moderate; RSI is running around 64, close to the overbought area but no divergence is formed. The market momentum is bullish and the technical side is slightly bullish.
Short-term support is at 1.1500 and 1.1440; if it effectively breaks through 1.1600, the upside space may reach 1.17.
💰 Strategy Package
Long Position: 1.1450-1.1550

The surge in the euro was expected
💡Message Strategy
Since the beginning of this trading week, a number of economic data released by the United States have been weak. Following the decline in the manufacturing PMI, the ISM service PMI for May released on Wednesday fell to 49.9, the first contraction in nearly a year. In addition, the ADP employment data was also far below expectations, with only 37,000 new jobs, far below the expected 115,000, which strengthened the market's concerns about the risk of a US recession, thereby dragging down the US dollar.
At the same time, risk aversion and uncertainty in the United States have not improved significantly, and trade tensions, debt prospects and weak US bond yields have put pressure on the US dollar. Obviously, in the game between eurozone monetary policy and US economic data, the euro wins.
📊Technical aspects
From the daily chart, the exchange rate has maintained a strong oscillation pattern since mid-April, and has generally been running between the middle and upper tracks of the Bollinger Bands. The upper track of the Bollinger Bands is currently at 1.1471, and the lower track is at 1.1118. The Bollinger Bands are slightly open, indicating a rebound in volatility.
The MACD indicator shows that the double lines form a golden cross, and the bar chart turns from green to red, suggesting that the downward momentum is weakening; the RSI indicator remains near 57, slightly in the neutral to bullish area, and has not yet reached the overbought level. The overall technical pattern tends to fluctuate upward. If it breaks through the 1.1500 area, it will continue to rise.
At present, the main idea is still to do more on the callback, and do not blindly chase the short.
Long Position: 1.14450-1.14650

EUR/USD is about to clarify its trend direction
💡Message Strategy
The recent trend of the euro is affected by the resonance of multiple macroeconomic factors. First, the eurozone CPI data for May showed that the overall annual rate dropped sharply from 2.2% to 1.9%, and the core CPI annual rate also fell to 2.3%, hitting a one-year low, which suppressed the market demand for the euro. This cooling trend of inflation has significantly strengthened the market's expectations that the European Central Bank will further cut interest rates. The current market has fully taken into account the possibility of a 25 basis point rate cut on Thursday, and even expectations of further rate cuts in July have fermented.
At the same time, US economic data is still weak. The ISM manufacturing PMI fell to 48.5, which has been in the contraction range for several consecutive months. In addition, the JOLTS job vacancies may hit a new low, which makes the dollar bulls lack support. In general, the euro is facing a tug-of-war between the eurozone's easing expectations and the weakness of the US dollar, and the market is generally optimistic about the trend.
📊Technical aspects
From the K-line pattern, the long and short sides are stuck near 1.1400, and a unilateral trend has not yet formed. It is worth noting that the high point of 1.1572 in mid-April has formed an obvious resistance band so far, and the upper 1.1500 is a psychological integer mark, and it is also the previous high, forming the first key resistance line. If it breaks through this level, it may usher in further upward space.
In terms of MACD indicators, the bar chart is currently oscillating near the zero axis, and the fast and slow lines are above the zero axis, indicating that the bullish momentum is dominant. RSI remains at 57.94, which is in the neutral to strong range, but has not entered the overbought area, and there is still potential for short-term growth.
💰 Strategy Package
Long Position:1.13750-1.13850

EURUSD | Bearish Divergence | Bearish MomentumCurrently, EURUSD is clearly in a downtrend, consistently forming lower lows and lower highs, confirming a bearish market structure. According to Dow Theory, the recent bullish momentum has now shifted into a confirmed downtrend. Additionally, the 1-hour trendline support has been broken, signaling weakness in the previous bullish leg. We now anticipate a pullback toward the recently broken structure or resistance zone, where further bearish continuation is likely.
On the 1-hour timeframe, a well-formed bearish divergence on the RSI adds confluence to our bias, indicating weakening bullish momentum and a potential trend continuation to the downside. Since our initial entry was slightly late, we’ve strategically placed a limit order near the retest zone and executed a partial position at the current market price to secure early exposure. Overall, structure and momentum both align with short-term bearish sentiment.

EUROUSD COT and Liquidity Analysis chart The EUR/USD pair has demonstrated a convincing upward momentum, which might suggest a sustained long opportunity. However, traders should exercise caution—this bullish move could be a classic trap. Despite the current strength, signs of exhaustion are beginning to appear in the price action and volume. The market may soon shift direction, and a downward correction or full reversal could be imminent. Now is not the time to chase the high—stay alert, as the fall could happen sooner than expected.

EURUSD BEARISH PRESSURE .?Technical Analysis:
Current Price Movement: The EUR/USD pair has recently dipped below the 1.1200 level, indicating a bearish trend.
Resistance and Support Levels: The resistance at 1.14600 remains a significant barrier, while the pair is approaching the support target of 1.09500.
Fundamental Factors:
US Dollar Strength: The US dollar has gained strength due to positive trade developments and robust employment data.
Eurozone Economic Outlook: The Euro faces challenges amid expectations of further rate cuts by the European Central Bank, contributing to its weakness against the dollar.
Conclusion:
Given the current technical indicators and fundamental factors, the EUR/USD pair is under bearish pressure. Traders should monitor key levels, with a focus on the support at 1.09500 and resistance at 1.14600, to inform their trading strategies

EUR USDHello Traders. I want to share my weekly analysis for EURUSD with you. We have a channel from July 2008 to April 2025. Currently, it has made a breakout and I hope it will continue the bullish scenario.
I am not a professional trader and I would be happy if you share your views regarding EURUSD.

FX Liquidity 'Worse Than Covid' Amid Tariff Shock. Long EUR/USD?Liquidity Seizes Up: Dealers Report Conditions 'Worse Than Covid' Amid Tariff Turmoil
The intricate plumbing of the global foreign exchange market, typically the world's deepest and most liquid financial arena, experienced a severe blockage in recent days, with dealers reporting liquidity conditions even more challenging than during the peak of the Covid-19 crisis in early 2020. Triggered by the sudden announcement of potential sweeping tariffs by former US President Donald Trump, the ability to execute large trades without significantly moving prices evaporated, creating treacherous conditions for market participants before a temporary pause on the tariff implementation offered a brief respite.
Reports indicate that available liquidity for a single transaction, or "clip," in major currency pairs plummeted to lows around $20 million. While this figure might still sound substantial, it represents a dramatic reduction from the norms in the multi-trillion dollar-a-day spot FX market, where clips of $50 million, $100 million, or even more could typically be absorbed with minimal market impact, especially in benchmark pairs like EUR/USD.
This liquidity drought occurred paradoxically alongside a spike in overall trading volumes. Both algorithmic trading systems and human traders on principal desks were highly active, reacting to the news flow and heightened volatility. However, this surge in activity masked a fundamental deterioration in market quality. High volume accompanied by low liquidity signifies frantic, often smaller, trades occurring across widening bid-ask spreads, with market makers unwilling or unable to provide firm quotes for substantial sizes. It's the market equivalent of a crowded room where everyone is shouting, but no one is willing to make a firm commitment.
Why 'Worse Than Covid'? Unpacking Dealer Sentiment
The comparison to the Covid-19 crisis is stark and revealing. The initial wave of the pandemic in March 2020 caused unprecedented volatility across all asset classes as the world grappled with lockdowns and economic shutdowns. FX liquidity certainly suffered then, with spreads widening dramatically. However, dealers suggest the current environment, driven by tariff uncertainty, felt different, and arguably worse, for several reasons:
1. Nature of the Shock: Covid-19, while devastating, was primarily a health crisis with economic consequences. Central banks globally responded with massive, coordinated liquidity injections and policy easing, providing a clear backstop (even if the initial shock was severe). The tariff announcement, however, represents a political and policy shock. Its potential impact is multifaceted – affecting inflation, growth, supply chains, corporate earnings, and international relations – and far harder to model. The policy path forward, including potential retaliation from other countries, is deeply uncertain.
2. Central Bank Reaction Function: During Covid, the playbook for central banks was relatively clear: provide liquidity and ease financial conditions. In response to potential tariffs, the central bank reaction is much less certain. Tariffs could be inflationary (raising import costs), potentially pushing central banks towards tighter policy, while simultaneously being negative for growth, which might argue for easing. This ambiguity makes it harder for markets to price in a predictable policy response, adding another layer of uncertainty that dampens risk appetite and liquidity provision.
3. Fundamental Uncertainty vs. Panic: While Covid induced panic, the underlying driver was identifiable. The tariff threat introduces deep uncertainty about the fundamental rules of global trade. This makes it exceptionally difficult for market makers, who provide liquidity, to price risk accurately. When risk becomes unquantifiable, the natural reaction is to withdraw, reduce quote sizes, and widen spreads significantly to avoid being caught on the wrong side of a large, unhedged position.
The Tariff Trigger: A Wrench in the Works
Donald Trump's proposal for a "reciprocal" or blanket tariff system, potentially starting at 10% on all imports with higher rates for specific countries, fundamentally challenges the existing global trade framework. The announcement immediately forced market participants to reassess:
• Inflation Outlook: Tariffs directly increase the cost of imported goods, potentially fueling inflation and impacting interest rate expectations.
• Economic Growth: Trade wars can disrupt supply chains, raise business costs, reduce export competitiveness (due to retaliation), and dampen consumer and business confidence, weighing on growth.
• Currency Valuations: Currencies of countries heavily reliant on exports to the US, or those potentially facing steep retaliatory tariffs, came under pressure. The US dollar itself experienced volatility as markets weighed the inflationary impact against the potential growth slowdown and risk-aversion flows.
This complex interplay of factors, combined with the political uncertainty surrounding the implementation and potential scope of such policies, created a perfect storm for volatility. Algorithmic systems, programmed based on historical correlations and data, struggled to navigate a potential regime shift driven by policy pronouncements. Human traders, facing heightened risk and uncertainty, became more cautious. Liquidity providers, facing the risk of being adversely selected (i.e., only trading when the market is about to move sharply against them), drastically reduced their exposure.
The Impact: Beyond the Trading Desks
The evaporation of liquidity has real-world consequences:
• Increased Transaction Costs: Corporates needing to hedge currency exposure for international trade face higher costs (wider spreads).
• Execution Risk: Asset managers rebalancing global portfolios find it harder and more expensive to execute large trades, potentially suffering significant slippage (the difference between the expected execution price and the actual price).
• Systemic Risk: In highly leveraged markets, poor liquidity can exacerbate sell-offs. Margin calls, as reportedly seen alongside the tariff news, can force leveraged players to liquidate positions rapidly into an illiquid market, potentially triggering a domino effect.
The temporary pause in the tariff implementation announced subsequently provided some relief, likely allowing liquidity to recover partially from the extreme lows. However, the underlying uncertainty hasn't disappeared. Until there is greater clarity on the future direction of US trade policy, the FX market is likely to remain susceptible to bouts of nervousness and reduced liquidity.
Should You Long EUR/USD Based on This? A Cautious No.
While the liquidity situation is dire and reflects significant market stress, using poor FX liquidity itself as a primary reason to take a directional view, such as longing EUR/USD, is generally flawed logic.
Here's why:
1. Liquidity is Not Direction: Market liquidity reflects the ease and cost of transacting, not necessarily the fundamental direction of an asset price. Poor liquidity is a symptom of high volatility, uncertainty, and risk aversion. While these factors can influence currency direction (e.g., risk aversion often benefits perceived safe-haven currencies), the liquidity state itself isn't the driver. Both buyers and sellers face the same poor liquidity.
2. Universal Impact: The reported liquidity crunch affected the global spot FX market. While specific pairs might have been hit harder at times, the underlying issue was broad-based risk aversion and dealer pullback, impacting EUR/USD, USD/JPY, GBP/USD, and others. It doesn't inherently favor the Euro over the Dollar.
3. Focus on Fundamentals and Sentiment: A decision to long EUR/USD should be based on a broader analysis of:
o Relative Monetary Policy: Expectations for the European Central Bank (ECB) versus the US Federal Reserve (Fed).
o Economic Outlook: Growth prospects in the Eurozone versus the United States.
o Risk Sentiment: Is the broader market mood risk-on (often favoring EUR) or risk-off (which can sometimes favor USD, though the tariff news complicated this)?
o Tariff Impact Analysis: How would the proposed tariffs, if implemented, differentially impact the Eurozone and US economies? Would potential EU retaliation harm the US more, or vice-versa?
4. Increased Trading Risk: Poor liquidity makes any trade riskier and more expensive. Spreads are wider, meaning entry and exit costs are higher. Slippage on stop-loss orders or take-profit orders is more likely. Executing large sizes is challenging. Therefore, even if you have a strong fundamental view to long EUR/USD, the current liquidity environment makes executing and managing that trade significantly more difficult and costly.
Conclusion
The recent seizure in FX liquidity, reportedly surpassing the severity seen during the Covid crisis onset, underscores the market's extreme sensitivity to geopolitical and policy uncertainty. The threat of sweeping tariffs injected a level of unpredictability that forced liquidity providers to retreat, even amidst high trading volumes. While the temporary pause offers breathing room, the fragility remains. For traders, this environment demands heightened caution, smaller position sizes, and wider stop-losses. Critically, basing directional trades like longing EUR/USD solely on the state of market liquidity is misguided. Such decisions must stem from a thorough analysis of economic fundamentals, policy outlooks, and risk sentiment, while acknowledging that poor liquidity significantly raises the cost and risk of executing any strategy.

EUR/USD Testing Demand Zone: What Are the Next Moves...?The EUR/USD currency pair is trading at the 0.5 Fibonacci retracement level on the 4-hour timeframe, indicating a potential point of support or resistance. This level is often referred to as the "golden zone," a critical area for traders looking for reversals or continuation patterns.
When we examine the 15-minute timeframe, we can see that the price action is consolidating within a defined range. This consolidation suggests that market participants are indecisive, with neither buyers nor sellers gaining a clear advantage at this moment.
To identify a potential trading opportunity, we should closely monitor the upper and lower boundaries of this consolidation zone. A break above the upper boundary could signal a bullish continuation, prompting us to look for long positions, especially if it's accompanied by increasing volume or other confirming indicators. Conversely, a break below the lower boundary may indicate bearish momentum, suggesting a potential entry for short positions.
As we await a decisive breakout from this range, it's important to remain cautious and patient, ensuring that any trade setup aligns with our overall trading strategy and risk management protocols. Keeping an eye on external factors such as economic news or events can also provide additional context for making informed trading decisions.

Euro Rises Above $1.09 Despite Tariff ThreatsThe euro climbed above $1.09, showing unexpected strength after President Trump announced 20% tariffs on all EU imports.
◉ Fundamental Rationale
● The currency got a boost because the U.S. dollar weakened. Trump’s tariffs made trade tensions worse and worried people about slower economic growth.
● Also, new numbers showed Eurozone inflation fell to 2.2% in March, the lowest since November 2024.
● This lower inflation means the European Central Bank doesn’t need to raise interest rates, making the euro more appealing to investors.
◉ Technical Observation
● From a technical perspective, an inverse head and shoulders pattern has formed, hinting at a possible trend reversal.
● A breakout above $1.095 could pave the way for stronger bullish momentum.

DXY Weakens, EUR/USD Breaks Out BullishThe DXY has broken its bullish trendline and a key support area. It is now approaching the next support level on the daily timeframe. Similarly, EUR/USD has broken out above its falling wedge pattern, signaling a bullish move for the euro. Consider buying EUR/USD and riding the trend until it reaches the resistance level.

Eurusd sell zoneThis is a EUR/USD (Euro/US Dollar) 1-hour timeframe technical analysis from FXCM, showing a sell trade setup with the following key details:
1. Entry Point: Around 1.05112, marked in yellow.
2. Stop Loss: Placed at 1.05690 (red zone), indicating the level where the trade will be exited if the price moves against the setup.
3. Target Level: 1.03978, shown in blue, representing the expected price drop and profit target.
4. Market Outlook: The analysis suggests a potential bearish move, with price expected to decline from the entry point, retrace slightly, and then drop further to hit the target.
5. Risk-Reward Ratio: The trade setup has a favorable risk-reward structure, with the potential reward being larger than the risk.
This setup is based on the expectation that EUR/USD will reverse from resistance and move downward, making it a short (sell) trade opportunity.

Sell Signal📉 EURUSD Sell Signal 📉
🔹 Wait for the best candle formation before entering the sell trade! Risk management is crucial.
🔹 The 1.04980 resistance zone is considered as the entry point.
🔹 Stop-loss is set at 1.05355 to minimize potential risks.
🔹 Target levels:
✅ First target: 1.04658
✅ Second target: 1.04133
⚠️ Always manage your risk! Make sure to get additional confirmations before entering the trade.

EUR/USD – Breakout or Fakeout? Key Levels to Watch!Hello again
EUR/USD has been pushing higher, testing a key resistance zone. The question is will it break through or get rejected?
📌 Here’s what I’m watching:
1.0541 is the key level price is hovering around. A clean break could push us towards 1.0644 & 1.0747.
If it fails to hold, we might see a retest of 1.0450 and 1.0427.
👀 My Take:
If price stays above 1.0541, we could see bullish continuation. But if we drop below 1.0450, then this might have just been a fakeout before heading lower.

EURUSD Buy📉 EURUSD Signal | 1H Timeframe Analysis
📆 Date: February 7, 2025
🔍 Strategy: Breakout and Risk Management
✅ Suggested Position: Buy after pullback confirmation
🎯 Targets:
First Target: 1.04016
Second Target: 1.04429
Third Target: 1.04938
🛑 Stop Loss: 1.03083
🔄 Entry Level: Confirmed breakout at 1.03372
⚠ Key Points:
Enter if a pullback to 1.03372 is confirmed.
Set stop loss at 1.03083.
Apply proper risk management.
📊 Technical Analysis: The previous downtrend has been corrected, and we are in a demand zone. If the key level breaks, an upward move is expected.
#Forex #TechnicalAnalysis #EURUSD
