Eurusdbreakout

EURUSD HARMONIC STRUCTURE IN DEVELOPMENTHi there, EURUSD is setting up for reversal. Watch lower time frame for buy the breakout and look for more upside. Clear break below and close below will change the bullish pattern. Good Luck.
When you try to take a position on the market, always study the chart from different points of view and never forget the 3 rules:
1st: Cuts losses!
2nd: Cuts losses!
3rd: Cuts losses!
NOTE: Looks like a corrective structure is making, still too early to tell but very soon we will see. If it is then buying the break out would be a NICE long-term position trade. For now, I am neutral.
NOTES:
- In either case, you should not risk more than 2%/3% of your asset.
- It does not matter if you lose a battle ... the important thing is to win the war!
If this analysis can be useful for you, leave a comment or LIKE!
Thank you for support!


EURUSD Possible ECB tradeEURUSD have been trading with in multi days bearish channel, so far it is testing the short term support with a compression underway, i am expecting the market to re-visit its prior lows and even lower to 1.1238., We have ECB rates decision today so likely this event can push the market. Watch out this market and Good luck trading.


EURUSD D1 Analysis . All information given inside the chart and i shared this for educational purpose only. Maximum i wont give the followup or update in the old chart posted as educational trade idea, sometimes i will...so please make sure if i posted the new chart for the same pair, it could be a possible wave count or update. Make sure that old one was invalid or possible or alternate wave and the new one is valid. Good luck and cheers.

EURUSD Pay attention to 1.1720Pay attention to 1.1720
If price pullback to here, we want to short
Structure is always good to help you determine
where is the ceiling and where is the floor

EURUSD X-FactorEURUSD
the X-Factor: this is something i have noticed on certain charts. The X happens when a wedge forms before the final drop. i then watch as the reversal hits the extended trend lines. if it hits certain markers then i trade. if not then its null.
sell then look for a buy :)
like, follow and comment ;)

EURUSD - RETEST BROKEN RESISTANCE - LONG OPPORTUNITYPrice broke a significant resistance, came for the retest and left a strong bullish candle. I`m going long!

EURUSD and invisible power behind price changesHi
Swing Analysis according to G.W.T. are the best in predicting next swing direction. Price by its self will show us where need to go. Going from Daily trough H4 down to one-hour chart you can very easy see how clear and simple is to predict direction of the next swing and trend direction.
Also pay attention to Momentum – power behind price movements.
No momentum no price change.
Daily Chart:
H4 chart:
Cheers,
Jim

EURUSD H4 2618 TRADE EURUSD H4 2618 TRADE
EURUSD Formed a Double Bottom and today it pulls back to 0.618 level. It is good to buy at 1.15880 level and Aim for a big rally.

EUR/USD - Still ShortEUR/USD is still short on the long term as it's still under important ema's as we can see on the 4 hour timeframe. We can expect it to fall further below and continue its bearish trend.
It hasn't yet found a strong support for it to reverse back up. As long as the broken ema's (200 and 50) keep acting as resistence, this move is active.
First TP: 1.1455
Second TP: 1.1410
Make sure to leave a like if you agree if this move! Your support is appreciated.
Trade safe.

EUR/USD - 100+ Pips Opportunity - ShortEUR/USD has broken down the 20 ema and 50 ema for the first time since the bullish trend on the 4h chart. Meaning that the trend is weakening and shifting of direction.
We have a valid continuation pattern further below if the 50 ema on the 4h chart holds as resistence.
As soon as the 1.16 level is broken, EUR/USD will continue its bearish trend.
One could enter this position by placing a pending order right below 1.16 say at 15.87.
First TP is at 1.1505
Second TP is at 1.1405
Trade safe!

EURUSD Big Trade setting upTaking a look at EURUSD Daily chart pennant pattern, i was expecting in my last analysis for the EURUSD to break the trend line but as always we have to listen to the market. But bottom line is this pattern is compressing, so we have to be patient which way it is going to be breaking out ultimately. If it breaks to the downside that means USD is going to get more strength, so lets see if it breaks the June lows and this is going to govern how other markets are going to be like Silver, Gold and certainly other currencies with respect to USD. To be honest, personally my view is bearish. But anyway, keep an eye on this market.
Trade Safe!

EURUSD channel break- pullback tradeUpdated EURUSD chart.. please refer to my previous chart for game plan.. for now, it broke the channel and pullback is happening.. going down as it broke major support.. next target 1.1515 area.
Please hit LIKE to support and follow for more trade ideas.
Vinny

EUR/USD - 500 Pips+ Opportunity - Bearish ContinuationEUR/USD broke over the 50 on the weekly chart. If that ema stays its resistance and prices fail to find a support and reverse, we can expect EUR/USD to continue its fall 500+ further below for the next months.
This is a good long term opportunity. However the pair decides to act, there is an opportunity to make a lot of money from (Whether it decides to find support and reverse back up/Accept the 50 ema as its resistance and break further below).
Happy trading!
P.S. - Remember, if you fail to manage properly your equity, no matter how good you are, you will fail to succeed.

EURUSD Buyers Pushing Price To 1.17600 AreaEURUSD heading to psychological area 1.17500 - 1.17600. 1.17600 may be the best target as it coincides with the trend line and fibonacci retracement.

EURUSD Buy Setup EURUSD broke up the short term down trendline, i am looking for buy to see if my bullish idea proves right to make me money this week. I am expecting targets 1.1855 and 1.1931. If you have your trading strategy, consider buying.
Trade Safe!

EURUSD-Ready to Fly?EURUSD is technically very strong on monthly chart. It has taken support at 1.15300-1.15200 levels for 4 weeks. Consolidation may get over this week and we can expect good upside movement for upcoming 3-4 weeks. Risk only 1% per trade.

EURUSD Upside to ContinueMy last call for long Euro still in, whilst looking to build the position now as EURUSD had an expansion bar in London session, i am expecting that the upside is likely to continue till 1.1950, looking for buy setups here whilst trailing the stops with green line tracking below the price bars.
Join my webinar this Sunday for a $50k to $115k trading challenge that I have smashed this year. Find the link below.
Happy Trading and have a great weekend.

EURUSD Buy SetupEuro just broke out today-i am looking for a pullback to get long position for potential target to 1.1950, whilst stops below 1.1505. Still larger degree picture is bearish-ST momentum indicators just turning so i want to give it a try if it works for me.
Happy Trading.

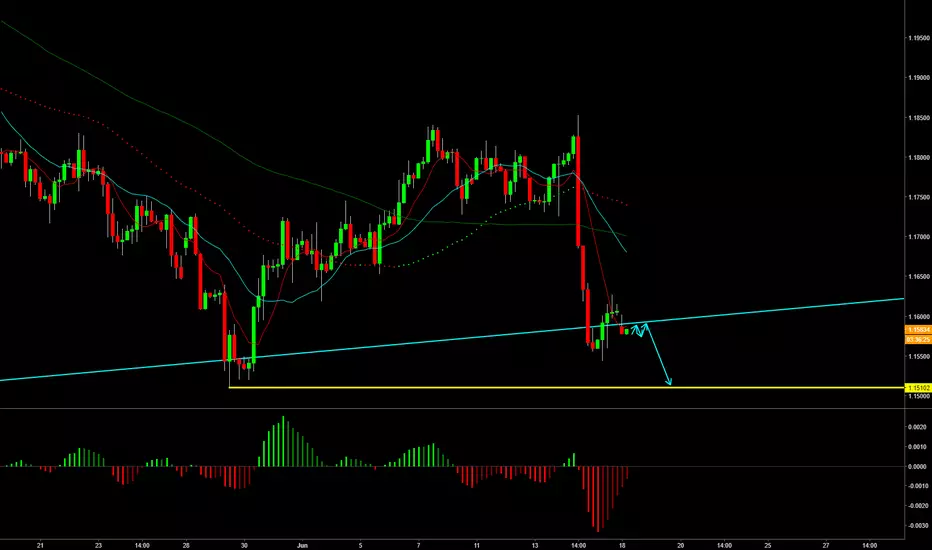
EURUSD ST sell setupEURUSD broke out the trendline and still trading below it, momentum indicators are suggesting for the downside to continue to revisit the lows around 1.1510. So i am looking for sell setups around 1.1600-1.1590 for a target to 1.1510, whilst stop above 1.1629