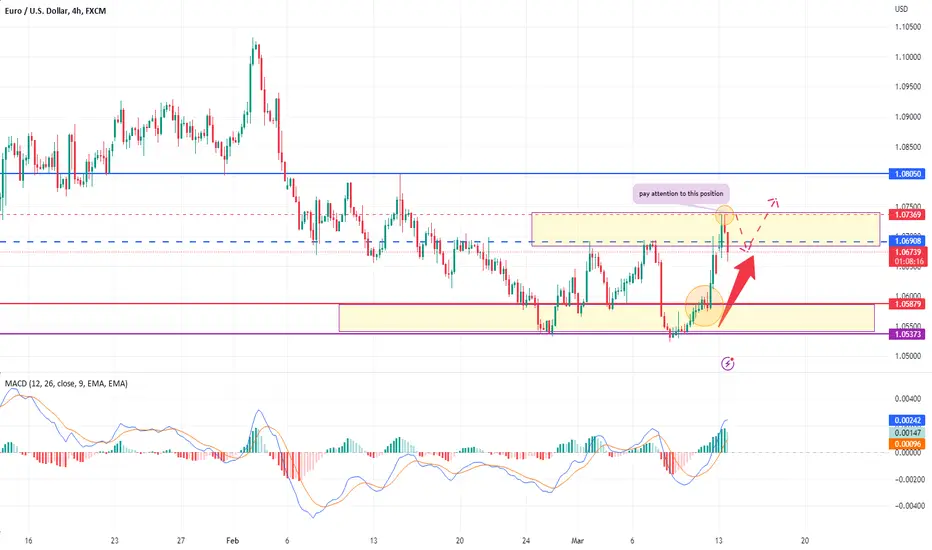
Long EURUSD, target 1.10-1.113
EUR/USD is currently near the resistance level. Today, we need to pay attention to the support near 1.088 and the resistance near 1.094.
Judging from the current situation, today's strategy will be based on low long positions. I will tell you when to trade. Stay tuned.
I will release more strategies later, including OIL, gold, GBPUSD, BTC, etc. If you are trading, you can follow me, if you have any questions, you can tell me, and I will help you answer them
Eurusdbreakout

20 Reasons BUY EURUSD 🔆MULTI-TIME FRAME TOP-DOWN ANALYSIS OVERVIEW☀️
1:✨Eagle eye: bullish trend also filled corrective wave
2:📆Monthly: after a valid low price goes to a corrective back
formaatting a builduo here in favor of bulls
3:📅Weekly: choch done also make support with proper lower high low
4:🕛Daily: bullish structure here stating an impulsive move
😇7 Dimension analysis
🟢 analysis time frame: daily
5: 1 Price Structure: bullish
6: 2 Pattern Candle Chart: record session count and correction done
7: 3 Volume: bullish volume is in power
8: 4 Momentum UNCONVENTIONAL Rsi: protected 40 areas also bullish formation here long consolidation
9: 5 Volatility measure Bollinger bands: walking on the band and middle band support
10: 6 Strength ADX: sharp bear dmi up, but bulls are still in power
11: 7 Sentiment ROC: eur stronge
✔️ Entry Time Frame: h1
12: Entry TF Structure: right now is bearish, but based on sentiments and bigger tf, we are seeking buy entries only
13: entry move: impulsive
14: Support resistance base: h4 d1
15: FIB: trigger event done
☑️ final comments: test entry. If it confirms, add 2nd entry at the upper side breakout
16: 💡decision: buy
17: 🚀Entry: 1.07609
18: ✋Stop losel:1.0773
19: 🎯Take profit:1.089
20: 😊Risk to reward Ratio: 1:5
🕛 Excepted Duration: 2 days

EUR-USD - SHORT POSITIONOn the 4h chart we have this descending, bearish trend that is indirectly connected to the 15min chart where we have an upward trend line that can be a bear flag and if it is broken we can enter sell in the area mentioned in the chart with stop loss and take profit .
#FreeSignal because I make my #money from #trading.

EURUSD ROAD TO 1.16 AND BEYOND!The EURUSD IS LOOKING PROMISING!
Many positive economic data and a recovery in its economy has been surrounding the EURUSD lately. As US has attempted to drag the EURUSD down with its rapid increase in interest rates the EURUSD has had a strong recovery as well.
On september the EURUSD was at a price of $0.99 for the first time since 2002! IT WAS A NO BRAINER BUY IF YOU SAW IT AT THOSE PRICES!!!
Here are other factors that are influencing on its rise:
Strong economic data: The Eurozone has recently seen positive economic data. This suggests that the Eurozone economy is recovering from the previous economic attack, which may support the value of the euro.
Interest rate differentials: The European Central Bank (ECB) has kept interest rates low, while the US Federal Reserve has been alarmingly increasing interest rates. This could make the euro relatively more attractive compared to the US dollar, as investors seek higher returns on their investments.
Weakness in the US dollar: The US dollar has weakened against other major currencies recently, in part due to concerns about rising inflation and the potential for the Federal Reserve to raise interest rates more. This has made the euro relatively more valuable in comparison.
Have a nice day!


EURUSD Swing Trade In Eurusd there is a swing trade oppertunity as its in up trend and taking support of last swing low ,so from here can spike for new high ,keep SL bellow last swing .

EURUSD: Buy at low levels
On the 30-minute chart, we can see that the recent lows have been steadily rising, indicating an upward bias in the trend. On the 1-hour chart, the current market is near support (which was previously a resistance level, but was broken through yesterday and has now become a support level). As long as there is no significant break below this level, buying at these low levels is possible.
The target reference point is the previous high, with a potential break above targeting around 1.08. Support below is at 1.065-1.063.

Eurusd sellPeace be upon you, there is a great possibility of the price going down. With a re-test of the current resistance. There is also the moving average 200, which is a strong resistance. And break the bullish trand. What do you think my friends!?

EUR/USD The next target may hit hereEUR/USD Outlook: Reversal of Bearish Trend with Potential for Upside to this Level
Market focus is on the European Central Bank (ECB) interest rate decision on Thursday, March 16, with an expectation for a 50 basis point increase. Additionally, Tuesday, March 14, will see the release of the US CPI for February, which will be closely watched. Technically, EUR/USD is inclined towards a bullish trend in the short term.
EUR/USD Fundamental Outlook: Focus on US CPI on Tuesday
Given the persistently high inflation in the Eurozone, which remains well above the ECB's 2% target level and the continued rise in core inflation, the market generally expects the ECB to raise interest rates by 50 basis points in March. ECB President Lagarde has previously stated that all recent data confirms that a 50 basis point rate hike is highly probable. The ECB has also emphasized that it will not make any pre-commitments regarding interest rates, and future rate hikes will depend on specific data.
Furthermore, it is worth noting that there is increasing disagreement within the ECB, with hawkish officials calling for four consecutive 50 basis point rate hikes, while other dovish officials suggest that the lag effect of interest rate increases should be considered and that action cannot be based solely on data. After the interest rate decision on Thursday, March 16, the ECB press conference will be the focus of market attention.
In addition to the ECB interest rate decision, the US CPI for February, which will be released on Tuesday, March 14, will be another key driver for EUR/USD. The market generally expects the US CPI to have an annual rate of 6.00% in February, lower than the previous value of 6.40%; the core inflation rate is also expected to continue to fall slightly to 5.50%, slightly lower than the previous value of 5.60%.
The latest US nonfarm payrolls report showed a significant increase in employment in February, exceeding expectations, but wage growth slowed, and the unemployment rate rose from 3.4% to 3.6%. The Federal Reserve is closely monitoring changes in economic data, and if inflation data continues to decline, it will further support the Fed's decision to raise interest rates by only 25 basis points in March.
EUR/USD Daily Trend Chart: Bullish
On the daily chart, as of now, EUR/USD has rebounded significantly, largely reversing the downward trend of the currency pair since early February and is inclined towards a bullish trend in the short term. The immediate resistance may be at the high point of February 14 (1.0804) and the low point of January 31 (1.0802). The market sentiment is currently heavily bullish, and there will be no significant correction for the time being. Last week's recommendation to buy on the rise resulted in a significant increase, and it is advisable to continue holding and looking for further upside potential.
Market changes are fast-paced, and it is essential to keep track of developments to avoid unnecessary losses.
EUR/USD: High position short
Today's impressive PMI data released by the Chinese government has led to a significant influx of funds into the renminbi in the international market, causing the US dollar index to suddenly fall. This is clearly a short-term impact and will not fundamentally change the overall situation. Therefore, after the abnormal market volatility dissipates, the market will return to its original rhythm.
As for the operation of the US dollar index, the short-term level is still judged as looking for opportunities to buy on dips. Correspondingly, for the EUR/USD currency pair, it is recommended to short at the high point and combined with
market analysis, the following suggestion is given:
Short position recommended in the range of 1.0640-1.0660, with targets at 1.0620, 1.0600 and 1.0580.
FX:EURUSD TVC:DXY FX:AUDUSD FX:USDJPY

EURUSD💥4H-TIMEFRAME ANALYSISEURUSD💥4H-TIMEFRAME ANALYSIS
💗Hello ladies and gentlemen
This is my new idea for 💥EURUSD
I hope my idea is clear
Support me by like and share thank you
Stay Safe💯💲💲💲
Good luck💰😍

update for eurusd pairDeliberately breaching the trend, then descending to the aforementioned support. That is, the point of purchase.. Now we target the point of sale to take profit.

EURUSD Short RetracementThis is a total break down of my EURUSD analogy of the coming movements in the market.
Key Zones of liquidity is crucial to be tested again watch closely.

AW Euro Dollar Analysis - Looks Like Wave 3 is About to Begin...In this Euro update the waves have made themselves pretty clear in that we could be about to breakout higher.
These shallow corrections consolidating at the highs conform with Wave 3 price action.
Would not be surprised if we start to move up with extreme force in the coming days.
Regardless of the waves all I see here is continuous higher highs and good reasons to consider long positions.
The line in the sand for this view would have us placing a stop at 1.08742.
***AriasWave is not the same as Elliott Wave so your counts may differ to mine if you happen to use it.***
Remember to use Disciplined Money Management Principles to ensure longevity as a trader.
If you don't know the long term pattern shouldn't you be doing your research instead of just following the crowd?
Just remember: I am not a financial adviser; I suggest using this only as a guide. Always do your own research.

EURUSD - CURRENT SENTIMENT ANALYSE , DXY #EURUSD
- As of last day, the MARKET SENTIMENT for EUR was slightly UP SIDE. The main reason for that is that the dollar is starting to weaken quite a bit. Dollar strengthened after DECEMBER FOMC. All MARKETS including STOCKS and COMMODITIES are going down slightly due to the OFF of MARKET RISK.
But with RETAIL SALES, ISM MANUFACTURING DATA, and FED UPDATES, this situation may change in the future. Therefore, if the FED continues to be HAWKISH, the USD can definitely go UP. So keep an eye on FED UPDATES and US DATA.
- Definitely, according to the market structure, EURUSD can go down to the support level of 1.0627 below. At the moment, there is quite a DOWN SIDE BIAS in the MARKET for EUR. After that, EURUSD can go up to 1.1003 LEVEL. If the MARKET SENTIMENT changes and STOCKS and COMMODITIES start going UP, there will be more EURUSD BUY. So keep an eye on it.

EURUSD Will Fall !! EUR-USD broke out of the rising wedge
And the breakout is confirmed
So after the pullback and retest resistance zone at 1.06382
I will be expecting a move down

20 Reasons for short EURUSD 🤑TOP DOWN ANALYSIS OVERVIEW🤑
🧐Eagle eye: 21-year-old Supported ORDER block is Taped, and after it, prices go up as retracement or corrective move
Monthly: there is one monthly IMBALANCE AREA AROUND 1.0794. It is hard to price reach because of too many resistances between the current level and the monthly FVG
Weekly: price taped with extreme weekly imbalance or FVG area and made a strong reversal candle last week, but this week candle is trying to engulf it and is still below the high, so there is no need to worry because the previous high is protected yet
1 Structure analysis time frame: Daily structure is bullish, and the price is not able to break the previous high we know well previous high is already at the weekly FVG resistance level so
2 target time frame: Daily Breakout points Around 1.0159 to 1.0090 areas 1st initial target if prices give us clear signal because price also give us a daily higher low excepted move is bear or reversal
3 Current Move: Impulse
4 Entry Time Frame: h4
4.1 Entry TF Structure: Choch
4.2 entry move: Sideways Yet
5 Support resistance base: Previous H4 Orderblock
6 FIB: Trigger event at daily
7-candle Pattern: Keyreversals
8 Chart Pattern: Double Top
9 Volume: Big volume at 1st high Low on 2nd Reversal signal because prices make a double top with 2nd leg low volume
10 Momentum UNCONVENTIONAL Rsi: Range Shift from bull to sideways
11 Volatility measure Bollinger bands: M pattern with a volatility divergence Reversal signal
12-strength ADX: Show strong for bulls for an extra signal. We can wait for dmi cross over
13 Sentiment ROC: Eur weaker than USD in terms of rate of change
14 final comments: With open high, we can go with the bears' sell
15: decision: sell
16 Entry: 1.0352
17 Stop losel: 1.04560
18 Take profit: 1.0010
19 Risk to reward Ratio: 1:3
Excepted Duration: 10 days

EURUSD Breakout Short!EUR-USD broke the rising support
And made a pullback and retest
So I think that it will go down
Towards the breakout lows

EURUSD Local Long! EURUSD broke the falling resistance
And is now back down to retest
The support confluence of the falling
And horizontal support lines AT 0.99363
Thus I am bullish biased
And I think that a local move up
Is likely to happen on the pair

EURUSD LONGdaily; bearish
4h; bullish
imma wait for the price to break above the range zone
with a huge momentum not just the break alone imma be waiting for the continuation momentum breaking the resistance zone, the previous structure and above the emas
then imma go to the 1h
1h ; i wanna see an engulfing candle
and a previous structure to put my SL
price above the 14/5 ema and the 200ema as well
TP; will be next T/P no greed
stay patient and dont let fomo get into you, wait till u see a strong bullish momentum then enter, dont get caught in a fakeout, market may accumilate liquidity take those stops and drop down before it shoots to the upside, son stay patient on ur setup and manage ur acc

EURUSD LONGOn the monthly/weekly timeframe price is full bearish but it’s on this major support zone that the price got rejected from it twice so m expecting a bullish move before any bearish continuation.
The daily is bearish expecting a pullback to the previous high and also the golden fib number
4h; price is consolidating
M looking for the price to break above the sideways zone with a bullish momentum candlestick after having a little structure to assure a safe stop loss
Break above the LH structure
Break above the resistance zone
Break above the emas
1h; looking for an engulfing candle as an entry
Placing a safe stop loss on a previous structure close to the 200ema and above the 14/5
Tp; nearest s/r

EURUSD Resistance Cluster!EUR-USD went up and is now
Retesting a resistance cluster
Of the falling and horizontal
Resistance levels at 1.00500 from where
I am expecting a move down

