EURUSD ahead of NFPEURUSD is still trading within the range established after Wednesday’s news.
We’re watching for a close above 1,1503, which would confirm a potential buying opportunity.
Today at 1:30 PM (London), the NFP data will be released, which could further impact price action - especially if a reversal is underway.
In case of a decline, the next key support level to watch is around 1,1346.
Eurusdbuy

LONG ON EUR/USDEUR/USD is currently at a major demand level after sweeping sell side liquidity.
The Dxy (Dollar) is overall bearish. I expect the dollar to fall and EUR/USD to rise to the previous high / supply level for over 200-300 pips.
News most likely will affect this pair in terms of volatility.

My opinion on the euro to dollarI think the trend is bearish in the medium term, although we may have an upward correction first, so you can wait to enter when shorting.

EURUSD after the FedEURUSD continues to trade within the reversal zone highlighted in our previous analyses.
Following yesterday’s Fed decision, we’re seeing additional downside movement, though price hasn’t yet reached the support level at 1,1346.
Our outlook remains unchanged – we’re watching for the end of the pullback and will look for buying opportunities afterwards.
The H1 candle formed during the news release can serve as a reference. A break and close above it would signal a potential reversal to the upside.
Conversely, if price breaks and closes below that candle, it would suggest the correction is likely to continue toward lower levels.

EURUSD BUYEUR/USD retreats below 1.1550 ahead of US data
EUR/USD finds it difficult to stage a rebound following Monday's sharp decline and trades in negative territory below 1.1550 on Tuesday. The US Dollar (USD) preserves its strength ahead of consumer sentiment and employment-related data releases, weighing on the pair.
From a technical point of view, the EUR/USD pair is poised to extend its slump. It keeps falling below a mildly bearish 20 Simple Moving Average (SMA), which provides dynamic resistance at around 1.1690. The 100 SMA, in the meantime, maintains its bullish slope, albeit partially losing its upward strength at around 1.1340. Finally, technical indicators keep heading south well below their midlines, and at multi-week lows, in line with a bearish extension ahead.
The near-term picture shows EUR/USD is oversold and may bounce or consolidate before the next directional move. In the 4-hour chart, technical indicators turned flat at extreme levels, yet it keeps developing below all its moving averages, which skews the risk to the downside. A firmly bearish 20 SMA is crossing below the 100 SMA and aims to extend its slide below a directionless 200 SMA, usually a sign of prevalent selling interest.
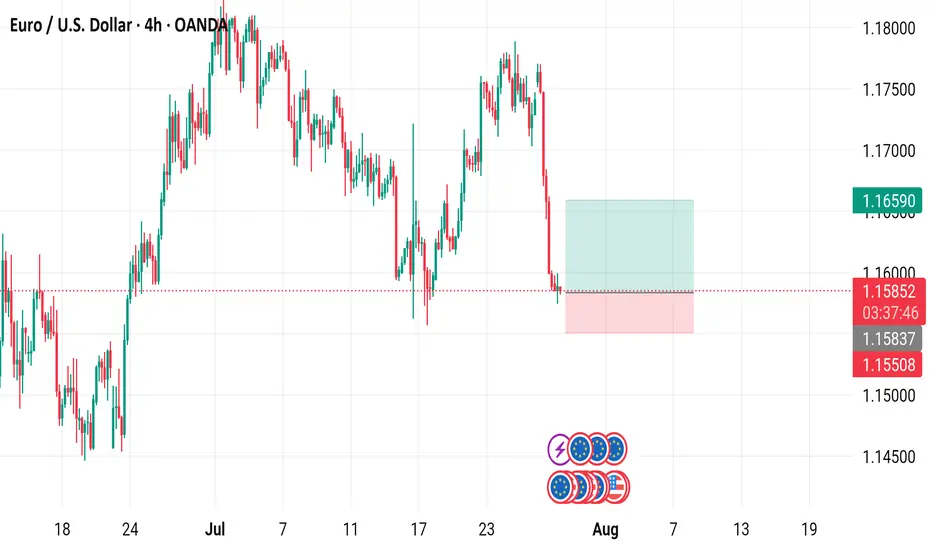
SUPPORT 1.15566
SUPPORT 1.15819
SUPPORT 1.15566
RESISTANCE 1.15114

EUR/USD 4-Hour Chart Analysis4-hour performance of the Euro/U.S. Dollar (EUR/USD) currency pair, showing a recent decline from a high of 1.15853 to 1.15845, with a -0.04% change. Key levels include a "Buy" signal at 1.5 and a "Sell" signal at 1.15838. The chart highlights a significant drop with a shaded support zone around 1.16590 to 1.15845, indicating potential trading opportunities or resistance levels as of July 29, 2025.
EURUSD BUYThe US Dollar (USD) gapped lower at the weekly opening amid optimism fueling demand for high-yielding assets, following news that the United States (US) and the European Union (EU) reached a trade deal.
The US and the EU agreed a 15% tariff on most European goods entering the US, much higher than the average 4.8% exporters face these days. No rates will apply to EU exports in important sectors, including aircraft parts, some chemicals, semiconductor equipment and some agricultural products.
The EU response to the headline was uneven. European Central Bank (ECB) policymaker Peter Kazimir said on Monday that the trade deal reduces uncertainty, but it is unclear for now how it impacts inflation. However, the French prime minister, François Bayrou, said the EU has capitulated to Donald Trump’s threats, adding it is a “dark day” for the EU. The trade focus now shifts to the US-China as officials from both countries resume talks in Stockholm.
The EUR/USD pair peaked at 1.1771 during Asian trading hours, but changed course early in Europe, with the USD surging across the FX board, resulting in the pair shedding over 100 pips.
The macroeconomic calendar had nothing relevant to offer at the beginning of the week, but will be flooded with first-tier releases, including US employment-related data ahead of the Nonfarm Payrolls report on Friday, the preliminary estimates of the Q2 Gross Domestic Product (GDP) for the US and the EU, and inflation updates. On top of that, the Federal Reserve (Fed) will announce its decision on monetary policy on Wednesday.
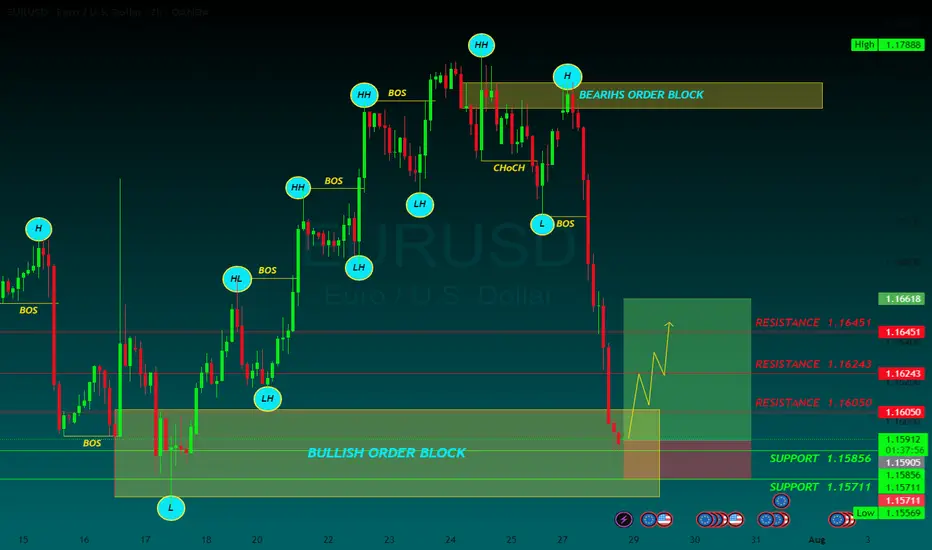
RESISTANCE 1.16050
RESISTANCE 1.16243
RESISTANCE 1.16451
SUPPORT 1.15856
SUPPORT 1.15711
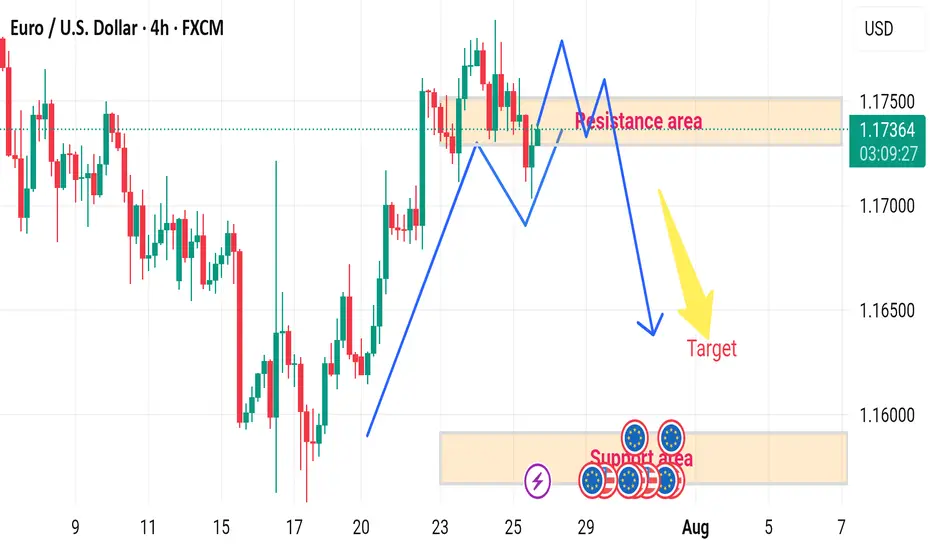
EUR/USD H4 DOWNWARD 🔄 Disrupted EUR/USD 4H Analysis
🟢 Current Context:
Price is currently at 1.17375, slightly below the resistance area (1.17400–1.17500).
Market shows a recent bullish impulse, followed by consolidation within the marked resistance zone.
Projection in the image suggests a double-top pattern forming at resistance, followed by a bearish reversal toward the target demand area (~1.15800–1.16000).
---
⚠️ Disruption Points:
1️⃣ Failed Double Top Scenario
Disruption Hypothesis: Instead of forming a clean double top and reversing, price may break above the resistance zone at 1.17500.
Reasoning: Strong bullish momentum and recent higher highs indicate potential for bullish continuation, invalidating the bearish target.
Disrupted Path: Price could break out → retest the resistance as new support → continue toward 1.18000–1.18300 zone.
2️⃣ Mid-Range Liquidity Trap
The current range may act as a liquidity trap:
Smart money could push the price slightly below support (fake breakdown), attract sellers, then reverse sharply upwards.
This would trap retail sellers targeting the 1.15800 zone.
EURUSD LONG AND EDUCATIONAL BREAKDOWN ECB INTRESTRATE RELEASE The European Central Bank is expected to hold key rates for the first time in over a year on Thursday.
The Eurozone inflation rate has hit the ECB’s 2% target as the US-EU trade deal uncertainty lingers.
The EUR/USD pair could experience intense volatility following the ECB policy announcements.
The European Central Bank (ECB) is on track to leave its key interest rates unchanged after its July policy meeting, after having reduced rates at each of its last seven meetings. The decision will be announced on Thursday at 12:15 GMT.
The interest rate decision will be followed by ECB President Christine Lagarde’s press conference at 12:45 GMT.

EUR/USD Set to Fly – Don’t Miss This Perfect Channel Breakout!Hi traders!, Analyzing EUR/USD on the 30-minute timeframe, we can observe that price is respecting the ascending channel and reacting to the dynamic trendline support (green dashed lines). A recent bounce suggests a potential bullish continuation within this structure.
🔹 Entry: 1.17399
🔹 Take Profit (TP): 1.17640
🔹 Stop Loss (SL): 1.17056
Price remains above the 200 EMA, confirming a bullish environment. The bounce aligns with the lower boundary of the channel and follows a short consolidation period, indicating buying pressure. The RSI also shows signs of recovery after approaching oversold levels, supporting the idea of upward momentum.
This long setup offers a favorable risk/reward ratio and aims to capture continuation toward upper channel resistance.
⚠️ DISCLAIMER: This is not financial advice. Trade at your own risk and always use proper risk management.

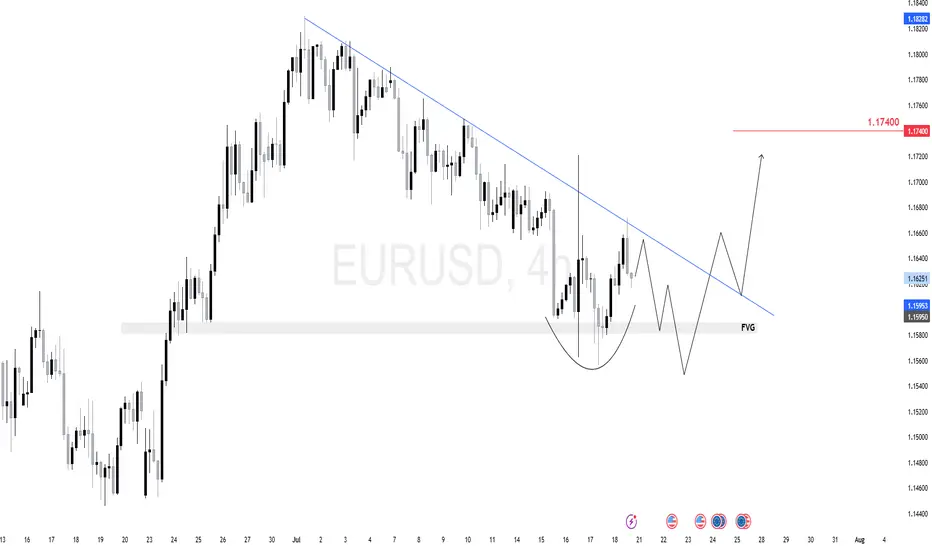
$EU (EURUSD) 4HEURUSD is forming a potential inverse head-and-shoulders just above a 4H fair value gap (FVG).
We expect one more dip toward the 1.1580–1.1595 zone to complete the right shoulder and tap demand.
From there, a breakout above the descending trendline can target 1.1740 next.
The key here is watching the reaction after the FVG test — if buyers step in strong, we ride it up.
EURUSD BUYThe EUR/USD pair edged lower in the past week, settling a handful of pips below the 1.1700 mark, further retreating from the multi-year peak posted early in July at 1.1830. Financial markets kept revolving around the United States (US) President Donald Trump's targets. With geopolitical woes cooling down, Trump’s focus returned to tariffs, and the Federal Reserve’s (Fed) wait-and-see stance on monetary policy.
Trump fixated on tariffs and Powell
Since the week started, speculative interest kept their eyes on the July 9 tariffs deadline. Trump announced massive retaliatory levies on over 180 trading partners in May, quickly establishing a 90-day grace period afterwards. His goal was to clinch better trade deals with all these nations. But as the date loomed, deals were scarce. The US made some trade arrangements with some minor economies, such as Vietnam, but there were none with major counterparts, nor, of course, with China
TP 1 1.162
TP 2 1.165
TP 3 1.168
RESISTANCE 1.154

EURUSD Forming Bullish Continuation SetupEURUSD is currently retesting a key breakout zone that previously acted as resistance and is now serving as strong support around the 1.1620–1.1630 area. After a healthy bullish impulse in recent weeks, the pair is pulling back in a controlled manner, likely forming a bullish continuation setup. I entered from earlier levels and remain confident in a further upward move, with the structure showing signs of a new bullish wave forming.
From a fundamental perspective, the euro is gaining strength as the European Central Bank (ECB) continues to signal a more cautious stance on rate cuts compared to the Federal Reserve. US inflation data released last week came in softer than expected, increasing speculation that the Fed could start its rate-cutting cycle as early as September. This shift in monetary policy outlook has weighed on the US dollar, opening up room for EURUSD to push higher.
Additionally, eurozone macro data is showing early signs of recovery, especially in Germany, where industrial production and sentiment indicators are slowly improving. As inflation in Europe trends lower but remains sticky, the ECB has fewer reasons to rush into easing, which adds strength to the euro over the medium term. This divergence is a critical driver of the current bullish sentiment in EURUSD.
Technically, the market is respecting a clean demand zone, with momentum indicators starting to flatten after the recent correction. With the trend structure intact and fundamentals aligned, I'm targeting the 1.2180–1.2200 zone as the next leg of this bullish cycle. Price action remains favorable, and the broader sentiment on TradingView is also increasingly bullish, confirming my conviction in this setup.

Long Opportunity for EURUSDEURUSD is currently in a retracement within a bullish trend with clear Bullish market structures in place.
Price is currently approaching the break and retest level at 1,16285... a potential pivot point which acted as a resistance level in the past. On the 4-hour timeframe, price is trading below the 21 and 50 SMA due to the slow nature of the retracement and we are seeing bearish momentum on the RSI.
Need to see the Bulls stepping in with clean bullish momentum on the 4 hour chart to confirm the bullish market directionality before looking to take a long position. will also be observing the bearish trendline break as an additional point of confluence to take the long trade

EURUSD H4 RISES 🔄 Disrupted EUR/USD Analysis (4H)
📉 Current Structure:
Price is hovering around 1.17298, showing hesitation at the resistance of a potential bearish flag.
While the chart labels this zone as “bullish,” there are signs of market indecision, possibly a fakeout trap.
⚠️ Key Disruptions:
1. Bullish Trap Risk:
The price formed a short-term M-pattern (double top inside the orange circle), indicating bearish exhaustion rather than continuation.
The expected breakout to the upside may fail if bulls don’t sustain volume.
2. Support Area Weakness:
The support zone around 1.17000 has been tested multiple times. If it breaks, it could turn into a strong resistance, flipping the sentiment.
3. Macro Influence:
Upcoming EUR and USD economic events (noted by icons) could cause high volatility and break structure unexpectedly.
A strong USD report could reverse bullish momentum, sending EUR/USD toward 1.16500 or lower.
4. Bearish Continuation Scenario:
If the market breaks down from the current consolidation, expect targets at:

EUR/USD 2-Hour Chart (OANDA)2-hour performance of the Euro/U.S. Dollar (EUR/USD) currency pair on the OANDA platform as of July 10, 2025. The current exchange rate is 1.17225, reflecting a slight decrease of 0.03% (-0.00032). The chart includes buy (1.17234) and sell (1.17216) prices, with a highlighted resistance zone and recent price movements over the past month, showing fluctuations between 1.16500 and 1.18000.

EUR/USD Bullish Setup from Key Support📈 EUR/USD Bullish Setup – Targeting 1.18500
Timeframe: 4H
Pair: EUR/USD
💡 Analysis:
The market is currently showing strong bullish momentum with clear support zones holding price action. After a healthy retracement, price is reacting well around the recent support level near 1.16800. If this level holds, we can anticipate a bullish continuation toward the target resistance zone at 1.18500.
🔶 Support Levels:
1. 1st Support Area: ~1.16800 – Recent consolidation and strong reaction zone
2. 2nd Support Area: ~1.15800 – Previous breakout level
3. 3rd Support Area: ~1.14300 – Major structure support
🎯 Target Point:
• 1.18500 – Major resistance and previous swing high
📊 Trade Idea:
We are looking for a bullish move from the current price level (~1.1700) toward the resistance at 1.1850. If price respects the nearest support zone, long entries with proper risk management could be favorable.

Buying opportunities on EURUSDYesterday, EURUSD touched the support level at 1,1683 and bounced off it.
This opens up the potential for a new bullish move and buying opportunities.
We may see another test of the support zone, but the overall trend remains unchanged.
The next resistance levels are 1,1813 and 1,1916!

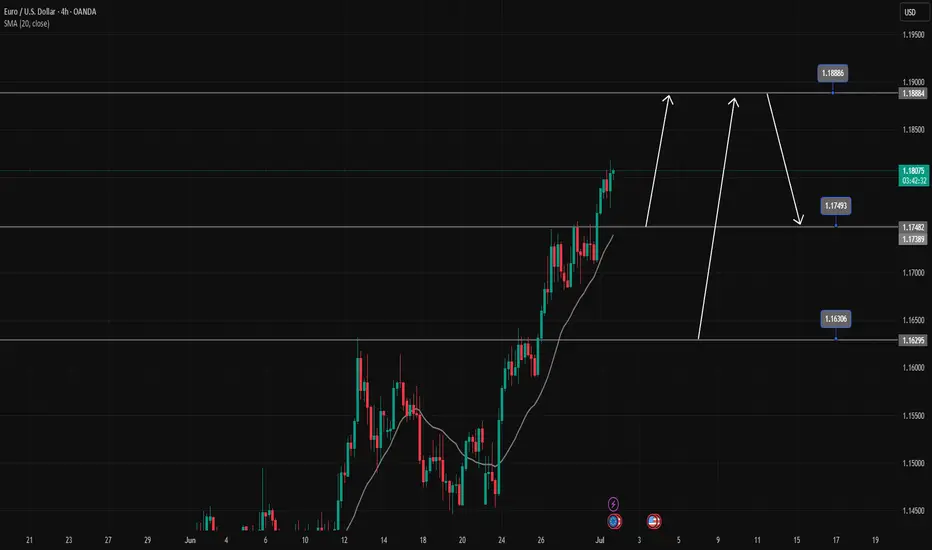
EURUSD is in a strong uptrendEURUSD is in a strong uptrend, Price just broke the resistance zone of 1.175.
All the bullish momentum is heading towards the resistance zone of 1.188.
If there is a close of the h4 candle below the resistance zone of 1.175, there will likely be a Pullback to 1.163 to find more buying momentum towards the target at the resistance zone of 1.188
📈 Key Levels
Support: 1.175-1.163
Resistance: 1.188
📊 Recommended Trade Setups
BUY EURUSD 1.175-1.173 Stoploss 1.170
BUY EURUSD 1.163-1.161 Stoploss 1.158
SELL EURUSD 1.188-1.190 Stoploss 1.1930
EUR/JPY Potential Bullish ContinuationEUR/JPY Potential Bullish Continuation 📈🔍
📊 Technical Overview:
The EUR/JPY chart presents a bullish channel structure, indicating an overall upward trend. Price action respected the channel boundaries with multiple confirmations before the latest bearish correction.
🔹 Structure Highlights:
🔵 Ascending Channel: Price moved steadily within an upward-sloping channel.
🟠 Support Rebound: A strong bullish candle formed on June 20th after touching the lower boundary — a clear support confirmation.
🔴 Recent Rejection: On July 1st, price tested the upper channel resistance and faced rejection, forming a bearish engulfing candle.
🟫 Support Zone Marked: Around the 167.800 level, this zone has been tested multiple times, indicating a possible demand area.
🔁 Current Scenario:
The pair has broken down from the internal trendline (light brown line) and is heading toward the support zone. A bullish bounce from this area may lead to a rally toward the Target Point at ~172.000 🎯.
📌 Key Levels:
Support Zone: 167.600 – 168.000
Resistance Zone: 170.500 – 172.000
Current Price: 168.994
📈 Outlook:
If support holds and bullish momentum returns, there's potential for a move toward the target area at the top of the channel. However, a break below the support zone could invalidate the bullish scenario and suggest a deeper correction.
🧠 Conclusion:
Wait for bullish confirmation near support before considering long positions. A clean break and retest of the support zone could signal a continuation of the upward trend.

EUR/USD Weekly – Two Long Setups Hello guys!
It is my perspective on eurusd!
Before we even reach the major resistance zone around 1.2050–1.2100, I’ve highlighted two long-term opportunities that may unfold as the price continues to climb.
✔ First Long Position:
It looks like a more conservative entry. The price is already above it. You can set a pending position!
It was likely aiming to catch the momentum as the price broke above the previous structure.
TP is near the descending trendline, around 1.2050–1.2100. a smart place to exit before major resistance hits.
✔ Second Long Position:
Positioned slightly lower. probably in case of a pullback or retest into the broken zone.
This one offers better risk-reward, but requires patience and a cleaner retracement.
Both longs are short-to mid-term swing ideas, aiming to ride the bullish leg into the bigger trendline rejection zone, where I’d personally be more cautious or even look for reversal setups.

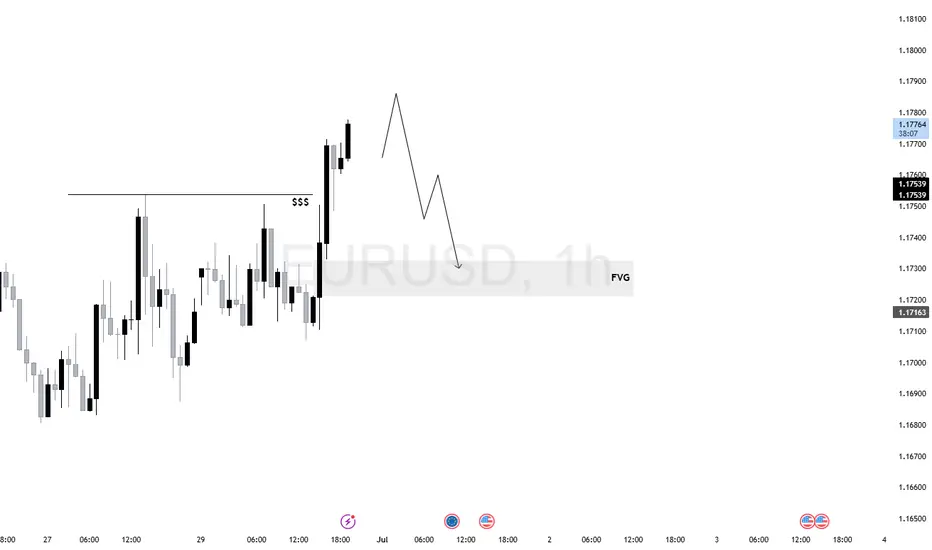
$EU (EURUSD) 1H AnalysisEURUSD swept short-term sell-side liquidity and printed a strong displacement above the relative equal highs.
Price is now in premium territory and likely hunting liquidity before rebalancing.
Bias remains bearish if price fails to form higher-timeframe continuation. Ideal setup would be a short from signs of rejection toward 1.17163 FVG zone.
EURUSD BUY SETUP 1:5HELLO HOW ARE YOU ?
What i think about market ?
I Think the market will take liquidity
and will reach imbalance , then touch the supply area
and last will go up boooom
