EURNZD Potential Breakout or Reversal? | Technical Analysis EURNZD Potential Breakout or Reversal? | Technical Analysis 🚀🔄
The chart illustrates a key technical setup on the EURNZD pair with both bullish and bearish possibilities depending on price action near critical zones.
🔍 Technical Highlights:
Bearish Harmonic Pattern Completed 📉
A harmonic structure has formed and completed near the resistance zone (~1.9500), triggering a bearish move towards the target at 1.90688.
Major Resistance Zone 🔺
Marked between 1.9450 - 1.9500, where previous price action showed strong rejection (highlighted by the red arrow). This remains the key zone to break for further upside.
Support & Breakout Zone 🟦
The price bounced off the support zone around 1.9068 - 1.9100, aligning with trendline support and a previous structure level. This zone also aligns with the target of the bearish harmonic move.
Trendline Retest & Bullish Continuation Possibility 🔼
The price broke above the bearish leg and is now consolidating. If price closes above 1.9350-1.9400, a potential breakout toward the 1.9500 resistance zone is expected (blue arrow).
🔄 Scenarios to Watch:
✅ Bullish Case:
Break and hold above 1.9400
Target: 1.9500 Resistance Zone
Confirmation: Strong bullish candles with volume above current range
❌ Bearish Case:
Rejection at current level (near 1.9350-1.9400)
Target: 1.9068, the harmonic completion target and support zone
Confirmation: Bearish engulfing/rejection candle with trendline break
📌 Conclusion:
EURNZD is at a crucial decision point. Watch closely for a breakout above or rejection from the current price range to determine whether the pair will retest highs or complete the bearish target move.
Eurusdbuy

EUR/USD Rally Continues – 1.18000 in SightHi Everyone,
As outlined in our analysis last week, we anticipated a continued move higher toward the 1.16564 and 1.18325 levels, provided price held above 1.14483.
Price respected this level, and EUR/USD extended its rally, reaching our first key target at 1.16564 and pushing above 1.17400 — marking the highest level since February 2022.
A successful bounce from above 1.16680 or slightly lower at 1.15998 would offer near-term support for a potential retest of the 1.17400 zone. A confirmed break above this resistance could pave the way for a move toward 1.18000, where we anticipate encountering dynamic resistance.
We will provide further updates on the projected path for EUR/USD should price reach this level.
The longer-term outlook remains bullish, with expectations for the rally to extend toward the 1.2000 level, provided the price holds above the key support at 1.10649.
We will continue to update you throughout the week with how we’re managing our active ideas and positions. Thanks again for all the likes/boosts, comments and follows — we appreciate the support!
All the best for a good end to the week. Trade safe.
BluetonaFX

Euro's Surge on USD Weakness – Is 1.20 the Next Stop?EURUSD: Euro's Surge on USD Weakness – Is 1.20 the Next Stop?
Hello TradingView Community!
The EURUSD pair is currently commanding significant attention with its strong upward momentum.
🌍 Fundamental Highlights: Euro's Tailwinds & USD's Headwinds
The Euro has demonstrated notable strength, recently breaching the 1.17 mark to hit its highest level in over 3.5 years. According to ING, if this momentum holds, the next target could be 1.20, contingent on continued USD weakness.
The US Dollar faces considerable pressure following news that President Trump intends to name a successor to Fed Chair Powell soon, sparking concerns about the Fed's independence. Such speculation often leads to expectations of a more 'dovish' monetary policy, weakening the USD.
Adding to the Euro's support are the NATO agreement to increase defense spending targets to 5% and President Trump's seemingly "less aggressive" stance towards the EU.
In summary: Should USD depreciation persist, not only the Euro but other asset classes might also attract capital inflows, particularly given the ongoing uncertainties surrounding inflation risks and monetary policy.
📊 EURUSD Technical Outlook (H4/M30 Chart):
Our technical analysis of the EURUSD chart (image_b73298.png) confirms a clear and robust uptrend, characterized by successive higher highs and higher lows. The EMAs are in a bullish alignment, reinforcing this upward trajectory.
Upside Targets (Potential BUY Zones):
1.17807: The initial potential target if the bullish momentum continues.
1.18458: A higher target representing the next potential resistance zone.
Key Support Levels (Potential BUY Zones for pullbacks):
1.16070: A strong support level where demand could emerge after a correction.
An implied intermediate support around 1.166xx (visually suggested by price action between current levels and 1.16070) could also offer buying opportunities after minor pullbacks.
🎯 EURUSD Trading Plan:
BUY Zone 1 (Intermediate Pullback):
Entry: 1.16600 - 1.16700
SL: 1.16450
TP: 1.16800 - 1.17000 - 1.17200 - 1.17500 - 1.17807 - 1.18000 - 1.18300 - 1.18458
BUY Zone 2 (Strong Support):
Entry: 1.16070
SL: 1.15900
TP: 1.16200 - 1.16400 - 1.16600 - 1.16800 - 1.17000 - 1.17300 - 1.17600 - 1.17807 - 1.18458
SELL Zone (Consider only at upside targets with clear reversal signals):
Entry: 1.18458 (This is an upside target, but also a potential resistance for selling if strong reversal signals appear).
SL: 1.18600
TP: 1.18300 - 1.18000 - 1.17807 - 1.17500 - 1.17200 - 1.17000 - 1.16800
⚠️ Key Factors to Monitor:
Fed Leadership News: Any official announcements regarding the Fed Chair succession will trigger significant USD volatility.
Eurozone Economic Data: Upcoming inflation, GDP, and employment reports.
ECB Statements: The European Central Bank's stance on monetary policy.
Geopolitical Developments: Major tensions or agreements can influence market sentiment.
Trade smart and always manage your risk effectively! Wishing everyone a profitable trading day!

EUR/USD Bullish Continuation Analysis EUR/USD Bullish Continuation Analysis 🚀💶
📊 Chart Summary:
The EUR/USD pair is demonstrating a strong bullish structure with consistent higher highs and higher lows. Recent price action shows a breakout above the 1.16386 resistance level, now acting as support 🛡️. The market is currently retracing and might retest this new support zone before continuing its upward move toward the target.
🔍 Key Observations:
🔸 Bullish Structure:
Multiple bullish impulses have formed a clean staircase pattern (🔼⬆️), indicating sustained buying momentum.
🔸 Support Zone 🟦 (1.13200 - 1.14000):
This zone has been tested multiple times, confirming its strength and the base of this bullish rally.
🔸 Breakout & Retest 🟠:
Price broke above the 1.16386 resistance level, pulled back slightly (highlighted by the orange circle), and now looks ready for a potential continuation to the upside.
🔸 Target 🎯: 1.18010
A clear target has been set based on measured move or resistance projection. If the price respects the current structure, we may see a continuation toward this level.
✅ Trade Outlook:
Bias: Bullish 📈
Entry Zone: Around 1.16386 (upon bullish confirmation)
Target 🎯: 1.18010
Invalidation ❌: Break below 1.1600 with bearish momentum
🧠 Technical Tip:
Always wait for confirmation on the retest before entering. Wick rejections or bullish engulfing candles at the support zone can provide additional entry confidence. 🔍✅

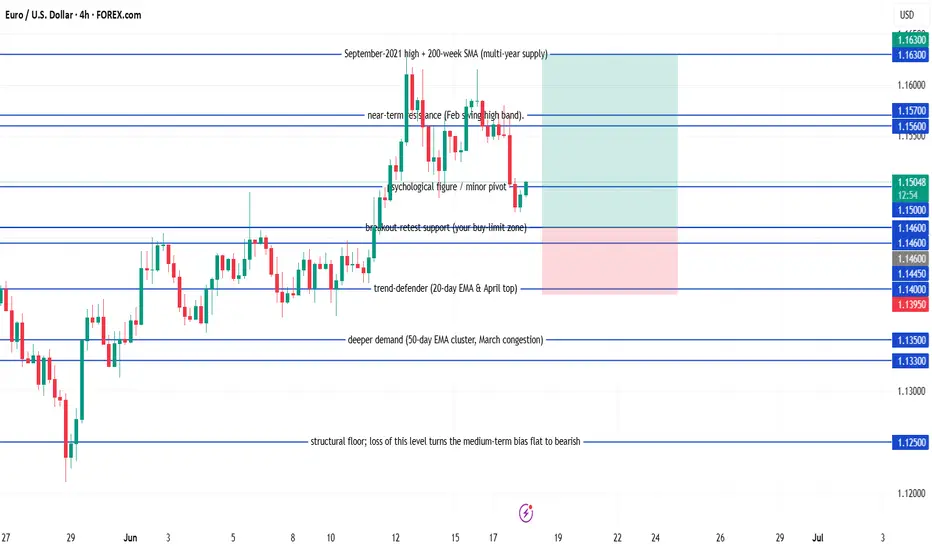
EUR/USD Buy EUR/USD pull-back long
Buy-limit at 1.1460
Stop-loss at 1.1395
Take-profit 1 at 1.1560 – when this first target is reached, move the stop to breakeven
Take-profit 2 at 1.1630
Condition: keep the order active only while the daily candle continues to close at or above 1.1445.
Expiry: if the order hasn’t been filled after five full trading days, cancel it and reassess.
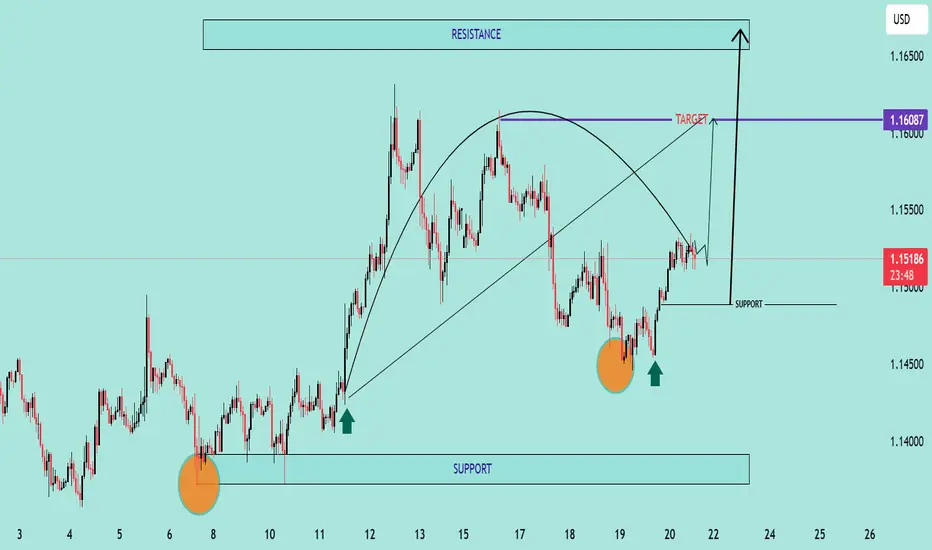
EUR/USD Bullish Reversal Breakout Pattern Technical Analysis Summary:
The chart illustrates a strong bullish reversal pattern forming on the EUR/USD pair:
🔹 Double Bottom Formation (🔶🔶):
Two clear bottom zones are marked with orange circles near the 1.14400–1.14500 area, indicating strong buying interest and support.
The second bottom confirms the double bottom pattern, often a precursor to an upward trend.
🔹 Support Zone (📉):
Firm support around 1.14450, as highlighted on the chart.
Price has respected this zone twice, bouncing back with bullish momentum each time.
🔹 Neckline Breakout (🔼):
Price is approaching the neckline zone at 1.16087, which acts as the bullish target.
A break and close above this neckline will confirm the reversal and open the way toward the resistance zone around 1.16500.
🔹 Projected Move (🎯):
If the neckline breaks, price is expected to surge towards 1.16500, aligning with the historical resistance.
This move completes the measured target projection from the double bottom structure.
🔹 Bullish Structure:
Higher lows and strong bullish candles are reinforcing the uptrend momentum.
Curved trajectory shows accumulation followed by a breakout phase.
📌 Key Levels to Watch:
Support: 1.14450 – 1.14500
Neckline/Target: 1.16087
Resistance: 1.16500
🛑 Invalidation:
A strong breakdown below support (1.14450) would invalidate this bullish setup.
EUR/USD 2-Hour Chart Analysis2-hour performance of the Euro/U.S. Dollar (EUR/USD) currency pair, showing a recent decline with a change of -0.00134 (-0.12%) to a current value of 1.14676. The chart includes key levels such as a support zone around 1.14012-1.14457 and a resistance zone near 1.15000-1.15509. A breakout above the resistance could indicate a potential upward trend, as suggested by the highlighted area.

Core Impact Logic of the Middle East Situation on EURUSD(I) Energy Transmission Chain: Oil Price Fluctuations → Eurozone Inflation and Economy
The escalation of the Middle East situation (the Iran - Israel conflict, risks in the Strait of Hormuz) directly impacts the global energy supply chain:
If the conflict expands to block the Strait of Hormuz (transports ~20% of global crude oil 🛢️), Brent crude has already soared from recent lows—spiking over 5% on June 17 amid tensions ⛽️. This pushes up imported inflation in the Eurozone.
As a net energy - importing region 🌍, prolonged high oil prices will squeeze corporate profits, suppress consumption, and drag Eurozone economic recovery (German/French manufacturing is acutely energy - cost - sensitive 🏭). This weakens the euro’s fundamental support.
(II) Geopolitical Safe - Haven Sentiment: The "Safe - Haven Balance" Between USD & EUR
Amid Middle East tensions, the US dollar’s traditional safe - haven status competes with Eurozone havens like German bonds 📈:
If the US (e.g., the Trump administration) intervenes militarily 💥, market fears of "America mired in war" rise. USD safe - haven demand may temporarily weaken ⬇️, and the euro benefits as funds shift 🔄
⚡️⚡️⚡️ EURUSD ⚡️⚡️⚡️
🚀 Buy@ 1.14500 - 1.15000
🚀 TP 1.15500 - 1.15600
Accurate signals are updated every day 📈 If you encounter any problems during trading, these signals can serve as your reliable guide 🧭 Feel free to refer to them! I sincerely hope they'll be of great help to you 🌟 👇

EURUSD LONGPrice swept below support around 1.1473, grabbing liquidity and quickly bouncing back — this is a classic Wyckoff spring setup.
📌 Key Levels
Entry: Around 1.1500
Stop Loss: Below 1.1424 (spring low)
Target 1: 1.1567 (range high)
Target 2: 1.1614 (measured move)
🔍 Why I like this setup:
Fake breakdown (spring) and quick recovery
Buyers showed up right after the sweep
Expecting price to return to the top of the range and possibly break higher . This a trade we hold
💡 A spring is where smart money steps in after trapping sellers — I'm following them.
“I always say that you could publish my rules in the newspaper and no one would follow them. The key is consistency and discipline.”

EUR/USD Set to Soar or Crash? Forecast for next weekEverything is simple, if price will drop i will be looking for longs in daily FVG
if price goes up till PWH i will expect move towards daily FVG
If you like this type of content follow and like
I am trying to make my analysis short and simple)

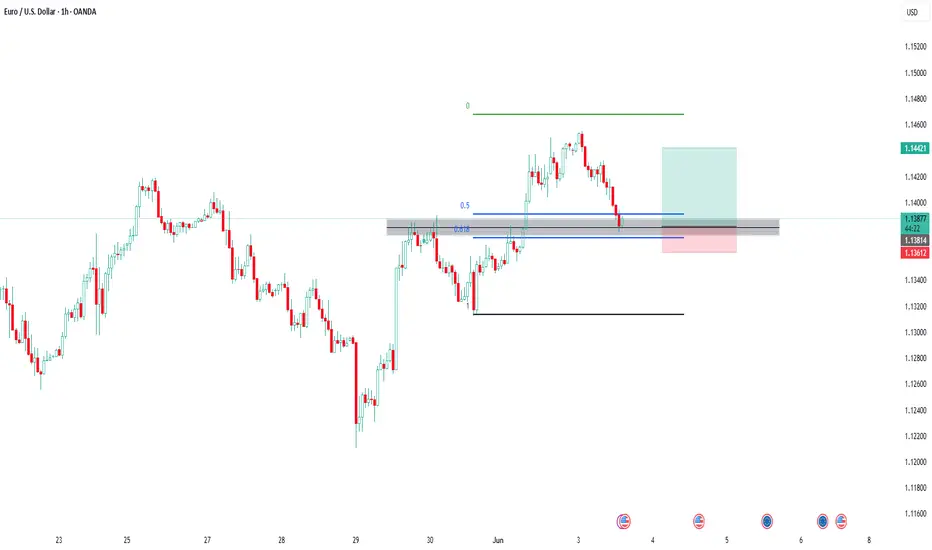
EUR/USD 1-Hour Chart Analysis1-hour candlestick chart for the Euro/US Dollar (EUR/USD) currency pair, sourced from OANDA. The chart highlights a recent price movement with a current value of 1.15510, reflecting a 0.29% decrease (-0.00340). Key price levels are marked, including resistance at 1.16142 and support at 1.14418, with shaded areas indicating potential trading zones. The chart includes a bullish logo and branding from "ALEEGOLDTRADER," suggesting a trading analysis perspective.

Opportunity to buy EURUSDI see an opportunity to buy the EUR/USD pair from the support shown in the image and the target will be 1.16316


Today's EUR/USD Trend Analysis and Trading RecommendationsThe EUR/USD is trading at the upper end of its recent range, having hit an intraday high of around 1.1440 and remaining near that level. The US Dollar strengthened in the early session due to optimism about the easing of Sino-US trade tensions, but later declined as European stocks fluctuated. Technically, the daily chart shows bulls remain in control, with the 20-day SMA rising gently at 1.1330. In the short term, the pair is range-bound around the 20-day SMA, yet to confirm a bullish breakout, while the 100-day and 200-day SMAs support the overall upward trend.
EUR/USD
buy@1.14200-1.14300
tp:1.14600-1.14900

$EU (EURUSD) 1H AnalysisBias: Bearish after liquidity grab at 1.14392
Setup: Wait for the sweep ➤ BOS ➤ Enter short
Target: 1.13600
Price is forming a range-bound consolidation, but the internal structure shows liquidity building below and above.
The market seems poised to run the 1.14392 high, grabbing buy stops above the short-term high.
After that sweep,i see a rejection and shift in order flow, setting up a bearish leg.
Key POIs :
Sweep Zone: 1.14392 (Buy-side liquidity)
Sell Target: 1.13600 zone – a clear sell-side liquidity draw
The red line marks an untapped liquidity pool, aligning with a previous support level.
Trade Idea (Short Bias) :
Let price sweep the 1.14392 high, form a bearish shift (change of character).
Ideal entry after confirmation of rejection.
Target: 1.13600
Invalidation: Clean break and close above 1.14500

Mr. Wave Says... It’s Time for the Last Push!”[ b] EUR/USD is forming a clean Elliott Wave structure — and guess what?
We’re at Wave 4 consolidation, and Wave 5 is about to explode upward!
🔍 Here's what we're seeing:
✅ Wave 1 to 3 already confirmed with solid impulse
✅ Wave 4 found support near previous breakout zone
🎯 Target: Upper supply zone where Wave 5 is likely to terminate
🔔 This isn’t the time to sleep on the charts. Mr. Wave is literally pointing to the target zone — and we’re not ignoring it. 😉
---
🧠 Pro tip:
Use tight risk management, ride the final push of the motive wave, and watch for reversal signals in the supply zone.
---
📌 #GreenFireForex #ElliottWave #Wave5 #ForexTrading #TechnicalAnalysis #EURUSDSetup #ForexReel #WaveTheory #SupplyZone #ForexSignal #SmartTrading

EUR USD Trade Setup 1 hour timeframe EUR USD Trade Setup 1 hour timeframe
EUR USD has formed a Bullish Break and Retest pattern on the 1 hour timeframe and the price is currently at the retest level.
EURUSD Update – Exceptional Long Entry As mentioned in our previous post, we were waiting for price to react from one of the key demand zones:
🔹 1.12250 – 1.12500
🔹 1.1190 – 1.12060
✅ We entered a long position on the 3-minute timeframe after getting a personal confirmation trigger.
The result? An exceptional entry with a minimum of 100 pips profit so far.
📍 Now it's time to secure profits and wait for the next structure to form.
We’ve been patiently waiting all week for price to hit this area – and it played out perfectly.
Great execution! ✅
Keep in touch!
EURUSD CRACK!I first turned bullish on the EUR back in November 2024 after the disastrous election results.
I have always felt the 105 area was a good area to go long, fundamentally going back all the way to 2017. Here is an example.
After 17 years of data, we can all agree that the 105 area was a great value to get long the EUR. Now we see a major CRACK! in the chart with the fundamentals to back it up.
Again, I remind you I am a MACRO Trader. So my trades hold for a long, long time unless the facts change. I don't do 3 pips and i am out crap!
Let this be a WARNING! To the dollar bulls!
Click Boost, follow, subscribe! Let's get to 5,000 followers so I can help them navigate these crazy markets, too. ))

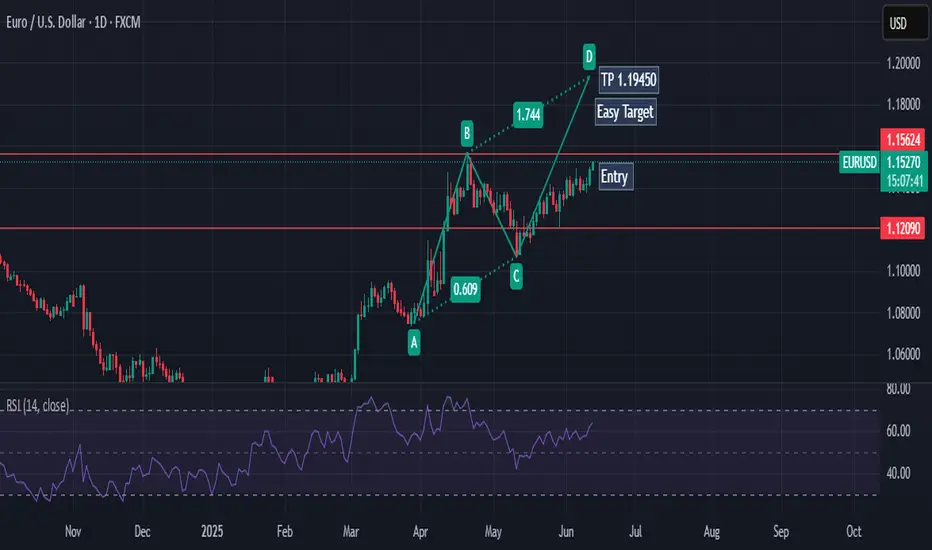
Eurusd is still bullish This EUR/USD daily chart from FXCM suggests a bullish breakout following a well-formed rounded bottom pattern.
Key Observations:
Rounded Bottom Formation: This pattern, marked with multiple lows (highlighted in orange circles), signals a gradual trend reversal from a downtrend to an uptrend.
Breakout Confirmation: Price has broken above the rounded resistance, indicating strong bullish momentum.
Projected Price Movement: The hand-drawn path suggests further upside, with possible retests before continuing higher.
Volume Profile: Increased activity around the 1.0900 level suggests strong support, with potential resistance near 1.1200 - 1.1400.
Conclusion:
This setup indicates a bullish continuation, but confirmation through sustained volume and price action above resistance is crucial.

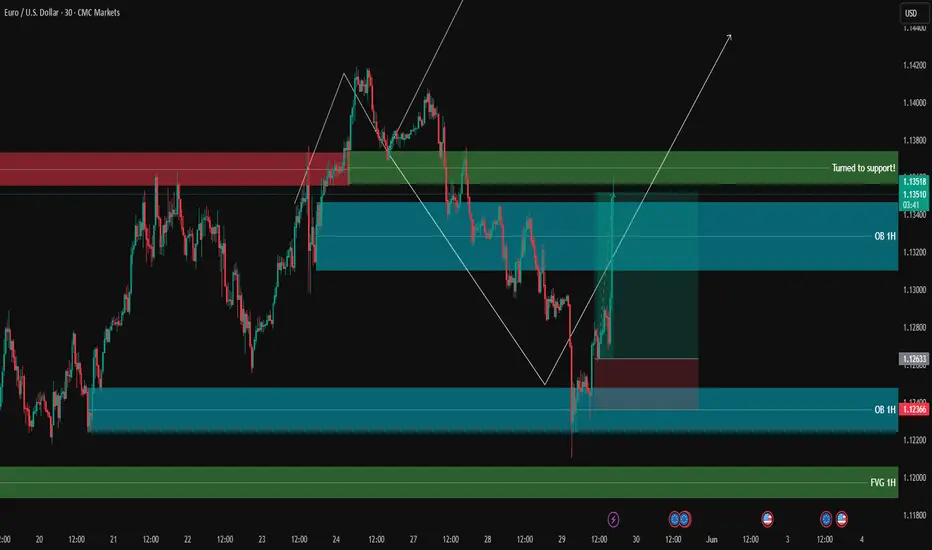
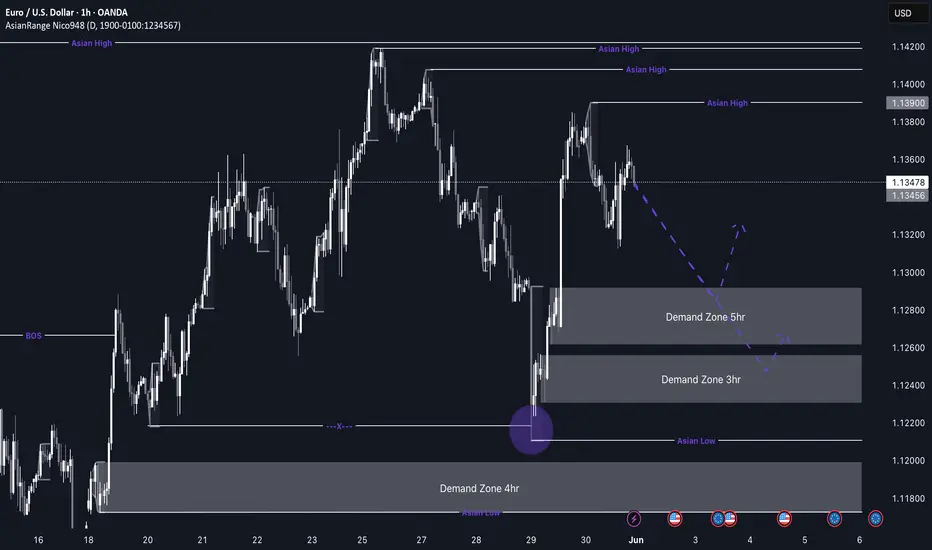
EUR/USD Potential longs to the upsideEU Weekly Outlook — Bullish Pro-Trend Setup in Focus
This week, my EU analysis is centered around the pro-trend movement to the upside. Price has recently broken structure and in doing so, has left behind clean demand zones on the 5H and 3H timeframes. I’ll be watching closely to see when price decides to mitigate these levels for a potential long setup.
Since price is still a bit far from these zones, short-term sells may be possible, but with no strong nearby supply, I’ll be staying patient and letting price action guide me. The key is to avoid marrying any one bias and remain adaptable.
Confluences for EU Buys:
- Strong bullish structure on higher timeframes
- Clean and unmitigated 5H and 3H demand zones
- Plenty of liquidity above, including Asia highs
- This is a pro-trend trade, aligning with market flow
- DXY analysis supports a bullish EU outlook
P.S. If price shifts and breaks structure to the downside, then we could consider short-term sell setups — but for now, I’m focused on the long opportunity forming from demand.
Have a great trading week and stay sharp! 🧠💹
EURUSD PLAN – Is the Rebound Just a Pause Before the Drop? EURUSD PLAN – Is the Rebound Just a Pause Before the Drop? | All Eyes on PCE
📊 MACRO OUTLOOK:
Following the latest FOMC meeting, the Fed kept interest rates unchanged, as expected, but maintained a hawkish tone. Chair Powell reiterated that inflation remains too sticky to consider rate cuts in the near term.
Markets now await this week’s US PCE data — the Fed’s preferred inflation gauge — which could provide the next major catalyst for USD strength or weakness.
On the Euro side, weak consumer confidence and tepid growth have strengthened expectations for an ECB rate cut in June. This divergence in monetary policy is weighing on the Euro, as the Dollar finds new demand amid global risk recalibration.
📉 TECHNICAL OUTLOOK (H1):
EURUSD has broken down from recent highs near 1.1412 and is now forming a bearish retracement pattern.
Price has broken below the 89-EMA and 200-EMA, signaling bearish structure.
Current price action suggests a temporary bounce from the 1.1260–1.1280 support zone (Fibo 38.2%–50%), but the broader trend remains bearish.
Fibonacci retracement from recent swing lows highlights 1.1338 and 1.1372 as key resistance levels to watch.
🔑 KEY TECHNICAL ZONES:
Resistance Zones:
• 1.1313 – Minor intraday level (Fibo 0.5)
• 1.1338 – EMA confluence + former structure
• 1.1372 – Major rejection zone (previous distribution top)
Support Zones:
• 1.1280 – 1.1260 – Current support bounce area
• 1.1220 – Key liquidity sweep zone
🧭 TRADE STRATEGY:
Scenario A – Sell the Pullback:
• Wait for a rebound into the 1.1313 – 1.1338 zone
• Enter SELL if bearish rejection forms
• SL: 1.1376
• TP: 1.1280 → 1.1260 → 1.1220
Scenario B – Invalid Breakout:
• If price breaks above 1.1372 with momentum, this plan is invalidated — wait for a confirmed breakout retest.
Scenario C – Reactive Buy Scalp:
• If price shows strong rejection from 1.1260 again, scalpers may consider a temporary BUY back toward 1.1300–1.1310
• This is high-risk and counter-trend.
⚠️ STRATEGIC NOTES:
EURUSD remains in a bearish bias until major resistance levels are broken. With PCE data approaching, volatility is likely. Trade setups should be based on confirmation signals and managed tightly as macro data can shift momentum rapidly.
