EUR/USD Set to Soar or Crash? Forecast for next weekEverything is simple, if price will drop i will be looking for longs in daily FVG
if price goes up till PWH i will expect move towards daily FVG
If you like this type of content follow and like
I am trying to make my analysis short and simple)
Eurusdforecast

EURUSD, GBPUSD and AUDUSD Analysis todayHello traders, this is a complete multiple timeframe analysis of this pair. We see could find significant trading opportunities as per analysis upon price action confirmation we may take this trade. Smash the like button if you find value in this analysis and drop a comment if you have any questions or let me know which pair to cover in my next analysis.

Important Week for EURUSDOn Friday, EURUSD reached a support level and bounced off it.
This week, the market is waiting for the Fed’s decision on interest rates.
The trend remains bullish for now, and the upcoming news will likely determine the next major move.
Today and tomorrow, we might see some sideways movement ahead of the key announcement.
Don't rush into new trades and avoid using large position sizes!

Still keeping a close eye on a potential USD pop...Although the EUR/USD and GBP/USD popped higher late last week, I'm still keeping a close eye to stay short on the EUR/USD considering the bearish rising broadening pattern coupled with a yearly pivot point inter-median level and negative divergence on the MACD. This is all based on the daily chart.
Many factors are in play right now with what's going on between Israel and Iran along with FOMC this week and Tariffs still in play.
On a purely technical analysis point of view, I potentially expect a bullish retracement in the USD while remaining long term bearish across the board.
we'll see how this one develops.
Good Luck & Trade Safe.

EURUSD Analysis todayHello traders, this is a complete multiple timeframe analysis of this pair. We see could find significant trading opportunities as per analysis upon price action confirmation we may take this trade. Smash the like button if you find value in this analysis and drop a comment if you have any questions or let me know which pair to cover in my next analysis.

EURUSD - Expecting Bearish Continuation In The Short TermM15 - Clean bearish trend with the price creating series of lower highs, lower lows.
No opposite signs.
Expecting further continuation lower until the two Fibonacci resistance zones hold.
If you enjoy this idea, don’t forget to LIKE 👍, FOLLOW ✅, SHARE 🙌, and COMMENT ✍! Drop your thoughts and charts below to keep the discussion going. Your support helps keep this content free and reach more people! 🚀
--------------------------------------------------------------------------------------------------------------------
Disclosure: I am part of Trade Nation's Influencer program and receive a monthly fee for using their TradingView charts in my analysis.

EURUSD SELL/SHORTBy utilizing levels, historical patterns, , we can formulate a hypothesis that the market might follow a similar trajectory if bearish sentiment prevails.

EURUSD - Expecting Bearish Continuation In The Short TermH1 - Clean bearish trend with the price creating series of lower highs, lower lows.
Lower lows on the moving averages of the MACD indicator.
Expecting further continuation lower until the two Fibonacci resistance zones hold.
If you enjoy this idea, don’t forget to LIKE 👍, FOLLOW ✅, SHARE 🙌, and COMMENT ✍! Drop your thoughts and charts below to keep the discussion going. Your support helps keep this content free and reach more people! 🚀
--------------------------------------------------------------------------------------------------------------------
Disclosure: I am part of Trade Nation's Influencer program and receive a monthly fee for using their TradingView charts in my analysis.

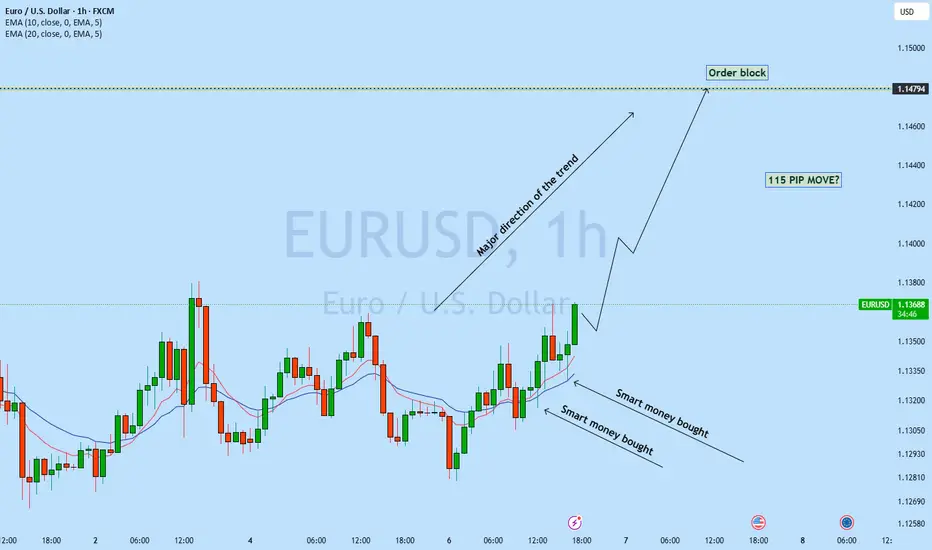
EURUSD is set to move up?EURUSD 1h back to back 2 candle has got rejected from the support level with long wick which is smart money bullish order flow showing potential move back to the resistance line. As Daily trend is bullish we may see EURUSD continue to bounce back to the resistance with newly develop uptrend.
A buy trade is high probable
EURUSD SELL/SHORTBy utilizing levels, historical patterns, , we can formulate a hypothesis that the market might follow a similar trajectory if bearish sentiment prevails.

EURUSD Analysis todayHello traders, this is a complete multiple timeframe analysis of this pair. We see could find significant trading opportunities as per analysis upon price action confirmation we may take this trade. Smash the like button if you find value in this analysis and drop a comment if you have any questions or let me know which pair to cover in my next analysis.

EURUSD potential drop support?EURUSD has broken out of the daily support proceeding to daily 20EMA to swing high to retest as support. As with a head and shoulder on 4h price breaks out of support ( Daily ) with multiple liquidity grab it is a high probability for the price to potentially drop to support.
A sell trade is high probable

EURUS possible bearish reversal correction for 1.1100 & 1.1000#eurusd weekly key reversal bar, made a new high closed towards the low which is early indication for bearish reversal. better to wait for 61.8, 70.0 and 79.0 fib level for correction to short to manage drawdown. stop loss above key reversal bar high. initial target might be 1.1100 and next one 1.1000 if breaks below the 1.1100. use low risk in reversal trade.

EURUSD Short Term Buy Idea Update!!!Hi Traders, on April 15th I shared this idea "EURUSD Short Term Buy Idea"
Expected retraces and further continuation higher until the strong support zone holds. You can read the full post using the link above.
Price moved as per the plan!!!
Retraces happened as expected and then the price moved higher further.
If you enjoy this idea, don’t forget to LIKE 👍, FOLLOW ✅, SHARE 🙌, and COMMENT ✍! Drop your thoughts and charts below to keep the discussion going. Your support helps keep this content free and reach more people! 🚀
--------------------------------------------------------------------------------------------------------------------
Disclosure: I am part of Trade Nation's Influencer program and receive a monthly fee for using their TradingView charts in my analysis.

Market Analysis: EUR/USD Dips From HighsMarket Analysis: EUR/USD Dips From Highs
EUR/USD declined from the 1.1570 resistance and traded below 1.1470.
Important Takeaways for EUR/USD Analysis Today
- The Euro started a fresh decline after a strong surge above the 1.1500 zone.
- There was a break below a key bullish trend line with support at 1.1440 on the hourly chart of EUR/USD at FXOpen.
EUR/USD Technical Analysis
On the hourly chart of EUR/USD at FXOpen, the pair rallied above the 1.1500 resistance zone before the bears appeared. The Euro started a fresh decline and traded below the 1.1500 support zone against the US Dollar.
There was a break below a key bullish trend line with support at 1.1440. The pair declined below 1.1410 and tested the 1.1310 zone. A low was formed near 1.1308 and the pair started a consolidation phase. There was a minor recovery wave above the 1.1370 level.
The pair climbed above the 23.6% Fib retracement level of the downward move from the 1.1573 swing high to the 1.1308 low. EUR/USD is now trading below 1.1440 and the 50-hour simple moving average.
On the upside, the pair is now facing resistance near the 1.1410 level. The next key resistance is at 1.1440 and the 50% Fib retracement level of the downward move from the 1.1573 swing high to the 1.1308 low.
The main resistance is near the 1.1470 level. A clear move above the 1.1470 level could send the pair toward the 1.1570 resistance. An upside break above 1.1570 could set the pace for another increase. In the stated case, the pair might rise toward 1.1650.
If not, the pair might resume its decline. The first major support on the EUR/USD chart is near 1.1335. The next key support is at 1.1310. If there is a downside break below 1.1310, the pair could drop toward 1.1265. The next support is near 1.1220, below which the pair could start a major decline.
This article represents the opinion of the Companies operating under the FXOpen brand only. It is not to be construed as an offer, solicitation, or recommendation with respect to products and services provided by the Companies operating under the FXOpen brand, nor is it to be considered financial advice.

EURUSD - Expecting Short Term RetracesH4 - Strong bullish move ended with a bearish divergence.
While measuring this strong bullish move using the Fibonacci retracement tool we have two key support zones that has formed (marked in green).
So based on this I expect short term bearish moves now towards the Fibonacci support zones.
If you enjoy this idea, don’t forget to LIKE 👍, FOLLOW ✅, SHARE 🙌, and COMMENT ✍! Drop your thoughts and charts below to keep the discussion going. Your support helps keep this content free and reach more people! 🚀
--------------------------------------------------------------------------------------------------------------------
Disclosure: I am part of Trade Nation's Influencer program and receive a monthly fee for using their TradingView charts in my analysis.

EURUSD Short Term Buy Idea Update!!!Hi Traders, on April 15th I shared this idea "EURUSD Short Term Buy Idea"
Expected retraces and further continuation higher until the strong support zone holds. You can read the full post using the link above.
Price is moving as per the plan!!!
Retraces happening as expected, my bullish view still remains the same here.
If you enjoy this idea, don’t forget to LIKE 👍, FOLLOW ✅, SHARE 🙌, and COMMENT ✍! Drop your thoughts and charts below to keep the discussion going. Your support helps keep this content free and reach more people! 🚀
--------------------------------------------------------------------------------------------------------------------
Disclosure: I am part of Trade Nation's Influencer program and receive a monthly fee for using their TradingView charts in my analysis.

EUR/USD Closing the Symmetrical Triangle PatternEURUSD is trading bullishly but has eased after hitting a high of $1.1470. Currently, it trades sideways near $1.1342. Despite the bullish trend, the pair is overbought and may dip below $1.1296 toward $1.1296 support.
If bulls close above $1.1470, a further rally could target $1.1710.
>>> No Deposit Bonus
>>> %100 Deposit Bonus
>>> Forex Analysis Contest
All at F enzo F x Decentralized Forex Broker

GBPUSD and EURUSD Analysis todayHello traders, this is a complete multiple timeframe analysis of this pair. We see could find significant trading opportunities as per analysis upon price action confirmation we may take this trade. Smash the like button if you find value in this analysis and drop a comment if you have any questions or let me know which pair to cover in my next analysis.

EUR/USD Hits Highest Level in Over Three YearsEUR/USD Hits Highest Level in Over Three Years
This morning, the euro surged above the 1.1300 mark against the US dollar for the first time since February 2022.
Throughout this week, the EUR/USD pair has broken through the highs of both 2023 and 2024.
Why Is EUR/USD Rising?
Amid the whirlwind of news surrounding the imposition and suspension of tariffs in US–EU trade, one dominant factor stands out — the sell-off of US bonds.
According to Reuters, long-term US Treasury bonds are being heavily sold this week. The yield on 10-year notes has jumped from 3.9% to around 4.4%, marking the steepest increase in yields since 2001. This may reflect a reaction by foreign holders of US debt to sanctions imposed by the White House, combined with growing uncertainty about the US economy — especially as recession fears gain more media attention.
As a result, the US dollar is showing weakness against a range of currencies, including the Japanese yen, Swiss franc, and the euro.
Technical Analysis of EUR/USD
The chart reveals a clear ascending channel (marked in blue), with the price repeatedly interacting with its upper, lower, and median boundaries — highlighted with markers and arrows.
Current bullish sentiment has pushed the pair towards the upper boundary of this channel. It’s possible this resistance line could halt further gains, potentially leading to a correction — perhaps down to the 1.11 level, which previously acted as a strong resistance point.
This article represents the opinion of the Companies operating under the FXOpen brand only. It is not to be construed as an offer, solicitation, or recommendation with respect to products and services provided by the Companies operating under the FXOpen brand, nor is it to be considered financial advice.

Market Analysis: EUR/USD Resumes IncreaseMarket Analysis: EUR/USD Resumes Increase
EUR/USD started a fresh increase above the 1.0950 resistance.
Important Takeaways for EUR/USD Analysis Today
- The Euro started a decent upward move from the 1.0880 zone against the US Dollar.
- There was a break above a key bearish trend line with resistance at 1.0955 on the hourly chart of EUR/USD at FXOpen.
EUR/USD Technical Analysis
On the hourly chart of EUR/USD at FXOpen, the pair started a fresh increase from the 1.0775 zone. The Euro cleared the 1.0950 resistance to move into a bullish zone against the US Dollar, as mentioned in the last analysis.
The bulls pushed the pair above the 50-hour simple moving average and 1.1000. Finally, the pair tested the 1.1150 resistance. A high was formed near 1.1146 before the pair corrected gains. It dipped below 1.1000 and tested 1.0880.
The pair is again rising from the 1.0880 zone. There was a break above a key bearish trend line with resistance at 1.0955. The pair climbed above the 50% Fib retracement level of the downward move from the 1.1146 swing high to the 1.0880 low.
Immediate resistance on the EUR/USD chart is near the 1.1045 zone and the 61.8% Fib retracement level of the downward move from the 1.1146 swing high to the 1.0880 low.
The first major resistance is near the 1.1080 level. An upside break above the 1.1080 level might send the pair toward the 1.1145 resistance. The next major resistance is near the 1.1165 level. Any more gains might open the doors for a move toward the 1.1200 level.
Immediate support on the downside is near the 1.0955 level. The next major support is the 1.0880 level. A downside break below the 1.0880 support could send the pair toward the 1.0830 level. Any more losses might send the pair into a bearish zone toward 1.0775.
This article represents the opinion of the Companies operating under the FXOpen brand only. It is not to be construed as an offer, solicitation, or recommendation with respect to products and services provided by the Companies operating under the FXOpen brand, nor is it to be considered financial advice.

EURUSD Sell and Buy Trading Plan Update!!!Hi Traders, on March 19th I shared this "EURUSD Sell and Buy Trading Plan"
I expected short term bearish moves towards the Fibonacci support zones and then continuation higher. You can read the full post using the link above.
Price moved as per the plan here!!!
If you enjoy this idea, don’t forget to LIKE 👍, FOLLOW ✅, SHARE 🙌, and COMMENT ✍! Drop your thoughts and charts below to keep the discussion going. Your support helps keep this content free and reach more people! 🚀
-------------------------------------------------------------------------------------------------------------------
Disclosure: I am part of Trade Nation's Influencer program and receive a monthly fee for using their TradingView charts in my analysis.

USD Bear is here: Important Analysis on FX Pairs, Stock MarketIn this video I got over some important outlooks on the EUR/USD, GBP/USD and USD/JPY along with outlook on the stock market.
The U.S. Dollar has been getting absolutely crushed along with the stock market which usually has the opposite effect. Considering we may be into a stagflation scenario, this is not surprising.
Tariffs have spiked volatility and puts the Federal Reserve in a very tight spot of Interest Rate Policy. Interesting times ahead to say the least.
From a pure technical analysis point of view, the USD may be set for much further losses as monthly patterns suggest a big move may be on the horizon. Will be keeping a very close eye on these as we move forward in these stormy waters of the U.S. economy.
As always, Good Luck & Trade Safe.
