EURUSD bulling ideaAlthough there is no single significant event directly affecting the euro-dollar exchange rate on May 8, from a macro perspective, the U.S. dollar index fluctuated on that day, having a certain impact on the euro-dollar exchange rate. The U.S. dollar index once broke the 100 mark. Generally speaking, the strength of the U.S. dollar index has an inverse relationship with the euro-dollar exchange rate. From different time cycles, on the monthly chart, the euro-dollar is supported at the 1.0800 level, and the long-term trend is regarded as bullish. At the weekly level, the price is supported in the 1.0900 area, and the medium-term outlook remains bullish
you are currently struggling with losses, or are unsure which of the numerous trading strategies to follow, at this moment, you can choose to observe the operations within our channel.
Eurusdlong

price bull interest.The annual growth rate of retail sales in the euro - zone in March was 1.5%. On the surface, it still maintained expansion. However, compared with the previous value of 1.9% and the market expectation of 1.6%, there was a slight slow - down trend. In terms of the monthly rate, the data was - 0.1%, which was a significant decline compared with the revised 0.2% in February. Although such performance did not trigger violent market fluctuations, it to some extent reflected the phenomenon of marginally weakened terminal consumption momentum in the region.
It is worth noting that the leaders of the major political parties in Germany failed to pass the parliamentary confirmation process smoothly. The market was once worried that political uncertainty would drag down the trend of the euro, and the exchange rate briefly dropped to 1.1310. However, judging from the market reaction, the euro showed relatively strong resilience and quickly recovered to the level of 1.1380, indicating that the market still holds a cautiously optimistic attitude towards the medium - term prospects.
Currently, the exchange rate is running above the middle band of the Bollinger Bands, and the overall structure remains within the oscillation range of 1.1260 - 1.1440. 1.1440 is a strong short - term resistance level. The failure of several consecutive upward attacks indicates that the selling pressure above is relatively heavy. 1.1260 is a key support level in the near term and is also in the area near the middle band of the Bollinger Bands. If it is broken, it may trigger a technical correction.
you are currently struggling with losses, or are unsure which of the numerous trading strategies to follow, at this moment, you can choose to observe the operations within our channel.

Analysis of the Latest SignalsThe market expects the Federal Reserve to keep interest rates unchanged in May, and there is uncertainty about the future path of rate cuts. In contrast, the European Central Bank's monetary policy is gradually tightening, leading the market to expect that the euro has room for appreciation in the future. This difference in monetary policy expectations has driven the rise in the euro - dollar exchange rate. Technically, it is necessary to pay attention to the resistance level of the euro - dollar exchange rate near 1.16 and the support level near 1.12. If the 1.16 resistance level can be broken through, the euro - dollar exchange rate is likely to continue to rise. Conversely, if it falls back due to resistance, the effectiveness of the 1.12 support level needs to be observed.
you are currently struggling with losses, or are unsure which of the numerous trading strategies to follow, at this moment, you can choose to observe the operations within our channel.

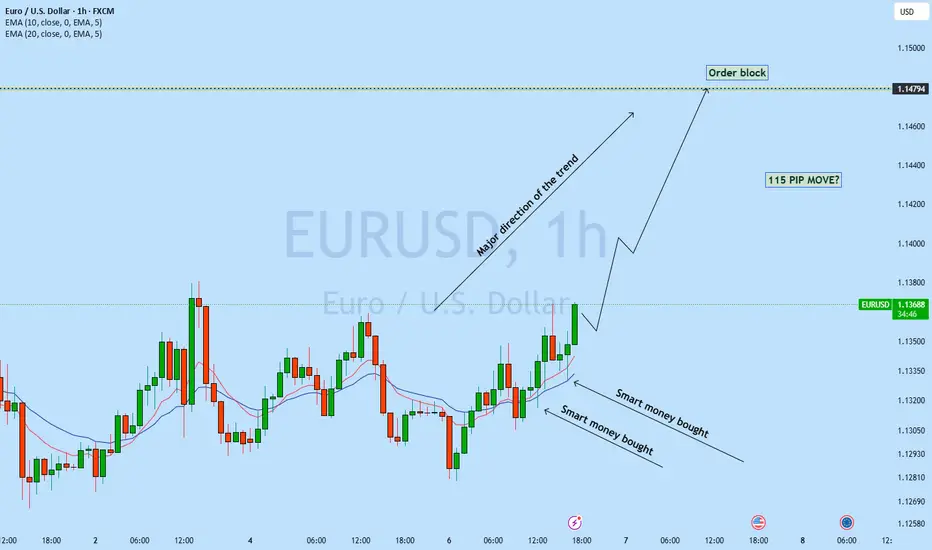
EURUSD is set to move up?EURUSD 1h back to back 2 candle has got rejected from the support level with long wick which is smart money bullish order flow showing potential move back to the resistance line. As Daily trend is bullish we may see EURUSD continue to bounce back to the resistance with newly develop uptrend.
A buy trade is high probable
EURUSD long - does anything more need to be said?The daily and H4 chart say everything that needs to be said.
Just watch patiently, let the market settle down and show us its hand.
Good Luck!!

EURUSD EURUSD presents another buy opportunity, and I've just activated the trade.
I wanted to share it with you as well. This trade has three different Take Profit levels, which are:
1.13455 / 1.13563 / 1.13786
However, I personally plan to close the trade at 1.13455 in order to stick to my game plan.
This will be the last trade of the day for me.
🔍 Criteria:
✔️ Timeframe: 15M
✔️ Risk-to-Reward Ratio: 1:1.50 / 1:2.50 / 1:4.50
✔️ Trade Direction: Buy
✔️ Entry Price: 1.13290
✔️ Take Profit: 1.13455
✔️ Stop Loss: 1.13180
🔔 Disclaimer: This is not financial advice. It's a trade I’m taking based on my own system, shared purely for educational purposes.
📌 If you're also interested in systematic and data-driven trading strategies:
💡 Don’t forget to follow the page and subscribe to stay updated on future analyses.

EURUSDHello everyone!
I'd like to share an ideal **Buy opportunity** on the **EURUSD** pair with you. The trade is currently **active** on my side.
🔍 **Criteria:**
✔️ Timeframe: 15M
✔️ Risk-to-Reward Ratio: 1:1.17
✔️ Trade Direction: Buy
✔️ Entry Price: 1.13204
✔️ Take Profit: 1.13335
✔️ Stop Loss: 1.13092
🔔 **Disclaimer:** This is not financial advice. It's a trade I’m taking based on my own system, shared purely for educational purposes.
📌 If you're also interested in systematic and data-driven trading strategies:
💡 Don’t forget to follow the page and subscribe to stay updated on future analyses.

EURUSD LONG FORECAST Q2 W19 D6 Y25EURUSD LONG FORECAST Q2 W19 D6 Y25
Professional Risk Managers👋
Welcome back to another FRGNT chart update📈
Diving into some Forex setups using predominantly higher time frame order blocks alongside confirmation breaks of structure.
Let’s see what price action is telling us today!
💡Here are some trade confluences📝
✅4 hour order block rejection
✅Daily order block rejection
✅Intraday 15' order blocks
✅Tokyo ranges to be filled
🔑 Remember, to participate in trading comes always with a degree of risk, therefore as professional risk managers it remains vital that we stick to our risk management plan as well as our trading strategies.
📈The rest, we leave to the balance of probabilities.
💡Fail to plan. Plan to fail.
🏆It has always been that simple.
❤️Good luck with your trading journey, I shall see you at the very top.
🎯Trade consistent, FRGNT X

EURUSD directional bias: BuyPrice has closed above a key 4h resistance level. Based on the higher timeframe direction, I am expecting price to continue upwards to the recent high (1.5568).
Please be aware that we have a USD Interest Rate release on Wednesday which could cause a lot of volatility in the market. Keep this in mind if you decide to trade this direction.

EUR/USD "The Fiber" Forex Market Heist Plan🌟Hi! Hola! Ola! Bonjour! Hallo! Marhaba!🌟
Dear Money Makers & Robbers, 🤑💰✈️
Based on 🔥Thief Trading style technical and fundamental analysis🔥, here is our master plan to heist the EUR/USD "The Fiber" Forex market. Please adhere to the strategy I've outlined in the chart, which emphasizes long entry and short entry. 🏆💸Be wealthy and safe trade.💪🏆🎉
Entry 📈 :
"The loot's within reach! Wait for the breakout, then grab your share - whether you're a Bullish thief or a Bearish bandit!"
🏁Buy entry above 1.09400
🏁Sell Entry below 1.08000
📌However, I recommended to place buy stop for bullish side and sell stop for bearish side.
Stop Loss 🛑:
🚩Thief SL placed at 1.08700 (swing Trade Basis) for Bullish Trade
🚩Thief SL placed at 1.08700 (swing Trade Basis) for Bearish Trade
Using the 2H period, the recent / swing low or high level.
SL is based on your risk of the trade, lot size and how many multiple orders you have to take.
Target 🎯:
🏴☠️Bullish Robbers TP 1.10800 (or) Escape Before the Target
🏴☠️Bearish Robbers TP 1.06800 (or) Escape Before the Target
EUR/USD "The Fiber" Forex Market Heist Plan is currently experiencing a neutral trend,., driven by several key factors.
📰🗞️Read the Fundamental analysis, Macro Economics, COT Report, Quantitative Analysis, Intermarket Analysis, Sentimental Outlook, Positioning and future trend..👉👉👉
📌Keep in mind that these factors can change rapidly, and it's essential to stay up-to-date with market developments and adjust your analysis accordingly.
⚠️Trading Alert : News Releases and Position Management 📰 🗞️ 🚫🚏
As a reminder, news releases can have a significant impact on market prices and volatility. To minimize potential losses and protect your running positions,
we recommend the following:
Avoid taking new trades during news releases
Use trailing stop-loss orders to protect your running positions and lock in profits
💖Supporting our robbery plan 💥Hit the Boost Button💥 will enable us to effortlessly make and steal money 💰💵. Boost the strength of our robbery team. Every day in this market make money with ease by using the Thief Trading Style.🏆💪🤝❤️🎉🚀
I'll see you soon with another heist plan, so stay tuned 🤑🐱👤🤗🤩

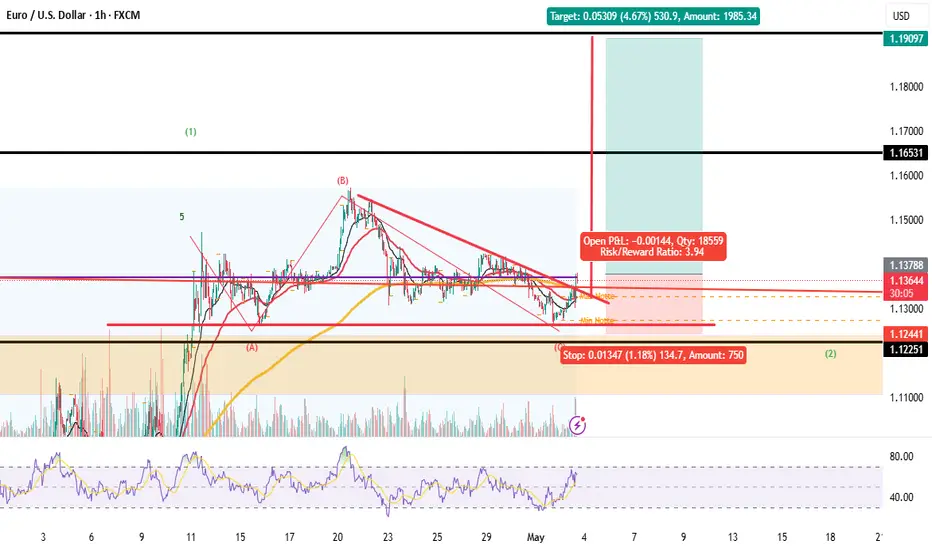
Sharing of the Trading Strategy for Next WeekIn the short term, the trend of the EUR/USD is dominated by the non-farm payrolls data and technical aspects, with a fluctuation range of 1.12-1.16. In the medium to long term, the US dollar faces structural pressures, and the euro is likely to gradually strengthen to 1.30. However, it is necessary to be vigilant against the periodic corrections brought about by policy divergences and geopolitical risks.
Trading Strategy:
buy@1.12800-1.13000
TP:1.15000-1.16000
you are currently struggling with losses, or are unsure which of the numerous trading strategies to follow, at this moment, you can choose to observe the operations within our channel.

EUR/USD - Channel Breakout (02.05.2025) FX:EURUSD The EUR/USD pair on the M30 timeframe presents a Potential Buying Opportunity due to a recent Formation of a Breakout Pattern. This suggests a shift in momentum towards the upside and a higher likelihood of further advances in the coming hours.
Possible Long Trade:
Entry: Consider Entering A Long Position around Trendline Of The Pattern.
Target Levels:
1st Resistance – 1.1387
2nd Resistance – 1.1430
🎁 Please hit the like button and
🎁 Leave a comment to support for My Post !
Your likes and comments are incredibly motivating and will encourage me to share more analysis with you.
TVC:DXY
Best Regards, KABHI_TA_TRADING
Thank you.

EUR/USD Short term longs to a supplyThis week, I’ll be watching to see how much downside momentum remains after price reacted from my 8H supply zone. Just below the current price action, there’s a clean 3H demand zone I’m expecting price to mitigate — which could spark a bullish reaction or a short-term bounce.
My next supply zones are further above on the 2H and 5H timeframes, so I’ll be waiting to see whether we get another break of structure from this move, which could create a new, tradable supply zone. Ideally, I’ll wait for a Wyckoff schematic to develop at one of these key POIs before committing to a trade.
Confluences for EUR/USD Buys (Short-Term):
- Multiple liquidity points to the upside that price may seek to take out.
- A clean, unmitigated 3H demand zone just below the current level.
- The DXY is still showing weakness, aligning with bullish short-term EU moves.
- This could be a counter-trend opportunity before a larger sell-off resumes.
P.S. While my bias leans more towards selling from higher up, I’ll be open to counter-trend longs if the lower POIs hold. Just remember to keep your risk management tight and only take trades with clear confluence and confirmation.

EURUSD - Breakout of Triangle - LongEURUSD - Breakout of Triangle - Long
Long structure if we go above 1.138
We can have a good new long phase, trigger wil be the break of 1.1380 structure with daily candle.
EURUSD - LONG TERM STRATEGYWe have a nice big impulse wave in Long time frame we can note that is a impulsive 3W. So we can have a nice good new long wave in the next months.
This is a strategic analysis for the next move of cross... Is attend an increase o EUR value.

EURUSD Analysis todayHello traders, this is a complete multiple timeframe analysis of this pair. We see could find significant trading opportunities as per analysis upon price action confirmation we may take this trade. Smash the like button if you find value in this analysis and drop a comment if you have any questions or let me know which pair to cover in my next analysis.

EURUSD potential drop support?EURUSD has broken out of the daily support proceeding to daily 20EMA to swing high to retest as support. As with a head and shoulder on 4h price breaks out of support ( Daily ) with multiple liquidity grab it is a high probability for the price to potentially drop to support.
A sell trade is high probable

EURUSD LONG FORECAST Q2 W18 D1 Y25EURUSD LONG FORECAST Q2 W18 D1 Y25
Professional Risk Managers👋
Welcome back to another FRGNT chart update📈
Diving into some Forex setups using predominantly higher time frame order blocks alongside confirmation breaks of structure.
Let’s see what price action is telling us today!
💡Here are some trade confluences📝
✅Weekly order block rejection
✅4 hour bullish order block
✅Intraday 15' order blocks
✅Tokyo ranges to be filled
🔑 Remember, to participate in trading comes always with a degree of risk, therefore as professional risk managers it remains vital that we stick to our risk management plan as well as our trading strategies.
📈The rest, we leave to the balance of probabilities.
💡Fail to plan. Plan to fail.
🏆It has always been that simple.
❤️Good luck with your trading journey, I shall see you at the very top.
🎯Trade consistent, FRGNT X

EURUSD(20250430) Today's AnalysisMarket news:
The European Central Bank expects prices to rise 2.9% over the next 12 months, up from 2.6% in February, according to a monthly survey released on Tuesday. This is the highest level since April 2024. The three-year indicator rose slightly to 2.5%. The ECB's first five-year forecast was 2.1%.
Technical analysis:
Today's buying and selling boundaries:
1.1391
Support and resistance levels:
1.1443
1.1424
1.1411
1.1372
1.1359
1.1340
Trading strategy:
If the price breaks through 1.1391, consider buying, the first target price is 1.1411
If the price breaks through 1.1372, consider selling, the first target price is 1.1359

EURUSD long opportunityMy analysis indicates EU and other xxxUSD pairs could go up with the news release. My bias for today is bullish and have placed a position here.

EUR/USD remains capped below 1.1400, bullish bias prevailsEUR/USD's near-term outlook is neutral. The pair oscillates below a flat 20 SMA, while longer-term (100/200) SMAs maintain upward slopes. Momentum is flat around 100, and the RSI is only slightly higher near 45, suggesting limited upward potential.

EURUSD(20250428) Today's AnalysisMarket news:
The Fed's subsequent policy path considers two scenarios: First, there is no substantial progress in the negotiations between the United States and its trading partners. After 90 days, the US tariffs are still high. Weakened economic demand may prompt the Fed to cut interest rates starting in July, and the annual rate cut may reach 100 basis points; second, the negotiations are fruitful, tariffs are reduced, and the demand shock is small, but inflationary pressure continues. The Fed may postpone easing and only cut interest rates slightly in December. For the market, although the easing comes early in the first scenario, the "recession-style" rate cut may suppress risky assets.
Technical analysis:
Today's buying and selling boundaries:
1.1357
Support and resistance levels:
1.1434
1.1405
1.1386
1.1327
1.1308
1.1280
Trading strategy:
If the price breaks through 1.1357, consider buying, the first target price is 1.1386
If the price breaks through 1.1327, consider selling, the first target price is 1.1308

EURUSD: The range is compressing in the sideway zone. Waiting foThe Relative Strength Index (RSI) indicator on the 4-hour chart stays below 50 and EUR/USD failed to make a 4-hour close above the 20-period and 50-period Simple Moving Averages (SMA), reflecting a lack of buyer interest.
On the downside, 1.1300 (static level) aligns as interim support before 1.1270-1.1260 (Fibonacci 238.2% retracement of the latest uptrend, 100-period SMA) and 1.1180 (Fibonacci 50% retracement).
EUR/USD could face strong resistance at 1.1380, where the Fibonacci 23.6% retracement level converge with the 20-period and 50-period SMAs. In case EUR/USD manages to stabilize above this resistance, 1.1450 (static level) and 1.1500 (static level, round level) could be seen as next hurdles.
