EURUSD Bearish Ahead as US Resilience Meets Eurozone FragilityEURUSD has shifted into bearish territory, pressured by growing divergence between a resilient US economy and a struggling Eurozone. The pair recently rejected the 1.1700 zone, forming multiple bearish structures on the 4H chart. With sticky US inflation, Trump’s renewed tariff agenda, and a dovish ECB, EUR/USD appears poised for a deeper move toward 1.1527 and possibly 1.1445 in the coming sessions. This setup is both technically and fundamentally aligned, but key event risk remains.
🔸 Technical Structure (4H)
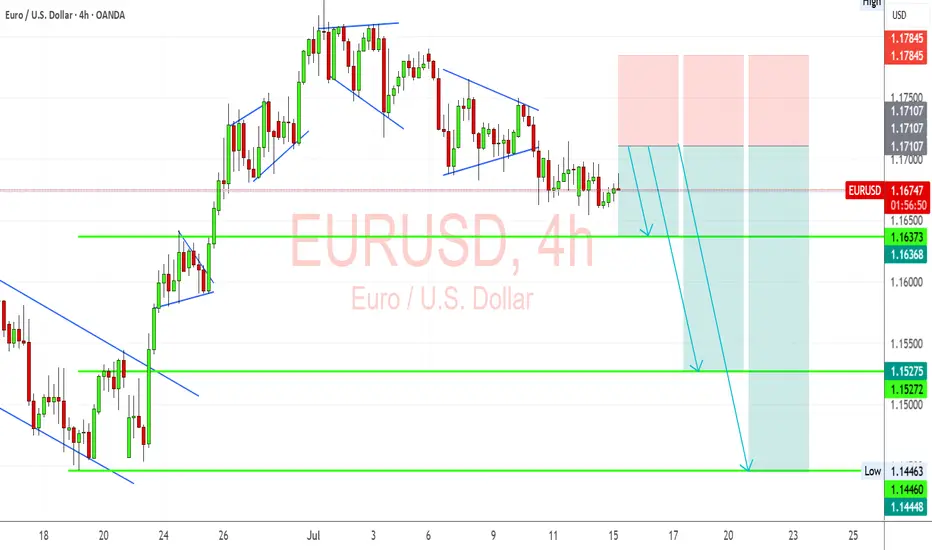
Clear rejection from the 1.1700–1.1710 zone.
Bearish pennants and wedge patterns confirm continuation lower.
Downside targets:
🔹 First: 1.1637
🔹 Second: 1.1527
🔹 Final: 1.1445
Risk zone: Above 1.1785 (invalidates short bias if broken cleanly).
🧭 Key Fundamentals
🇺🇸 Dollar Strength: Sticky inflation, stable labor market, and geopolitical risk all favor USD demand.
🇪🇺 Euro Weakness: ECB dovish tone persists amid weak data, soft PMIs, and stagnating growth.
Yield Spread: US-Euro real yield spread supports further EUR/USD downside.
Tariff Pressure: Trump’s 50% tariff plan and tensions with the EU weigh on EUR.
⚠️ Risks to Watch
A surprise dovish pivot from the Fed.
Weak US CPI or disappointing retail sales.
Major risk-on flows that trigger broad USD weakness.
New EU fiscal stimulus or Germany/France recovery surprises.
📆 Key Events Ahead
🇺🇸 US Core CPI – A hot print supports USD strength.
🇺🇸 Retail Sales & Powell testimony – Watch tone on rate cuts.
🇪🇺 German ZEW Sentiment, Eurozone HICP inflation – Weak readings would further drag EUR.
🔄 Leader or Lagger?
EUR/USD is a lagger to GBP/USD, often following UK-driven USD moves.
Acts as a leader for EUR/JPY, EUR/AUD, EUR/CHF – weakness here cascades across EUR crosses.
Tracks broad USD sentiment – dovish Fed pricing boosts EURUSD, while rate hike fears drag it.
✅ Summary: Bias and Watchpoints
EUR/USD is bearish below 1.1700 as economic divergence, sticky US inflation, and rising geopolitical tensions favor the dollar. ECB policy remains soft, offering little support to the euro. Key risk lies in a dovish Fed pivot or softer US data. Watch US CPI and Powell for clues. This pair is likely to lag GBP/USD moves, but will lead EUR crosses lower if the downside momentum continues.
Eurusdlong
EUR/USD Set to Fly – Don’t Miss This Perfect Channel Breakout!Hi traders!, Analyzing EUR/USD on the 30-minute timeframe, we can observe that price is respecting the ascending channel and reacting to the dynamic trendline support (green dashed lines). A recent bounce suggests a potential bullish continuation within this structure.
🔹 Entry: 1.17399
🔹 Take Profit (TP): 1.17640
🔹 Stop Loss (SL): 1.17056
Price remains above the 200 EMA, confirming a bullish environment. The bounce aligns with the lower boundary of the channel and follows a short consolidation period, indicating buying pressure. The RSI also shows signs of recovery after approaching oversold levels, supporting the idea of upward momentum.
This long setup offers a favorable risk/reward ratio and aims to capture continuation toward upper channel resistance.
⚠️ DISCLAIMER: This is not financial advice. Trade at your own risk and always use proper risk management.

EURUSDHello traders,
I've been closely monitoring the **EURUSD** pair for a while, and it’s now offering an ideal entry opportunity. It has presented several great setups for swing trading, and I’d like to share one of them with you today.
🔍 **Trade Details**
✔️ **Timeframe**: H4/D
✔️ **Risk-to-Reward Ratio**: 1:4.22
✔️ **Trade Direction**: Buy
✔️ **Entry Price**: 1.17281
✔️ **Take Profit**: 1.18997
✔️ **Stop Loss**: 1.16874
🔔 **Disclaimer**: This is not financial advice. I’m simply sharing a trade I’ve taken based on my personal trading system, strictly for educational and illustrative purposes.
📌 Interested in a systematic, data-driven trading approach?
💡 Follow the page and turn on notifications to stay updated on future trade setups and advanced market insights.

EURUSD(20250723) Today's AnalysisMarket news:
White House officials plan to visit the Federal Reserve headquarters on Thursday local time.
Technical analysis:
Today's buying and selling boundaries:
1.1730
Support and resistance levels:
1.1811
1.1781
1.1761
1.1699
1.1679
1.1649
Trading strategy:
If the price breaks through 1.1761, consider buying, the first target price is 1.1781
If the price breaks through 1.1730, consider selling, the first target price is 1.1699

EURUSD Analysis : Liquidity Sweep – EURUSD Targets TO Reversal🧠 Institutional Context & Big Picture
EURUSD has been in a tightly controlled descending channel for several weeks—a classic sign of a market being engineered for liquidity collection. Rather than a naturally trending bearish market, this price action reflects stealth accumulation and market maker manipulation.
The channel structure was used to:
Establish a visible bearish trend (to trap sellers)
Trigger emotional bias for continued shorting
Build up stop orders below swing lows
This phase was about building energy, not continuation.
🔍 Detailed Breakdown of the Chart Elements
📌 1. Descending Channel – Controlled Manipulation
The pair moved within a well-defined bearish channel for multiple weeks.
Each touch respected the top and bottom perfectly—not random, but institutional structure.
It fostered retail confidence in the downtrend while market makers prepared for a reversal.
💥 2. Liquidity Sweep & Trap (Low Breaked & Liquidity Grabbed)
Price spiked below the previous low, clearly sweeping liquidity on July 21.
This is the "engineered breakdown", meant to trigger breakout sellers and stop out early longs.
Immediately after the sweep, the price violently reversed—clear evidence of a liquidity trap.
This is classic MMC logic: induce, trap, reverse.
🟩 3. QFL Base Formed – Bullish Engine Ignited
At the point of reversal, the chart shows the formation of a QFL (Qualified Liquidation Failure) zone.
This QFL base is the core of smart money accumulation—price broke below a base, then quickly reclaimed it.
It's not just support—it’s the true origin of the reversal and an optimal entry point.
📈 4. Breakout from the Channel – Structure Shift Confirmed
Price broke out of the descending channel with strong momentum, confirming:
Structure shift from lower lows → higher highs
Momentum shift in favor of bulls
Entry confirmation for MMC-based long setups
This breakout invalidates the bearish trend and signals a fresh leg up, likely toward unmitigated supply zones.
🟨 5. Current Price Action – Healthy Bullish Consolidation
After the breakout, price is consolidating just above the broken channel, forming a mini-flag or base.
This indicates:
Smart money is accumulating more
No significant selling pressure
Likely continuation toward next supply
🎯 6. Next Targets – Reversal Zones
Minor Resistance: ~1.1800
Major Resistance: ~1.1850 – 1.1880
Next Reversal Zone: 1.1900–1.1950
This zone is highlighted as a potential sell-off area where institutions may offload positions or create new traps.
Watch for signs of exhaustion or redistribution here.
📌 Trade Plan Based on MMC Structure
✅ Bullish Scenario (Currently Active)
Entry Area: Ideally at QFL base or breakout retest (~1.1700–1.1720 zone)
Confirmation: Bullish price action (engulfing, flag break, or liquidity wick)
Targets:
🎯 TP1: 1.1800
🎯 TP2: 1.1850
🎯 TP3: 1.1950 (Reversal Supply Zone)
❌ Invalidation:
A break below the QFL base (~1.1670) with bearish volume would invalidate the bullish MMC structure.
🧠 Smart Money Insight & Logic Recap
This entire move reflects a classic Market Maker Strategy:
Build a trend (descending channel) to shape trader bias
Trigger liquidity events (false breakdown)
Accumulate at the lows via QFL logic
Shift structure (channel breakout)
Target unfilled institutional supply (1.1850–1.1950)
This isn’t random—it’s engineered movement. Your job as a trader is to identify footprints, not follow the crowd.
Today's EURUSD Analysis : Channel Break : EURUSD Eyes 1.19056Chart Overview:
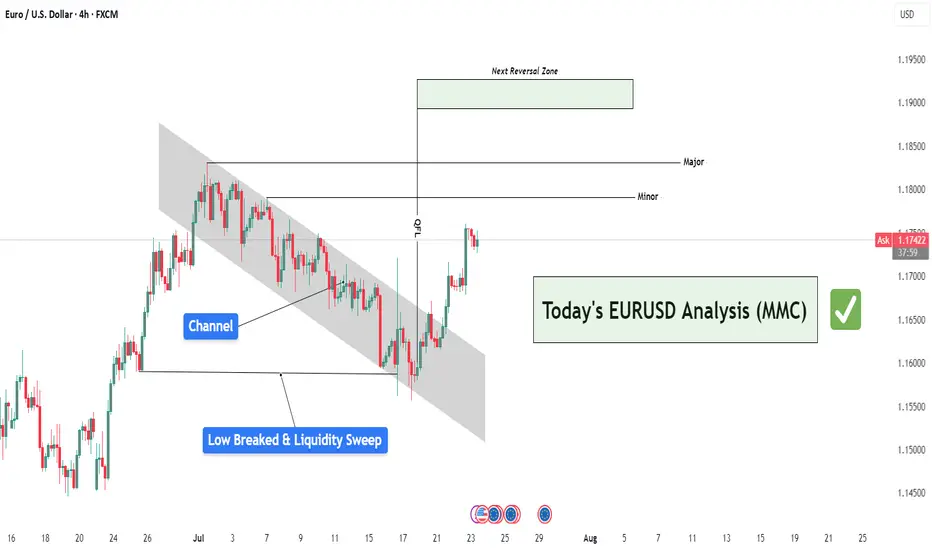
The EURUSD pair has broken out of a well-defined descending channel, indicating a potential shift in momentum. Price has now approached a critical Central Zone that acts as a probable reaction or reversal area. This zone lies between minor and major supply levels.
🔍 Key Technical Highlights:
Descending Channel:
Price was previously trapped in a bearish channel. This channel was respected with multiple touches on both upper and lower bounds, showing controlled bearish structure.
Breakout & Momentum Shift:
The recent bullish breakout above the channel suggests buyers are gaining control. A strong candle has closed outside the structure, confirming the breakout.
Major & Minor Zones:
Two levels are marked just above the breakout:
Minor Resistance: First possible supply zone where price may pause.
Major Resistance: A stronger historical level and the top of the Central Zone.
Central Zone Reaction Area (CZRA):
This is the MMC's focus area — price is expected to react here. Either we see a rejection that could confirm a reversal setup, or price slices through, opening the door to the Next Reversal Zone around 1.19056.
📌 Strategic Condition (MMC Logic):
Condition 1:
If price respects the Central Zone and shows bearish signs (e.g., wick rejections, engulfing candles, divergence), we expect a strong pullback or reversal toward previous demand levels.
If Condition 1 Fails:
The annotation clearly states: “If this condition not apply, it will go 100%.”
Meaning: If price breaks and holds above the Central Zone, it confirms bullish strength, targeting 1.19056 — the Next Reversal Zone (NRZ).
📊 Trader's Mindset (MMC Application):
This setup is a classic MMC structure trap-break scenario:
The channel traps sellers,
The breakout invites buyers,
And the Central Zone becomes the battlefield.
Wait for confirmation, not assumption. Whether it's rejection or breakout, risk management and reaction-based trading are key.

EURUSD and GBPUSD Analysis todayHello traders, this is a complete multiple timeframe analysis of this pair. We see could find significant trading opportunities as per analysis upon price action confirmation we may take this trade. Smash the like button if you find value in this analysis and drop a comment if you have any questions or let me know which pair to cover in my next analysis.

EURUSD Breaks Bullish Structure – Here’s My Trade Plan📍 Watching EURUSD closely—it's recently broken bullish (market structure) on the daily timeframe 📈.
I’m now waiting for a retrace into a fair value gap, watching for the rebalance and a possible support zone touch before the next leg up 🔄🟢.
🎥 In this idea, I walk you through:
🔍 Price action
🧱 Market structure
📊 Trend direction
📋 And my personal trade plan for this setup
Not financial advice ❌💼

EURUSD Trading Price Channel, SELL Strategy✏️ OANDA:EURUSD H4 Timeframe EURUSD is trading in a bearish channel. This bearish channel may extend to the important support at 1.145. A break of this important support will form a Downtrend. Further upside recovery will remain limited by the channel, with the notable upper boundary at 1.16800.
📉 Key Levels
Sell trigger: rejection from 1.168 with bearish confirmation
Sell DCA: Break 1.155
Target: 1.145
Leave your comments on the idea. I am happy to read your views.

Eurusd changing trendPrepeair Ur selv to see euro against US dollar with a kinda big or minimum huge profit, going 2 cents above, from 1.1620 to 1.1840, ofc this is only in my POV.
Keep Ur investment safe and use lways a stop loss under wht you can lose, and I don't mean this trade, but all I mean, is that it need to be after Ur analista and Ur own Point of View.
Keep Ur trade simple
Abd do your own research, always.

eurusd upin my pov euro dollar is going up, first instance until 1.1670 then 1.1730 after that maybe until 1.18 oreven 1.19

EURUSD – WEEKLY FORECAST Q3 | W30 | Y25📊 EURUSD – WEEKLY FORECAST
Q3 | W30 | Y25
Weekly Forecast 🔍📅
Here’s a short diagnosis of the current chart setup 🧠📈
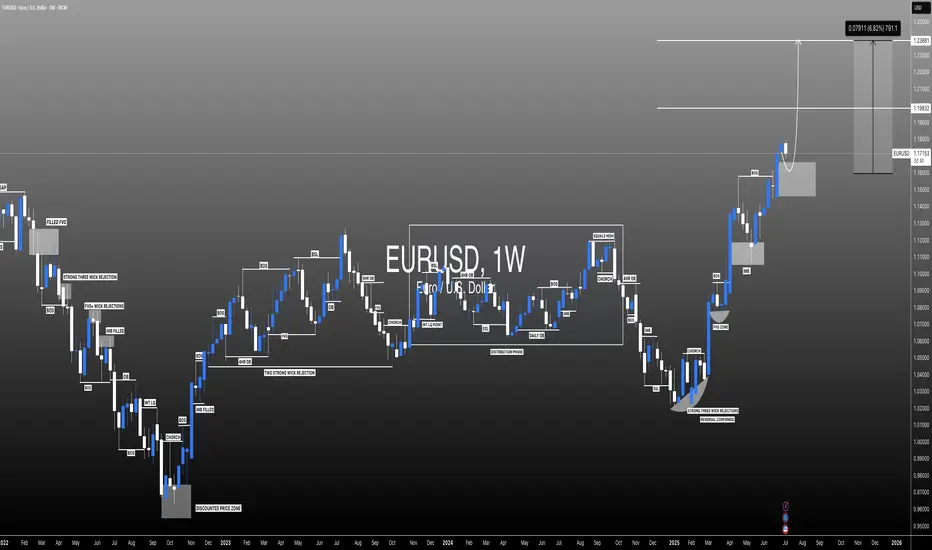
Higher time frame order blocks have been identified — these are our patient points of interest 🎯🧭.
It’s crucial to wait for a confirmed break of structure 🧱✅ before forming a directional bias.
This keeps us disciplined and aligned with what price action is truly telling us.
📈 Risk Management Protocols
🔑 Core principles:
Max 1% risk per trade
Only execute at pre-identified levels
Use alerts, not emotion
Stick to your RR plan — minimum 1:2
🧠 You’re not paid for how many trades you take, you’re paid for how well you manage risk.
🧠 Weekly FRGNT Insight
"Trade what the market gives, not what your ego wants."
Stay mechanical. Stay focused. Let the probabilities work.
FRGNT FOREX ANALYSIS 📊

#EURUSD: Last Bullish Price Extension! Get Ready! EURUSD is approaching our buying zone, a key level, which suggests a smooth bullish reversal. As this is a swing trade, we advise keeping stop losses larger. There are two targets to keep an eye on. Remember, this is not a guaranteed move, and this is just our overview. Good luck and trade safely.
Team Setupsfx_
EURUSD Holding Support — Bullish Move in ProgressHello everybody!
There is a strong higher timeframe resistance now acting as support.
Price is respecting this area and starting to form a strong move to the upside.
We are looking to enter a buy position here, as the overall bullish trend is likely to continue.
EURUSD Buy Trade Idea: Reversal Rocket Ready to Launch!Hey Fellow Traders! 👋
The EURUSD (EU) is setting up for a massive reversal that’s got me hyped! 🚀 After nailing the lows of that descending channel like a pro, price has retraced to our expected zone and is now bouncing hard. It’s time to gear up for a potential buy trade targeting the Buyside Liquidity! Let’s break down this fire setup and get ready to ride the wave! 🌊
📈 The Setup: Reversal in the Making!
EU hit the descending channel lows as predicted, and now it’s showing some serious bullish vibes with a strong bounce off a key weekly trendline support. This isn’t just a random move—price is reacting to a weekly demand zone and a trendline that’s holding like a fortress. 🏰 I’m expecting a reversal to kick in, aiming for that juicy Buyside Liquidity up top. But hold up—don’t just dive in blindly! Let’s talk strategy. 😎
🎯 Trade Details: How to Play It Smart
Entry Zone: Look for a calculated entry in this bounce area. Key setups to watch for:
FVG (Fair Value Gap) or IFVG (Imbalance Fair Value Gap) for precision entries.
Order Blocks (OB) for high-probability setups.
Trendlines/Support Zones: Use these for confluence, as EU is respecting that weekly trendline support.
Target: We’re gunning for the Buyside Liquidity—a high-probability target where price loves to gravitate.
Stop Loss: Place your stops below the recent lows or your chosen setup (FVG/OB) to keep risk tight.
👀 Keep an Eye on DXY for Confluence
The Dollar Index (DXY) is a key player here. A weakening DXY could supercharge this EU reversal, so monitor it closely for extra confirmation. If DXY starts to roll over, it’s like pouring rocket fuel on this trade! 🚀
🧠 Why This Reversal Makes Sense
Weekly Trendline Support: Price kissed this level and is bouncing like it means business.
Weekly Demand Zone: This area has historical strength, making it a prime reversal spot.
Channel Lows Conquered: EU smashed through the descending channel lows and is now retracing for the next leg up.
⚠️ Risk Management Reminder
Don’t YOLO this one! Use proper risk management—calculate your position size, set tight stops, and only enter when your setup aligns. Whether you’re using FVGs, OBs, trendlines, or classic support/resistance, make sure your entry is calculated to avoid getting caught in a fakeout. 💪
💬 Let’s Talk Trades!
What’s your take on this EU reversal? Are you jumping in with an FVG, OB, or something else? Drop your thoughts, setups, or questions in the comments below! 👇 If this idea gets you pumped, smash that LIKE button ❤️, follow for more banger trade ideas, and share your charts with the community! Let’s keep the vibes high and the profits higher! 💰
#EURUSD #ForexTrading #BuyTrade #Reversal #TradingView

EURUSD(20250718) Today's AnalysisMarket news:
① Kugler: It is appropriate to keep the interest rate policy stable for "a while".
② Daly: Whether to cut interest rates in July or September is not the most critical.
③ Bostic: It may be difficult to cut interest rates in the short term.
Technical analysis:
Today's buying and selling boundaries:
1.1597
Support and resistance levels:
1.1683
1.1651
1.1630
1.1565
1.1544
1.1512
Trading strategy:
If the price breaks through 1.1630, consider buying in, the first target price is 1.1651
If the price breaks through 1.1597, consider selling in, the first target price is 1.1565

EURUSD Bullish Continuation OutlookFX:EURUSD has been trading in a bullish trend. Currently price is retesting the previous resistance level, as well as 0.618 fib. Hidden bullish divergence can be observed on the chart, in addition to regular bullish divergence on lower timeframes (1 & 4 hour).
I am expecting bullish continuation from here to complete the price projections!

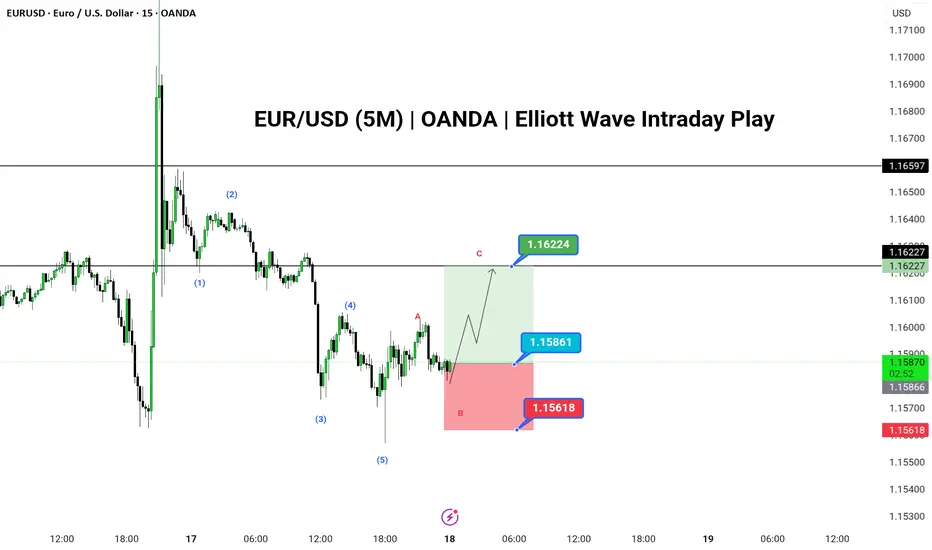
EUR/USD Bullish Setup in Progress as Wave C Targets 1.1622
🟢 LONG BIAS
📅 Updated: July 16
EUR/USD has completed a clean 5-wave impulse structure to the downside, followed by an unfolding ABC corrective pattern on the 5-minute chart. With Wave A and the ongoing B leg nearing completion, bulls may look to capitalize on a Wave C rally toward the 1.1622 resistance zone.
The structure suggests a temporary bullish move within a broader correction. Entry near the 1.1586 level offers a solid R:R setup, with invalidation below 1.1561. This setup is ideal for short-term intraday traders using Elliott Wave theory and expecting a 3-wave corrective rally.
---
📊 Technical Structure (5M)
✅ 5-wave bearish impulse labeled (1)-(5) complete
✅ ABC correction developing (currently in Wave B)
✅ Potential for bullish continuation via Wave C
📌 Upside Target
✅ Final: 1.16224
🔻 Risk Zone
❌ Invalidation: Below 1.15618
---
📈 Market Context
USD Consolidation: Dollar index pauses after strong rally, offering intraday relief to majors.
Euro Support: Mild bid across EUR crosses, offering stability in low-timeframe setups.
No High-Impact News: Ideal technical environment for short-term wave trading.
---
⚠️ Risks to Watch
Breakdown below 1.1561 would invalidate the structure.
Sudden volatility from unscheduled news.
Failure of Wave C to reach projected resistance.
---
🧭 Summary: Bias and Watchpoints
EUR/USD is setting up for a potential Wave C move toward 1.1622 as the ABC corrective structure plays out. Bullish bias holds above 1.1561 with a high-probability setup unfolding for short-term wave traders. Watch for price reaction near 1.1586 and use tight risk control.
EURUSD BUY IDEAWe can anticipate buy setup on EURUSD to close up those imbalance caused my yesterday's news.

#EURUSD: Still Extremely Bullish! Let's see how it goes! EURUSD is currently making minor correction and it is likely to reverse in coming days. We have to area from where price could reverse from. we advise you to read the chart and also do your analysis before making any decision.
Like and Comment For More!
Team Setupsfx_

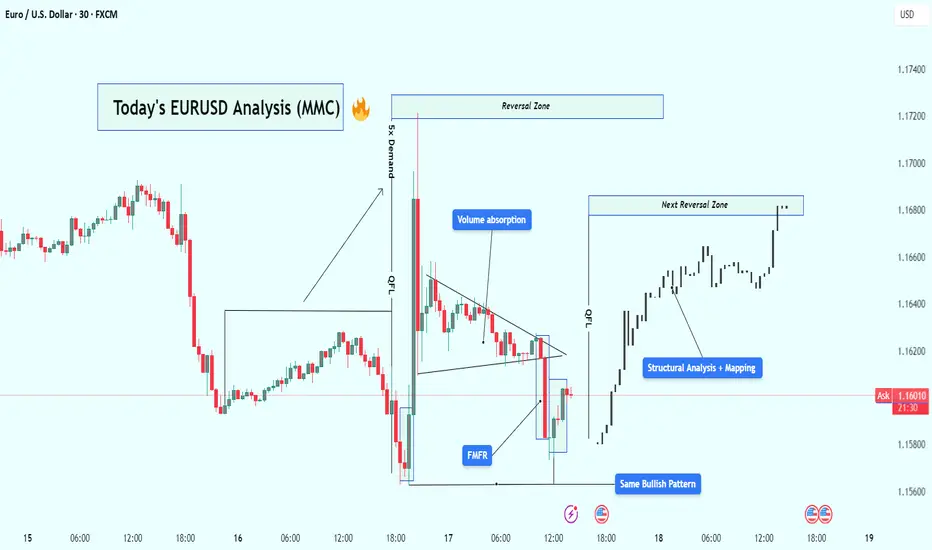
EUR/USD Analysis : Bullish Reversal – Volume Absorption & Target🧠 Market Overview:
EUR/USD has followed a flawless Market Maker Cycle, moving from manipulation to expansion. The chart shows institutional behavior through liquidity grabs, volume absorption, and structural breaks, confirming that big players are in full control.
The current price action signals bullish strength targeting the next high-probability reversal zone, but let’s break this down from the very beginning.
🔍 Key Chart Phases and Insights:
1️⃣ Massive Bearish Impulse – Liquidity Sweep Phase
At first glance, the chart shows an aggressive drop — a strong bearish leg that looks like market weakness.
❗ But in reality, this is the liquidity sweep phase. Here’s what likely happened:
Price ran below key lows
Hit stop losses of early buyers
Created “fake” bearish sentiment
Built sell-side liquidity for institutions to buy from
🔑 This isn’t weakness — it’s a setup.
2️⃣ FMFR (Final Move for Reversal) + Instant Reaction
At the end of that drop, the market printed a sharp bullish engulfing candle from the lows — this is known as the Final Move for Reversal (FMFR).
This marks:
The end of the accumulation phase
Entry of smart money into the market
The beginning of a new bullish cycle
The size and speed of this move indicate high-volume orders were filled — classic sign of institutional presence.
3️⃣ 5x Demand Push – Start of Expansion Phase
After the FMFR, price explodes upward with 5 consecutive bullish candles. This is your expansion phase — the market is moving fast, breaking structure, and flipping direction.
Key takeaways from this leg:
Strong displacement confirms a new trend
High momentum candles reflect institutional interest
Price breaks above previous structure levels
📈 This is no longer random — it’s planned and executed by bigger players.
4️⃣ Volume Absorption in Tight Wedge – Smart Money Re-Accumulation
After the breakout, price doesn’t just continue flying — instead, it compresses in a tight triangle. This is a key phase called volume absorption or re-accumulation.
What’s happening here:
Institutions are absorbing retail orders
Low volume = no resistance = easier breakout
Price is “charging” before the next move
🔋 Think of this like coiling a spring — it’s getting ready to pop again.
5️⃣ Bullish Pattern Repeats – MMC Confirmed
Interestingly, we now see the same bullish pattern forming again on the right side of the chart, similar to the first FMFR.
This is powerful because:
Pattern repetition means consistent order flow
Smart money is using the same blueprint
It gives us confidence to follow the trend
⚠️ When the same bullish setup happens twice — it’s not by chance.
6️⃣ Structural Mapping – Road to Reversal Zone
On the far right, we’ve entered clean bullish structure, making higher highs and higher lows.
We are now targeting:
The next Reversal Zone near 1.16800
This zone could act as resistance or another trap
A strong reaction from this zone can trigger either profit-taking or short-term reversal
Price is currently in the "continuation" part of MMC, heading toward premium levels.
📈 Trading Plan Based on This Setup:
✅ Primary Bullish Plan:
Price respects current structure
Breaks minor highs with strong volume
Entry on retracement to broken structure
Target: 1.16800 reversal zone
⚠️ Alternate Bearish Setup (If Price Rejects Reversal Zone):
Sharp rejection from reversal zone
Break of structure (BOS) on lower timeframe
Entry on lower high retest
Target: Liquidity areas below 1.16200
🧵 Conclusion:
This EUR/USD chart is a blueprint of institutional market flow. From the liquidity sweep, to volume absorption, to repeating bullish patterns, we’re seeing a textbook Market Maker Cycle (MMC) play out.
Here’s what makes this chart powerful:
✔️ Volume confirms structure
✔️ Reversal zones are clearly defined
✔️ Same bullish pattern = smart money roadmap
✔️ Trade setups are clean with defined risk
✅ This is the kind of setup you wait days for — don’t rush, follow structure, and execute with confirmation.
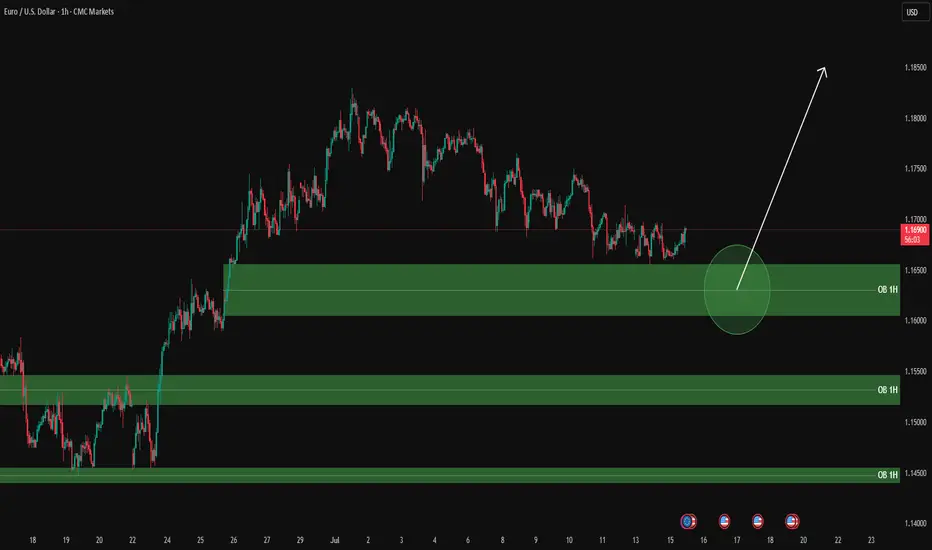
EURUSD analysis – 1H OB Setup
✅ Green zones = 1H Buy Order Blocks
Clean plan:
Wait for price to reach the green circle zone (1.1600 – 1.1650 OB).
Once there:
✅ Drop to LTF (5M / 3M) and wait for:
Price reaction to the OB zone
BOS / CHoCH structure confirmation
Strong bullish candle for clean entry
Then, enter with stop below the OB zone.
🎯 Targets:
First TP: 1.1690 – 1.1700
Second TP: higher previous highs if momentum continues
⚠️ Let price enter your zone, get your LTF confirmations, and then take your entry with discipline.
📊 ProfitaminFX | Gold, BTC & EUR/USD
📚 Daily setups & educational trades
EURUSD Forming Bullish Continuation SetupEURUSD is currently retesting a key breakout zone that previously acted as resistance and is now serving as strong support around the 1.1620–1.1630 area. After a healthy bullish impulse in recent weeks, the pair is pulling back in a controlled manner, likely forming a bullish continuation setup. I entered from earlier levels and remain confident in a further upward move, with the structure showing signs of a new bullish wave forming.
From a fundamental perspective, the euro is gaining strength as the European Central Bank (ECB) continues to signal a more cautious stance on rate cuts compared to the Federal Reserve. US inflation data released last week came in softer than expected, increasing speculation that the Fed could start its rate-cutting cycle as early as September. This shift in monetary policy outlook has weighed on the US dollar, opening up room for EURUSD to push higher.
Additionally, eurozone macro data is showing early signs of recovery, especially in Germany, where industrial production and sentiment indicators are slowly improving. As inflation in Europe trends lower but remains sticky, the ECB has fewer reasons to rush into easing, which adds strength to the euro over the medium term. This divergence is a critical driver of the current bullish sentiment in EURUSD.
Technically, the market is respecting a clean demand zone, with momentum indicators starting to flatten after the recent correction. With the trend structure intact and fundamentals aligned, I'm targeting the 1.2180–1.2200 zone as the next leg of this bullish cycle. Price action remains favorable, and the broader sentiment on TradingView is also increasingly bullish, confirming my conviction in this setup.
