Long eurusd 15 novembreOn the chart, you see we were in a big falling wedge and we have broken the falling wedge. For me, personally, I was waiting until she broke the falling wedge. Now I will take a long position until the TP you see on the chart. For me, it's a bullish opportunity to take a long on Euro
Eurusdlong

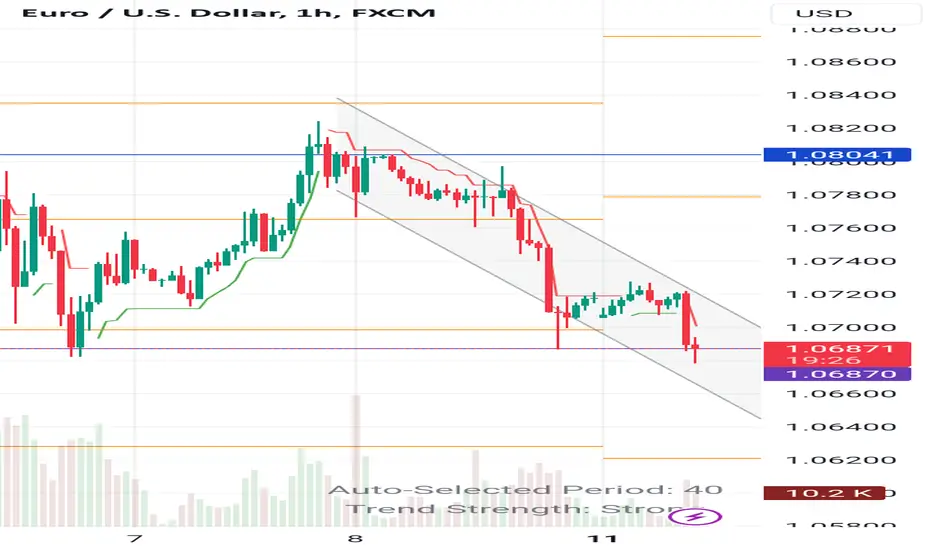
Eurusd changing of trend?Is this a change on eurusd trend?
This is my setup for eurusd, but all can change at 8am London time, with London entering the market, but here is my setup to 1.0570 eurusd
DOYR
always

#eurusd #elliottwave long buy setup 14Nov24 wave cThis count is based on my assumptions so anything can happen not a trading or financial advice just for educational purposes only kindly do your own ta thanks trade with care good luck.

I think I got this...but I'm going against the dollar at low low
Asia Thursday and very little rest for the wicked. My attempt at doing something for a change different to trading and getting a life, I ended up mowing the back lawn.
Betting here against the USD, I could feel the squeeeze for a bit of love for the EURO.
I like this combo, unlike Gold they don't start betting against you, if you get direction right they may not give it to you straight away, but then ya see your account an hour or 2 later and they liked your work. Well that's what I tell myself. Theres less volume this time of day.
Last night or yesterday daytime NY, as am in Australia, after sqeezing a bit of profit out of those tight-ars*s over at the Gold & Silver show, I went across and took about 5 long positions with the Japanese Indices, they were down about 1.7%, I saw that the chart was good to go long, the rubber-band trade which is my go-to, it was a pleasure to trade with them, I guess I was one of the first to turn the trade around for them and they appreciated that, but it was all the other hands coming in Long after me. I might make a video for a bit of a laugh.

EURUSD - depreciation more than 7% since Trump administrationTeam,
I do not often trade EURUSD or you could say rarely
but last night, we made some trades.
Since Trump won the presidency, the EUR has been pulling back more than 5% against the US Dollars.
Today, we have the opportunity to ENTER EUR/USD at 10.5620-1.05650
Target 1st at 1.05700
Target 2 at 1.05800
Target 3 at 1.06200
Once it reaches 1st target, bring stop loss to BE.
Please note: if you are not familiar with the trade, be sure to set the stop loss, see how much you are risking for the trade, and then adjust the volume that fits you.
This trade can be 3-5ROI (RETURN ON INVESTMENT)

EURUSD UpdateWe extend our SL and TP on this pair because it look there is more potential
Follow us for more

EUR/USD setting up for a bullish move!EUR/USD has reached our strong Daily spport (Level1.06233). We might get a push to the upside from here! Remember to trade safe and responsible all the times

Long Opportunity on EUR USD 4H timeframe On Weekly and Daily We have a Clear downtrend, At the Moment we expect a possible correction to up 1.09300 Level.
According to Breakout downtrend line
After retest of the broken Trend line.
According to Convergence on CCI.
Level up of Zero on CCI.
According to Positive Price Action
Using Fibonacci Retracement to detecting our Target.
That Analysis will be canceled if Price hit SL @ 1.07800.

Long Opportunity On EURUSD 1h Time Frame According to reversal On 4h Time Frame
According to Positive Price Action
According to Forming a New Uptrend channel
According to Positive Trend on CCI

EURUSD - BULLISHLooking to buy after the break above 1.07400 on the 1HR TF, and will consider partial buying. Buying strategy involves waiting for the break above 1.07400 and retest of the lows.
**This is solely my trading strategy and not financial advice.**
**Please trade with proper risk management.**

#eurusd #elliottwave long buy setup wave c 11Nov24This count is based on my assumptions so anything can happen not a trading or financial advice just for educational purposes only kindly do your own ta thanks trade with care good luck.

EURUSD trade setup battle:-Today Euro made 3 months low with also break previous low and holding side . There we can setup a loss free trade setup ::-
Euro have strong support levels @ 1.06000 .
So we have to build buy and sell both position at this time :-
First we have to buy and sell on same strike price with same quantity and hold for target 1.06000 $ than we exit from sell side we get our target and hold buy position for target 🎯 1.08000 level.
Stay tuned with me for more updates and follow me.
EURUSD at Support LevelEURUSD is at it's support level and order block on 4hrs at same level so we can probably see trend reversal from here. Buy entry from current levels.
Manage your risk according to your account size.

eurusd setup, will it go up?eurusd will it go up?
we will see, this is my setup fpr it,
a bit correction downwards the jump up again, lets see, after us election im not sure about anything, it can go 1.02 or 1.12, only the market knows, we just need to follow it,
keep safe and do ur own research, keep ur trading safe.

The Breakout (The Easiest Chart To Ever UnderstandMy other Idea has a video explanation if anyone is interested

EURUSD SELL | Idea Trading AnalysisEURUSD is moving on support zone
The chart is above the support level, which has already become a reversal point twice.
We expect a decline in the channel after testing the current level.
We expect a decline in the channel after testing the current level
Hello Traders, here is the full analysis.
I think we can soon see more fall from this range! GOOD LUCK! Great SELL opportunity EURUSD
I still did my best and this is the most likely count for me at the moment.
-------------------
Traders, if you liked this idea or if you have your own opinion about it, write in the comments. I will be glad ⚜️

EURUSD 1.07813 -0.19% MULTI TF INTRADAY SET-UPHELLO TRADERS
Hope everyone is doing great
📌 A look at The EURUSD At the close of ASIA INTO THE LONDON, TO NY PM SESSION
- As we draw to the close of the week, looking for EU to close bullish In correlation with GU.
* on the 4H looking for a bearish open with the close of ASIAN SESSION.
* PO3
* Push LOWER before going for HIGHER structures LQ pull.
1 HOUR TF
* Looking for the mitigation of the bullish OB+.
* FVG below has already been mitigated.
* if this structure holds, looking for long entries to close the week.
* DXY 4H
* BASED on the price action served next session...
* We will see what does the market dish.
🤷♂️😉🐻📉🐮📈
HOPE YOU ENJOYED THIS OUT LOOK, SHARE YOUR PLAN BELOW,🚀 & LETS TAKE SOME WINS THIS WEEK.
SEE YOU ON THE CHARTS.
IF THIS IDEA ASSISTS IN ANY WAY OR IF YOU ENJOYED THIS ONE
SMASH THAT 🚀 & LEAVE A COMMENT.
ALWAYS APPRECIATED
____________________________________________________________________________________________________________________
Kindly follow your entry rules on entries & stops. |* Some of The idea's may be predictive yet are not financial advice or signals. | *Trading plans can change at anytime reactive to the market. | * Many stars must align with the plan before executing the trade, kindly follow your rules & RISK MANAGEMENT.
_____________________________________________________________________________________________________________________
|
* ENTRY & SL -KINDLY FOLLOW YOUR RULES | * RISK-MANAGEMENT | *PERIOD - I TAKE MY TRADES ON A INTRA DAY SESSIONS BASIS THIS IS NOT FINACIAL ADVICE TO EXCECUTE ❤
LOVELY TRADING WEEK TO YOU!

EURUSD Next possible moveWe are waiting for our asset to reach our action zone, and based on the reaction, we’ll decide on our next moves.ALWAYS WAIT FOR A CONFIRMATION TO SEE IF THE PRICE VALIDATES THE ZONE.

EURUSD - Short from bearish OB !!Hello traders!
‼️ This is my perspective on EURUSD.
Technical analysis: Here we are in a bearish market structure from daily timeframe perspective, so I look for a short. My point of interest is imbalance filled + rejection from bearish OB.
Like, comment and subscribe to be in touch with my content!

Post-Election and FOMC Impact— EURUSDEURUSD Breakdown Analysis
Date : November 7, 2024
Current Level : 1.0740
Forecasted Targets : 1.0800 (Resistance) and 1.0660 (Downside Target)
---
Overview:
EURUSD saw a significant drop yesterday, largely due to market reactions to the U.S. election uncertainty. Investors flocked to the dollar as a safe haven, strengthening it and putting EURUSD under downward pressure. The next focal point for the market is today’s FOMC decision, which could set the tone for the pair in the days ahead.
---
Election Impact on EURUSD:
The initial dip in EURUSD following the election highlights its sensitivity to U.S. political events. Market sentiment was cautious as investors digested updates, pushing the dollar up and sending EURUSD lower. This movement suggests continued dollar strength unless political clarity reduces the appeal of safe-haven assets.
---
Focus on Today’s FOMC Decision:
With the FOMC’s interest rate announcement imminent, we may see additional volatility. While rates are likely to remain unchanged, hawkish commentary or projections for future hikes could support further dollar gains, pushing EURUSD lower. Conversely, a dovish statement could trigger a dollar pullback, allowing EURUSD to approach the anticipated resistance level at 1.0800.
---
Technical Analysis and Forecast:
Currently trading at 1.0740, EURUSD is positioned near a key support zone. Short-term technical indicators point to potential resistance around 1.0800, which aligns with critical Fibonacci levels and a prior trendline. The pair may briefly reach this level before a likely reversal due to strengthening dollar fundamentals. Once EURUSD tests 1.0800, we anticipate a decline toward our downside target of 1.0660, a support level with historical significance.
---
Conclusion:
Today’s FOMC statement, paired with the ongoing effects of the U.S. election, positions EURUSD for a brief rally toward 1.0800, followed by a downturn targeting 1.0660. This range provides both resistance and support benchmarks, offering potential entry and exit points.

EURUSD: A Strong Move is Expected to move Big! Dear Traders,
EURUSD has reversed successfully now we think price is going to create all time high, taking price to record yearly high. With four targets are set, you can set the target accordingly to your risks. Use proper risk management.

#eurusd #elliottwave long buy setup wave c 6Nov24This count is based on my assumptions so anything can happen not a trading or financial advice just for educational purposes only kindly do your own ta thanks trade with care good luck.

EUR buyEURUSD setting up to go long on rejecting both discount zones on 1h & 4h charts. On the 1h chart its bouncing off a swing order block.
potentially heading up to 1.08220
if it breaks past 1.8220 it could travel higher to break previous highs on the daily & quarterly
