EURUSD ( AB Algorithm Setup) 30.06.2025 - 04.07.2025 While everyone is waiting for a pullback or a downward correction, or expecting this aggressive trend to break and lead to a sharp drop, the market will continue to rise. Because a trend is sustained by those who don't believe in it
Eurusdlongsetup

eurusd updateentry price 1.1329
stop loss update 1.133
take profit
1.153
1.165
1.177
1.194
result we hit first two target

EURUSD Will Keep Growing!
HI,Traders !
#EURUSD is trading in an
Uptrend along the rising
Support and the pair will
Soon retest the support
From where we will be
Expecting a bullish rebound
And a bullish continuation !
Comment and subscribe to help us grow !

Uptrend on EURUSDEURUSD has moved higher and is now testing the previous high.
This confirms the analysis and opens up additional buying opportunities.
Reduce the risk on all active buy positions as the analysis plays out.
Additional entries can be considered after a pullback or a breakout followed by a retest.
The next target is 1,1706!

EURUSDThis levels is for reactions to support and resistace.
Price can now in Bull-trend if keep 1.145$ in sypport and breaked trendline.
⚠️Control risk management for positions.

EURUSD Trade Plan: Retracement Into Key Fibo Zone POI.I’m currently watching EURUSD closely 👀. On the daily timeframe, it’s clearly broken structure and is now in a bullish trend 📈. Dropping down to the lower timeframes 🕒, price appears overextended and is now trading into a previous resistance level 🚧.
I’m anticipating a retracement into equilibrium — specifically the 50% level of the current swing, and ideally into the 50–61.8% Fibonacci retracement zone 🔁. If price pulls back into that range, I’ll be watching for a bullish market structure shift 🔄. I don’t want to see it push below the bullish imbalance 📉—I want that zone to hold as support so price can continue north 🔼.
If this plays out, my ideal entry would be around the imbalance and the 50% Fib level, with a stop loss just below the imbalance, and targets set at the current swing high and previous swing high, as detailed in the video 🎯.
⚠️ Disclaimer
This is not financial advice. Trading involves risk and you should only trade with capital you can afford to lose. Please do your own analysis or consult a licensed financial advisor.

EURUSD is in a Downside DirectionHello Traders
In This Chart EURUSD HOURLY Forex Forecast By FOREX PLANET
today EURUSD analysis 👆
🟢This Chart includes_ (EURUSD market update)
🟢What is The Next Opportunity on EURUSD Market
🟢how to Enter to the Valid Entry With Assurance Profit
This CHART is For Trader's that Want to Improve Their Technical Analysis Skills and Their Trading By Understanding How To Analyze The Market Using Multiple Timeframes and Understanding The Bigger Picture on the Charts

Chartanalyse: Der Chart zeigt eine Seitwärtskonsolidierung mitTechnical Overview:
The EUR/USD chart exhibits signs of a bearish reversal pattern forming near a key resistance zone (1.15800 - 1.16000), highlighted with repeated rejection wicks (🔴 red arrows). Price is currently trading at 1.15222, after failing to hold above the neckline of the rounded bottom pattern.
🔍 Key Observations:
🔺 Resistance Zone: Strong resistance has been confirmed multiple times (red arrows), indicating sellers are active at the top.
🟠 Double Top / Head & Shoulders Behavior: Price action shows topping formations (highlighted with orange circles), suggesting exhaustion of bullish momentum.
📉 Bearish Breakdown Possibility:
Price rejected near neckline and is showing bearish candle formations.
Breakdown from the current consolidation zone could push price toward the target zone at 1.14491, marked in purple.
This aligns with previous support structure, reinforcing a technical downside projection.
🔻 Support Zone: Around 1.13800 - 1.14000 is a strong area of demand and may act as the next bounce point if the bearish move continues.
📐 Chart Pattern Structure:
Rounded bottom formed earlier, but the failure to continue higher and breakout suggests a false breakout trap for buyers.
Downward sloping trendline broke, but now price is struggling to sustain above previous highs.
📌 Conclusion:
⚠️ Caution for bulls as price shows signs of weakness at resistance. A move below 1.15000 may initiate further downside toward 1.14491 and possibly lower. Short-term traders can watch for confirmation candles near this zone for entries.
📅 Short-Term Bias: Bearish
🎯 Target: 1.14491
⛔️ Invalidation: Strong breakout above 1.16000

EURUSD Breaks Structure: Bullish Continuation Opportunity💶 EUR/USD Analysis – Bullish Momentum Builds 📈
Taking a look at the EUR/USD on the daily chart, it’s clear the pair is currently in a strong bullish trend 🚀. Momentum has been building consistently, reflecting underlying euro strength and continued USD weakness.
🕓 On the 4H timeframe, we’ve now seen a clear shift in market structure to the upside, confirming bullish intent. Look for a continuation entry after a retracement back into equilibrium — ideally around the 50% level of the current price swing 🔄📐.
🎯 Trade Plan Idea:
Wait for price to pull back into equilibrium 🌀
Entry: Long from the discounted zone 🟩
Stop loss: Just below the recent swing low 🔻
Target: Previous high as a logical take-profit zone 🎯📊
⚠️ Disclaimer:
This content is for educational and informational purposes only and should not be considered financial advice. Always do your own research and consult with a qualified financial advisor before making any trading decisions. 📚💼

Core Impact Logic of the Middle East Situation on EURUSD(I) Energy Transmission Chain: Oil Price Fluctuations → Eurozone Inflation and Economy
The escalation of the Middle East situation (the Iran - Israel conflict, risks in the Strait of Hormuz) directly impacts the global energy supply chain:
If the conflict expands to block the Strait of Hormuz (transports ~20% of global crude oil 🛢️), Brent crude has already soared from recent lows—spiking over 5% on June 17 amid tensions ⛽️. This pushes up imported inflation in the Eurozone.
As a net energy - importing region 🌍, prolonged high oil prices will squeeze corporate profits, suppress consumption, and drag Eurozone economic recovery (German/French manufacturing is acutely energy - cost - sensitive 🏭). This weakens the euro’s fundamental support.
(II) Geopolitical Safe - Haven Sentiment: The "Safe - Haven Balance" Between USD & EUR
Amid Middle East tensions, the US dollar’s traditional safe - haven status competes with Eurozone havens like German bonds 📈:
If the US (e.g., the Trump administration) intervenes militarily 💥, market fears of "America mired in war" rise. USD safe - haven demand may temporarily weaken ⬇️, and the euro benefits as funds shift 🔄
⚡️⚡️⚡️ EURUSD ⚡️⚡️⚡️
🚀 Buy@ 1.14500 - 1.15000
🚀 TP 1.15500 - 1.15600
Accurate signals are updated every day 📈 If you encounter any problems during trading, these signals can serve as your reliable guide 🧭 Feel free to refer to them! I sincerely hope they'll be of great help to you 🌟 👇

EUR/USD Potential Reversal from Resistance Zone –Bearish OutlookThe EUR/USD pair has been trading within a well-defined ascending channel for several weeks. Price recently tested a strong resistance zone near 1.15850 – 1.16000, which aligns with the upper boundary of the channel and a previously marked supply area.
Key observations:
The price action shows signs of rejection from the resistance zone with a potential double-top or fakeout pattern forming.
A projected bearish trajectory is marked, suggesting a possible break below the channel support.
Immediate bearish targets are set at key demand zones around 1.14500, 1.12500, and further down to 1.10500.
A large red arrow indicates the strong downside bias if the price confirms the breakdown.
Conclusion:
If EUR/USD fails to sustain above the 1.15850 resistance zone and breaks below the ascending channel, a strong bearish correction is anticipated. Traders should watch for confirmation of the breakdown before entering short positions.

EUR/USD Bearish Reversal AnalysisEUR/USD Bearish Reversal Analysis 📉🧭
🔍 Technical Breakdown:
Trend Structure:
EUR/USD was trading inside an ascending channel, respecting both support and resistance trendlines.
🔴 Double Rejection at Resistance:
Price action faced strong rejection near the upper boundary of the channel and resistance zone (~1.16500), forming a lower high, suggesting bearish exhaustion.
🟠 Key Breakdown Zone:
A critical horizontal support around 1.13560 has been identified as a short-term target zone. This level previously acted as a demand zone and now may be retested.
🔽 Forecast Path:
A projected bearish wave is anticipated:
A potential pullback or consolidation may occur before resuming the downtrend.
Once 1.13560 is broken, price could drop further toward the major support zone around 1.12000, marked by the previous accumulation area.
🟦 Support Zone:
This final target aligns with a major structural support from late May, strengthening the bearish outlook if the breakdown continues.
📌 Conclusion:
EUR/USD is showing signs of a bearish reversal after failing to sustain above resistance. As long as it remains below the mid-channel region, further downside toward 1.12000 is likely, with 1.13560 as the key short-term level to watch.

EUR/USD Breakout Retest StrategyEUR/USD Breakout Retest Strategy 🟢📈
📊 Technical Analysis Summary:
The chart illustrates a bullish breakout from a consolidation range with a well-defined support near 1.12500 and resistance between 1.16500–1.17000.
🔍 Key Observations:
🔸 Triple Rejection Zone:
Price faced rejection 3 times (highlighted with orange circles) near the same level before the breakout — classic liquidity sweep above resistance.
🔸 Strong Support Bounce:
Each time price reached the green support zone, it showed strong bullish reaction (green arrows) signaling solid buying interest.
🔸 Break and Retest Formation:
Price broke the previous highs and now seems to be retesting the breakout zone (around 1.15250–1.15300). A successful retest could confirm bullish continuation.
🔸 Projected Bullish Move:
If the retest holds, we may see price pushing up toward the 1.17000 resistance zone as marked.
📌 Trading Plan:
✅ Bullish Bias above 1.15250
✅ Look for bullish candlestick confirmation or breakout structure
🚫 Avoid trades if price drops below 1.15000 with momentum
📈 Target Zone: 1.16500 – 1.17000
🛑 Stop Loss suggestion: Below 1.14750
🧠 Keep patience during the retest — smart money often tests emotions before real moves! 💰📉📈

EURUSD Setup | CPI Fades, Fed Focus & Gold Leads Dollar ReboundEURUSD is showing signs of exhaustion after soft US CPI failed to extend the rally beyond 1.1495. While markets initially priced in a dovish Fed response, recent commentary and gold’s rejection from its highs suggest the dollar may be gearing up for a short-term recovery. With Gold pulling back and yields stabilizing, EURUSD could now follow suit lower into key support levels—especially if the Fed maintains a patient tone at this week’s meeting.
🔹 EURUSD (4H) Analysis
📉 Bias: Bearish
💡 Context:
EURUSD stalled just below 1.1500 after the CPI miss and now sits at a high-liquidity reversal zone. With DXY stabilizing and gold already rolling over, EURUSD may lag behind but eventually follow the same path. If the Fed leans hawkish or even neutral (ignoring political pressure), it could catalyze a drop toward 1.1268 and below.
📊 Technical Levels:
Resistance Zone: 1.1495–1.1530
Target 1: 1.1268
Target 2: 1.1086
Invalidation: Daily close above 1.1530 (or strong bullish follow-through after FOMC)
🪙 Leading Asset Clue:
Gold has already rejected major resistance (3,390–3,403) and is now pulling lower. Historically, EURUSD tends to follow when metals stall—especially if driven by real yields and Fed dynamics.
⚠️ Fundamentals to Watch:
🏦 FOMC Rate Decision & Dot Plot (June 12)
📈 US PPI + Jobless Claims (June 13)
💬 Fed Chair Powell's Press Conference
📰 Any shift in ECB or Fed rate cut timelines
🧠 Risk Factors:
Fed surprise dovish shift due to CPI softness
Market overreacts to rate cut expectations
Geopolitical risk-off flows favoring EUR
✅ Summary: Bias and Watchpoints
EURUSD
Bearish
Fed holding firm vs. ECB easing bias
Fed turning dovish post-CPI (Top Risk)
FOMC Rate Decision, PPI, Powell
📌 Final Note:
Gold is leading the turn as dollar strength resurfaces. EURUSD may lag initially but the macro context favors downside from this key resistance zone. Watch the Fed for confirmation—positioning into 1.1268 and 1.1086 looks attractive if the dollar gains traction post-FOMC.

EUR/USD Rally Extends – Eyes on 1.20000 as Momentum BuildsHi Everyone,
As outlined in our analysis last week (idea linked below), EUR/USD continued to the upside and reached the 1.15240 level.
We expect price action to extend further toward the 1.16564 level, which would reinforce our long-term bullish outlook.
A confirmed break above this resistance would likely open the door for a move toward 1.18325, where we anticipate encountering dynamic resistance.
We will provide further updates on the projected path for EUR/USD should price reach this level.
The longer-term outlook remains bullish, with expectations for the rally to extend toward the 1.2000 level, provided the price holds above the key support at 1.10649.
We will continue to update you throughout the week with how we’re managing our active ideas and positions. Thanks again for all the likes/boosts, comments and follows — we appreciate the support!
All the best for a good end to the week. Trade safe.
BluetonaFX

EURUSD - TIME TO SHORT Team, last time we have successfully SHORT the EURUSD and now we are back on it again
This time we have better short position
NOTE: Last few days we have been killing the UK100/FTSE100 with such great opportunity.
Please follow the PRICE target accordingly to the CHART
Target 1 1.147200 to 1.4650
Target 2 at 1.1455-1.1450
Once it reach the 1st Target take 50% profit
Good luck and enjoy the profit

EURUSD Analysis todayHello traders, this is a complete multiple timeframe analysis of this pair. We see could find significant trading opportunities as per analysis upon price action confirmation we may take this trade. Smash the like button if you find value in this analysis and drop a comment if you have any questions or let me know which pair to cover in my next analysis.

EURUSD LIVE TRADEHello friends
Since the price has reached the specified important resistance, a correction in the price is expected. Therefore, you can enter the position with capital and risk management and move with it to the specified goals.
*Trade safely with us*

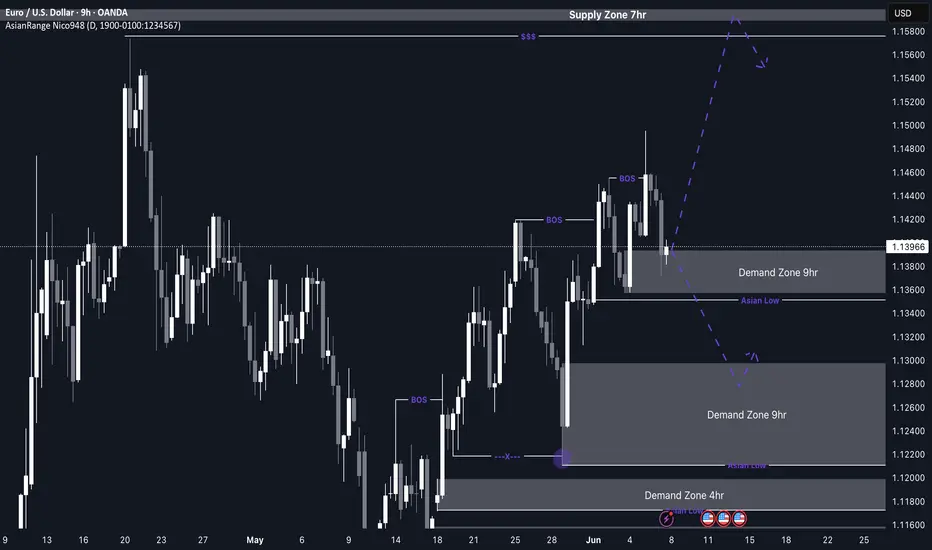
EUR/USD Potential buys from current zone or 1.12800My outlook for EU this week closely aligns with GU — both pairs are showing similar structure and direction. Price continues to form higher highs and higher lows, maintaining its bullish momentum.
Following the most recent break of structure to the upside, EU has now entered a 9H demand zone, where I’ll be watching for signs of accumulation and potential entry as the market opens on Monday.
If this current zone fails to hold, there’s a more discounted 9H demand zone just below, which could offer a cleaner long opportunity. Either way, both scenarios follow the pro trend, which adds conviction to the buy idea.
Confluences for EU Buys:
Price has broken structure to the upside and entered a clean 9H demand zone
There’s another refined 9H demand zone just below for additional confirmation
Plenty of upside liquidity remains untouched
Structure remains bullish on the higher timeframes, making this a pro trend setup
P.S. If price reacts well and continues pushing higher, I’ll be keeping an eye on the 7H supply zone above for any possible short-term bearish reaction.
Wishing everyone a successful and disciplined trading week ahead!
EUR/USD Awaits ECB Decision Near 1.1400 Amid Rate Cut BetsCMCMARKETS:EURUSD FX:EURUSD EUR/USD is consolidating above the 1.1400 psychological level as markets brace for the European Central Bank’s monetary policy announcement. The ECB is widely expected to cut its Deposit Facility Rate by 25bps to 2.00%, marking its seventh consecutive rate cut since June 2024.
Technically, the pair continues to trade within a well-defined ascending channel, reflecting a broader bullish structure. Current price action is facing a minor resistance near 1.1421, which is the top of the short-term range and also a key trendline rejection zone. A clean breakout above this area could expose the monthly resistance near 1.1557.
However, if OANDA:EURUSD EUR/USD fails to breach this level initially, a pullback toward 1.1366 (channel base support) is possible before bulls regain control. The bullish setup remains valid as long as price holds above this support zone.
Traders should monitor the ECB press conference for signals on whether the central bank may pause further easing later this year.
Resistance : 1.1421 , 1.1557
Support : 1.1366 , 1.1250

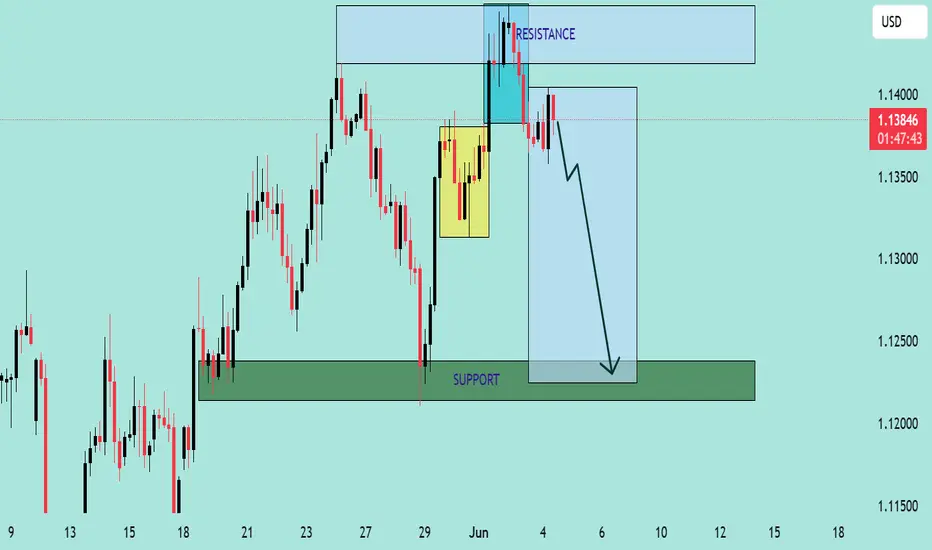
EUR/USD Bearish Reversal Setup Analysis EUR/USD Bearish Reversal Setup Analysis 🧠💼
The chart presents a clear bearish outlook on EUR/USD, with well-defined resistance and support zones, along with a projected short-term price trajectory. Here's a professional breakdown:
🔍 Key Technical Highlights
🔵 Resistance Zone (~1.1400 - 1.1430)
Price recently tested this resistance area and formed multiple wicks, signaling strong seller presence.
A bullish liquidity grab is evident in the highlighted cyan box, suggesting a fake breakout before reversal.
🟡 Supply Zone / Order Block
The yellow box marks a previous consolidation area (potential order block), which was revisited and rejected — reinforcing bearish intent.
🔽 Current Price Action
Price is trading around 1.1378, having broken structure and failed to maintain momentum above the resistance.
Sharp rejections and bearish engulfing candles imply strong selling pressure.
🟢 Support Zone (~1.1230 - 1.1260)
This is a previous demand area where price rallied strongly.
The large blue projection box and arrow suggest a bearish continuation targeting this support region.
📉 Bias: Bearish
Structure: Lower highs forming after liquidity grab.
Price Action: Bearish engulfing after resistance rejection.
Market Sentiment: Sellers appear in control after failing bullish breakout attempt.
🎯 Trade Idea
Entry: After confirmed rejection from resistance (~1.1370–1.1385)
TP: Around 1.1240 (support zone)
SL: Above recent highs (~1.1420)
Risk/Reward: Favorable R:R as the setup targets a large swing down.
EURUSD Trade Setup: Heres My Trade Plan!📈 EUR/USD Trade Outlook: Bullish Trend in Focus 🇪🇺💵
I'm currently watching EUR/USD, and it’s holding a strong bullish trend — with clear higher highs and higher lows across the board 🔁. On the 4-hour timeframe, price has pulled back into equilibrium, and I’m eyeing a potential buy opportunity if the structure continues to hold 🛒.
📚 Looking at historical price action, this setup has played out reliably in the past. That said, it's important to acknowledge that deeper pullbacks can occur — often sweeping liquidity below previous lows before resuming the trend 💧.
⚠️ This is a real risk, so consider conservative position sizing and always manage your risk appropriately.
💬 Drop a comment below if you're watching this setup too — I’d love to hear your take!
❗️Disclaimer: This is not financial advice. The content shared is for educational and informational purposes only. Please do your own analysis and trade responsibly.

Euro Pulls Back – Eyes on ECB and Tariff TurmoilCMCMARKETS:EURUSD FX:EURUSD EUR/USD pulled back from a six-week high of 1.1454 to trade near 1.1379, down 0.52% on Tuesday, as strong U.S. labor market data and revived trade tensions lifted the dollar. April JOLTS job openings rose to 7.39M, beating expectations, signaling a resilient U.S. economy despite a 3.7% drop in factory orders.
In parallel, Trump’s announcement to double tariffs on steel and aluminum has reignited trade war concerns. Markets are also watching for a potential Trump–Xi call later this week.
Meanwhile, the Euro lost ground after May HICP inflation in the Eurozone fell to 1.9%, below the ECB’s 2% target. With core inflation slowing as well, markets have priced in a 25 bps rate cut at Thursday’s ECB meeting.
Technically, OANDA:EURUSD EUR/USD is still trading within a rising channel but rejected key minor resistance zone just below the descending trendline. A confirmed breakout above this area could open the path toward monthly resistance near 1.1559. On the downside, Support Zone 1 (around 1.1375) must hold to maintain the bullish bias; further weakness may expose Support Zone 2 (around 1.1338)
Resistance : 1.1445 , 1.1559
Support : 1.1375 , 1.1338
