EURUSD BEARISH PRESSURE .?Technical Analysis:
Current Price Movement: The EUR/USD pair has recently dipped below the 1.1200 level, indicating a bearish trend.
Resistance and Support Levels: The resistance at 1.14600 remains a significant barrier, while the pair is approaching the support target of 1.09500.
Fundamental Factors:
US Dollar Strength: The US dollar has gained strength due to positive trade developments and robust employment data.
Eurozone Economic Outlook: The Euro faces challenges amid expectations of further rate cuts by the European Central Bank, contributing to its weakness against the dollar.
Conclusion:
Given the current technical indicators and fundamental factors, the EUR/USD pair is under bearish pressure. Traders should monitor key levels, with a focus on the support at 1.09500 and resistance at 1.14600, to inform their trading strategies
Eurusdlongsetup

EURUSD TechnicalsFalling wedge pattern on the EUR/USD 4-hour timeframe.
# Typically a bullish reversal or continuation pattern.
# Both support and resistance lines are sloping downward and converging.
# Often declines during the formation, which aligns with what’s visible here.
📈 Implications:
Bullish Bias: A breakout above the upper resistance trendline usually signals a reversal to the upside.
Confirmation: Wait for a breakout with volume to confirm the pattern. False breakouts can happen.
Target: The initial target after a breakout is often the height of the wedge projected upward from the breakout point.
RSI: Currently near oversold levels (~36), suggesting potential upward momentum.
✅ What to Watch For:
Breakout above the upper trendline with a bullish candle and increased volume.
A retest of the broken trendline (now support) for a more conservative entry.

#EURUSD: At Perfect Area to Swing Sell Worth 1300+ Pips! The FX:EURUSD price is currently showing strong sell momentum, indicating a potential strong bearish trend in the coming time. We’ve already taken two swing sell positions on EURUSD. There are three targets you can set according to your own plan and strategy.
The DXY index suggests further price growth in the coming weeks. Please ensure you manage your risk while trading. This is our concept only and does not guarantee the movements we’ve shown in our analysis. Therefore, please conduct your own analysis before taking any swing entry.
Good luck and trade safely!
Wishing you good luck and safe trading!
Thank you for your support! 😊
If you’d like to contribute, here are a few ways you can help us:
- Like our ideas
- Comment on our ideas
- Share our ideas
Team Setupsfx_
❤️🚀

EURUSD SHORT FORECAST Q2 W19 D9 Y25EURUSD SHORT FORECAST Q2 W19 D9 Y25
Professional Risk Managers👋
Welcome back to another FRGNT chart update📈
Diving into some Forex setups using predominantly higher time frame order blocks alongside confirmation breaks of structure.
Let’s see what price action is telling us today!
💡Here are some trade confluences📝
✅Weekly order block rejection
✅Weekly imbalance
✅Intraday 15' order blocks
✅Tokyo ranges to be filled
🔑 Remember, to participate in trading comes always with a degree of risk, therefore as professional risk managers it remains vital that we stick to our risk management plan as well as our trading strategies.
📈The rest, we leave to the balance of probabilities.
💡Fail to plan. Plan to fail.
🏆It has always been that simple.
❤️Good luck with your trading journey, I shall see you at the very top.
🎯Trade consistent, FRGNT X

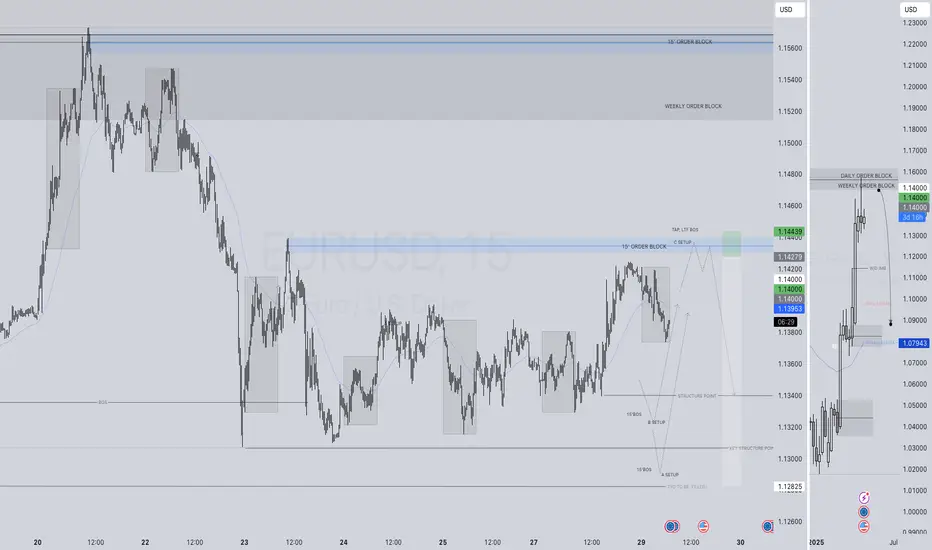
EURUSD SHORT FORECAST Q2 W19 D7 Y25EURUSD SHORT FORECAST Q2 W19 D7 Y25
Professional Risk Managers👋
Welcome back to another FRGNT chart update📈
Diving into some Forex setups using predominantly higher time frame order blocks alongside confirmation breaks of structure.
Let’s see what price action is telling us today!
💡Here are some trade confluences📝
✅Weekly order block rejection
✅Weekly imbalance
✅Intraday 15' order blocks
✅Tokyo ranges to be filled
🔑 Remember, to participate in trading comes always with a degree of risk, therefore as professional risk managers it remains vital that we stick to our risk management plan as well as our trading strategies.
📈The rest, we leave to the balance of probabilities.
💡Fail to plan. Plan to fail.
🏆It has always been that simple.
❤️Good luck with your trading journey, I shall see you at the very top.
🎯Trade consistent, FRGNT X

EURUSD LONG FORECAST Q2 W19 D7 Y25
EURUSD LONG FORECAST Q2 W19 D7 Y25
Professional Risk Managers👋
Welcome back to another FRGNT chart update📈
Diving into some Forex setups using predominantly higher time frame order blocks alongside confirmation breaks of structure.
Let’s see what price action is telling us today!
💡Here are some trade confluences📝
✅4 hour 50 EMA rejection
✅Intraday 15' order blocks
✅Tokyo ranges to be filled
🔑 Remember, to participate in trading comes always with a degree of risk, therefore as professional risk managers it remains vital that we stick to our risk management plan as well as our trading strategies.
📈The rest, we leave to the balance of probabilities.
💡Fail to plan. Plan to fail.
🏆It has always been that simple.
❤️Good luck with your trading journey, I shall see you at the very top.
🎯Trade consistent, FRGNT X

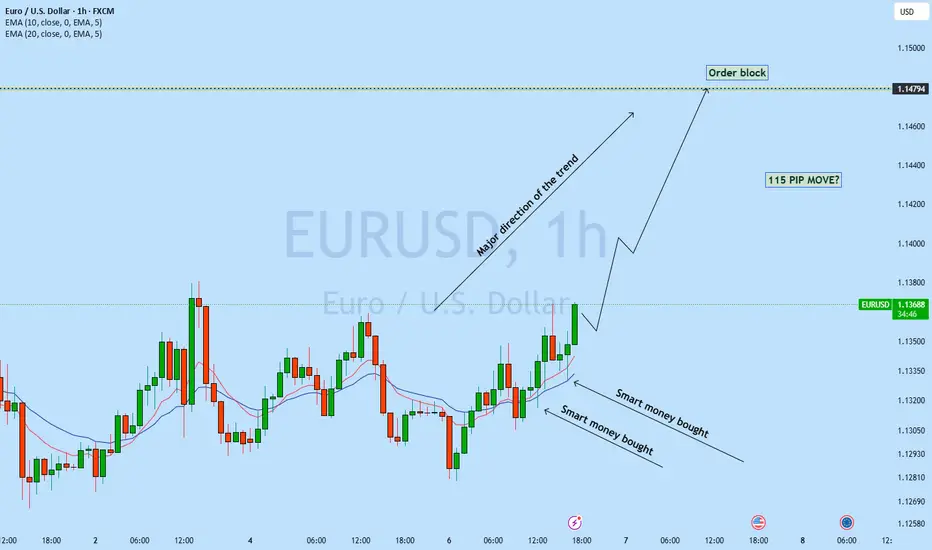
EURUSD is set to move up?EURUSD 1h back to back 2 candle has got rejected from the support level with long wick which is smart money bullish order flow showing potential move back to the resistance line. As Daily trend is bullish we may see EURUSD continue to bounce back to the resistance with newly develop uptrend.
A buy trade is high probable
EURUSDHello everyone!
I'd like to share an ideal **Buy opportunity** on the **EURUSD** pair with you. The trade is currently **active** on my side.
🔍 **Criteria:**
✔️ Timeframe: 15M
✔️ Risk-to-Reward Ratio: 1:1.17
✔️ Trade Direction: Buy
✔️ Entry Price: 1.13204
✔️ Take Profit: 1.13335
✔️ Stop Loss: 1.13092
🔔 **Disclaimer:** This is not financial advice. It's a trade I’m taking based on my own system, shared purely for educational purposes.
📌 If you're also interested in systematic and data-driven trading strategies:
💡 Don’t forget to follow the page and subscribe to stay updated on future analyses.

EURUSD LONG FORECAST Q2 W19 D6 Y25EURUSD LONG FORECAST Q2 W19 D6 Y25
Professional Risk Managers👋
Welcome back to another FRGNT chart update📈
Diving into some Forex setups using predominantly higher time frame order blocks alongside confirmation breaks of structure.
Let’s see what price action is telling us today!
💡Here are some trade confluences📝
✅4 hour order block rejection
✅Daily order block rejection
✅Intraday 15' order blocks
✅Tokyo ranges to be filled
🔑 Remember, to participate in trading comes always with a degree of risk, therefore as professional risk managers it remains vital that we stick to our risk management plan as well as our trading strategies.
📈The rest, we leave to the balance of probabilities.
💡Fail to plan. Plan to fail.
🏆It has always been that simple.
❤️Good luck with your trading journey, I shall see you at the very top.
🎯Trade consistent, FRGNT X

EURUSD SHORT FORECAST & TRADE EXECUTION Q2 W19 D5 Y25EURUSD SHORT FORECAST & TRADE EXECUTION Q2 W19 D5 Y25
Professional Risk Managers👋
Welcome back to another FRGNT chart update📈
Diving into some Forex setups using predominantly higher time frame order blocks alongside confirmation breaks of structure.
Let’s see what price action is telling us today!
💡Here are some trade confluences 📝
✅Weekly order block rejection
✅Daily order block rejection
✅Intraday 15' order blocks
✅Tokyo ranges to be filled
✅1' multiple breaks of structure short
✅1' bearish engulfing candle
✅Entry upon the rebalance of the 1' engulfing candle
✅Short position from a probable point of interest
🔑 Remember, to participate in trading comes always with a degree of risk, therefore as professional risk managers it remains vital that we stick to our risk management plan as well as our trading strategies.
📈The rest, we leave to the balance of probabilities.
💡Fail to plan. Plan to fail.
🏆It has always been that simple.
❤️Good luck with your trading journey, I shall see you at the very top.
🎯Trade consistent, FRGNT X

EUR/USD Bullish Reversal Setup – Demand Zone to Target 1.15646🔍 Current Price: 1.13414
📉 EMA (70): 1.13334
Price is slightly above the EMA → Bullish hint ✅
Key Zones & Levels
🟦 Demand Zone:
📍 1.12441 ➡️ 1.12985
Strong buying interest here!
Price bounced from this zone → 📈 Possible reversal
🔵 Entry Point: 1.12985
🛑 Stop Loss: 1.12441
🎯 Target: 1.15646
Trendline Watch
📉 Descending trendline is being tested/broken
🟠 If price holds above the trendline + EMA → CONFIRMATION for long entry ✅
Trade Setup
Buy Entry: 1.12985
TP: 1.15646 🎯
SL: 1.12441 🔻
Risk–Reward Ratio: ~ 1:4.8 ⭐️⭐️⭐️⭐️⭐️
Visual Flow:
🔵 Demand Zone
⬆️
Break EMA & Trendline
⬆️
🎯 Target Zone (1.15646)
Summary:
Looks like a sweet bullish setup from the demand zone!
If price stays above EMA and trendline → Go Long ✅

EURUSD SHORT FORECAST Q2 W19 D5 Y25EURUSD SHORT FORECAST Q2 W19 D5 Y25
Professional Risk Managers👋
Welcome back to another FRGNT chart update📈
Diving into some Forex setups using predominantly higher time frame order blocks alongside confirmation breaks of structure.
Let’s see what price action is telling us today!
💡Here are some trade confluences📝
✅Weekly order block rejection
✅Daily order block rejection
✅Intraday 15' order blocks
✅Tokyo ranges to be filled
🔑 Remember, to participate in trading comes always with a degree of risk, therefore as professional risk managers it remains vital that we stick to our risk management plan as well as our trading strategies.
📈The rest, we leave to the balance of probabilities.
💡Fail to plan. Plan to fail.
🏆It has always been that simple.
❤️Good luck with your trading journey, I shall see you at the very top.
🎯Trade consistent, FRGNT X

EUR/USD – Bearish Rejection from FVG🔻 EUR/USD – Bearish Rejection from FVG
Price broke market structure to the downside and is now retesting the FVG (1.13195–1.13088). If it holds, we expect rejection and continuation lower to 1.12655.
🎯 Target: 1.12655
🛑 SL: Above 1.13300
🔁 RR ≈ 1:2.5
Confluence with rising DXY adds strength to the bearish bias.

EURUSD UPDATESFX:EURUSD since this new idea are not your typical trades.
I expect the 2021 highs liquidity would be the target on this Run.
Build up method is like a re-accumulation phase then expansion, or it might go lower a bit.
This idea are on higher time frame, base on the 2021 highs liquidity pool.
THis is not a financial advice.
Follow for more swing trades.
Oh hello, Got funded on 5 er s. now. see my X.
slowly but surely trades, trade only small lots if you're a swing trader.
Pewwww

CAD JPY Entry Setup 1 hour timeframe CAD JPY Entry Setup
Bearish break and retest
Candlestick confirmation: Doji and clow below
Risk to Reward: 1:3

EURUSD Analysis todayHello traders, this is a complete multiple timeframe analysis of this pair. We see could find significant trading opportunities as per analysis upon price action confirmation we may take this trade. Smash the like button if you find value in this analysis and drop a comment if you have any questions or let me know which pair to cover in my next analysis.

This is a 4H chart of EUR/USD with multiple SMC annotations.1. Chart Reading According to SMC
Structure Analysis:
• Major BOS: Confirmed bullish structure around April 10 after the rally from FVG.
• Minor BOS & OBs: Price formed lower highs and lower lows near the 1.1450–1.1500 zone.
• Major CHoCH (Change of Character): Marked clearly around the last day low, confirming shift
to bearish structure.
• Liquidity Sweeps: Price swept the daily low and reacted — indicating smart money
accumulation at a key level.
Key SMC Zones:
• OB (Bearish): 1.1380–1.1430 zone — price likely to reject here.
• OB (Bullish): ~1.1265–1.1300 (reacted twice).
• FVG: Older demand imbalance marked earlier in the rally (around 1.0940–1.1000).
⸻
2. Marked Points in Chart
• Major BoS / CHoCH: Structural shifts defining directional bias.
• D1 TP (1.1300): A take-profit level around the midpoint of a larger daily leg.
• Last Day High / Low: Defined for internal liquidity targeting.
• OBs & Liquidity Zones: Precisely mapped for institutional activity clues.
⸻
3. Swing High & Low of the Day
• Swing High: 1.13420 (Last day high zone).
• Swing Low: 1.12652 (Last day low, also tapped for liquidity sweep).
These are intraday reference points for short-term setups.
⸻
4. Trade Direction
• Current HTF Bias: Bearish (post major CHoCH & OB rejections).
• However, price is currently reacting from a demand zone near 1.1265.
• Short-Term Direction: Bullish retracement toward 1.1340–1.1380, possibly to mitigate OB or
FVG.
⸻
5. Best Risk-Reward Setup
Setup: Buy the retracement from demand (reactive long) .
• Entry: 1.1270–1.1285 (OB demand + liquidity sweep)
• SL: Below 1.1260
• TP1: 1.1340 (last day high)
• TP2: 1.1380 (upper OB/fill FVG)
• RRR:
• TP1: ~1:3
• TP2: ~1:5
OR
Setup: Wait for price to reach OB at 1.1380, then go short.
• Entry: 1.1380–1.1400
• SL: 1.1430 (above OB)
• TP1: 1.1300 (internal structure)
• TP2: 1.1265 (retest demand)
• RRR: ~1:4
⸻
6. Trade Setups for Multiple Timeframes
5-Minute Setup (Refined Entry within OB):
• Look for CHoCH or internal FVG near 1.1270–1.1285 (bullish confirmation).
• Entry after candle body closes above last bearish candle.
• SL: Below 1.1260
• TP: 1.1340 (intraday high).
1H Setup:
• Wait for price to retrace and form FVG or CHoCH inside 1.1265–1.1280.
• Enter long on bullish engulfing/OB mitigation.
• TP: 1.1340–1.1380
• SL: Below OB.
4H Setup:
• Trend is bearish, but bullish pullback expected.
• Either take the long into OB or wait to short at 1.1380.
⸻
7. CRT Model Evaluation
• C – Context: Market just made a major CHoCH, but reacted from a demand OB with a liquidity
sweep.
• R – Retracement: Price is retracing into premium zones — near 50% of the daily range.
• T – Trend Continuation: Expect bearish continuation from the 1.1380 zone, unless price breaks
structure.
⸻
Conclusion
• Short-Term Bias: Bullish retracement toward 1.1340–1.1380.
• Swing Bias: Bearish from OB rejections and structural breaks.
• Best Setup Now: Long from 1.1270–1.1280 → TP 1.1340–1.1380.
• Later Opportunity: Short from 1.1380 → TP back toward 1.1265.

EURUSD SELL (DOWNTREND) H4 SHORT LOOKEUR/USD Market Analysis
Trend: Bearish
Pattern: Strong downward momentum observed after recent highs around 1.1570
Sell Entry Zone: Confirmed with bearish momentum
Target Levels:
1st Target: 1.11000 – Key psychological and technical level
2nd Target: 1.09100 – Near the 55-day SMA, strong historical support
Final Target: 1.07500 – Close to 200-day SMA and March lows
Stop Loss: 1.15500 – Just below the recent high (1.1570), to limit upside risk.

EURUSD LONG FORECAST Q2 W18 D1 Y25EURUSD LONG FORECAST Q2 W18 D1 Y25
Professional Risk Managers👋
Welcome back to another FRGNT chart update📈
Diving into some Forex setups using predominantly higher time frame order blocks alongside confirmation breaks of structure.
Let’s see what price action is telling us today!
💡Here are some trade confluences📝
✅Weekly order block rejection
✅4 hour bullish order block
✅Intraday 15' order blocks
✅Tokyo ranges to be filled
🔑 Remember, to participate in trading comes always with a degree of risk, therefore as professional risk managers it remains vital that we stick to our risk management plan as well as our trading strategies.
📈The rest, we leave to the balance of probabilities.
💡Fail to plan. Plan to fail.
🏆It has always been that simple.
❤️Good luck with your trading journey, I shall see you at the very top.
🎯Trade consistent, FRGNT X

EURUSD SHORT FORECAST Q2 W18 D29 Y25
EURUSD SHORT FORECAST Q2 W18 D29 Y25
Professional Risk Managers👋
Welcome back to another FRGNT chart update📈
Diving into some Forex setups using predominantly higher time frame order blocks alongside confirmation breaks of structure.
Let’s see what price action is telling us today!
💡Here are some trade confluences📝
✅Weekly order block rejection
✅Daily order block rejection
✅Intraday 15' order block
✅Tokyo ranges to be filled
🔑 Remember, to participate in trading comes always with a degree of risk, therefore as professional risk managers it remains vital that we stick to our risk management plan as well as our trading strategies.
📈The rest, we leave to the balance of probabilities.
💡Fail to plan. Plan to fail.
🏆It has always been that simple.
❤️Good luck with your trading journey, I shall see you at the very top.
🎯Trade consistent, FRGNT X
SMC Precision Short on EURUSD | SMT + Liquidity Grab = Clean Set📉 EURUSD 15M | Smart Money Concept (SMC) Trade Idea
🔍 Market Structure & Bias:
- High Timeframe POI (1H): Price tapped into a 1H Supply Zone, indicating potential short setups aligning with HTF bias.
- Break of Structure (BOS):Clean BOS to the downside confirms market intent shifting bearish.
🧠 Smart Money Logic :
- Liquidity Grab: Price swept liquidity above the equal highs and immediately rejected the 1H supply zone.
- Refinement: On the 15M, an entry block (OB) formed right after the SMT
- Mitigation: Price mitigated a lower timeframe demand and then gave an impulsive move down confirming intent.
- Entry: Entered short at the mitigation of the refined 15M supply zone.
- Stop Loss: Above the recent high (liquidity sweep).
- Target:
TP1:At the internal liquidity low (marked green @ 1.13152).
TP2:Final target at external liquidity below swing low @ 1.12637
Trade Details :
- 📍 Entry: 1.1372
- 🛑 Stop Loss: 1.1391
- 🎯 Take Profits:
TP1: 1.13152
TP2: 1.12637
Thanks for your time..

EURUSD Analysis todayHello traders, this is a complete multiple timeframe analysis of this pair. We see could find significant trading opportunities as per analysis upon price action confirmation we may take this trade. Smash the like button if you find value in this analysis and drop a comment if you have any questions or let me know which pair to cover in my next analysis.

EURUSD SHORT FORECAST Q2 W17 D23 Y25EURUSD SHORT FORECAST Q2 W17 D23 Y25
Professional Risk Managers👋
Welcome back to another FRGNT chart update📈
Diving into some Forex setups using predominantly higher time frame order blocks alongside confirmation breaks of structure.
Let’s see what price action is telling us today!
Trade confluences
- Weekly order block rejection
- Daily bearish close
- Intraday breaks of structure
- 15’ order block created
- Tokyo ranges to be filled
🔑 Remember, to participate in trading comes always with a degree of risk, therefore as professional risk managers it remains vital that we stick to our risk management plan as well as our trading strategies.
📈The rest, we leave to the balance of probabilities.
💡Fail to plan. Plan to fail.
🏆It has always been that simple.
❤️Good luck with your trading journey, I shall see you at the very top.
🎯Trade consistent, FRGNT X
