EUR/USD "The Fiber" Forex Market Heist Plan on Bearish🌟Hi! Hola! Ola! Bonjour! Hallo!🌟
Dear Money Makers & Robbers, 🤑 💰
Based on 🔥Thief Trading style technical and fundamental analysis🔥, here is our master plan to heist the EUR/USD "The Fiber" Forex market. Please adhere to the strategy I've outlined in the chart, which emphasizes short entry. Our aim is the high-risk Green Zone. Risky level, oversold market, consolidation, trend reversal, trap at the level where traders and bullish robbers are stronger. 👀 So Be wealthy and safe trade.💪🏆🎉
Entry 📉 : You can enter a Bearish trade at any point.
however I advise placing sell limit orders within a 15 or 30 minute timeframe. Entry from the most recent or closest high level should be in retest.
Stop Loss 🛑: Using the 1h period, the recent / nearest high level.
Goal 🎯: 1.01200 (OR) Before escape in the bank
Scalpers, take note : only scalp on the Short side. If you have a lot of money, you can go straight away; if not, you can join swing traders and carry out the robbery plan. Use trailing SL to safeguard your money 💰.
Warning⚠️ : Our heist strategy is incompatible with Fundamental Analysis news 📰 🗞️. We'll wreck our plan by smashing the Stop Loss 🚫🚏. Avoid entering the market right after the news release.
Fundamental Outlook 📰🗞️
Based on the fundamental analysis, the EUR/USD is expected to move in a bearish direction. Here are some key factors that support this prediction:
Interest Rate Divergence: The European Central Bank (ECB) is expected to maintain its dovish stance, while the US Federal Reserve is expected to maintain its hawkish stance. This interest rate divergence is expected to support the US dollar and weigh on the euro.
US Economic Data: The upcoming US economic data, including the Non-Farm Payroll and GDP growth rate, is expected to be strong, which could boost the US dollar and weigh on the euro.
European Economic Data: The upcoming European economic data, including the GDP growth rate and inflation rate, is expected to be weak, which could weigh on the euro.
Trade Tensions: The ongoing trade tensions between the US and Europe could lead to a decline in the euro, as European companies are heavily reliant on exports to the US.
The upcoming events that could impact the EUR/USD include:
ECB Meeting: The ECB is expected to maintain its dovish stance, which could lead to a weaker euro.
US Federal Reserve Meeting: The US Federal Reserve is expected to maintain its hawkish stance, which could lead to a stronger US dollar.
US-Europe Trade Talks: The ongoing trade talks between the US and Europe could lead to a decline in the euro, as European companies are heavily reliant on exports to the US.
Overall, the fundamental analysis suggests that the EUR/USD is likely to move in a bearish direction.
Upcoming Fundamental Indicators:
ECB Interest Rate Decision: 0.0% (expected)
US Federal Reserve Interest Rate Decision: 2.0% (expected)
US Non-Farm Payroll: 200,000 (expected)
US GDP Growth Rate: 2.5% (expected)
Please note that this is a general analysis and not personalized investment advice. It's essential to consider your own risk tolerance and market analysis before making any investment decisions.
Take advantage of the target and get away 🎯 Swing Traders Please reserve the half amount of money and watch for the next dynamic level or order block breakout. Once it is resolved, we can go on to the next new target in our heist plan.
Keep in mind that these factors can change rapidly, and it's essential to stay up-to-date with market developments and adjust your analysis accordingly.
💖Supporting our robbery plan will enable us to effortlessly make and steal money 💰💵 Tell your friends, Colleagues and family to follow, like, and share. Boost the strength of our robbery team. Every day in this market make money with ease by using the Thief Trading Style.🏆💪🤝❤️🎉🚀
I'll see you soon with another heist plan, so stay tuned 🫂
Eurusdoutlook

EUR/USD "The Fibre" Forex Market Bullish Heist Plan🌟Hi! Hola! Ola! Bonjour! Hallo!🌟
Dear Money Makers & Robbers, 🤑 💰
Based on 🔥Thief Trading style technical and fundamental analysis🔥, here is our master plan to heist the EUR/USD "The Fibre" Forex market. Please adhere to the strategy I've outlined in the chart, which emphasizes long entry. Our aim is the high-risk Red Zone. Risky level, overbought market, consolidation, trend reversal, trap at the level where traders and bearish robbers are stronger. Be wealthy and safe trade.💪🏆🎉
Entry 📈 : Traders & Thieves with New Entry A bull trade can be initiated on the MA level breakout of 1.04400
Stop Loss 🛑: Using the 3H period, the recent / nearest low or high level.
Goal 🎯: 1.06000 (or) Escape Before the Target
Scalpers, take note 👀 : only scalp on the Long side. If you have a lot of money, you can go straight away; if not, you can join swing traders and carry out the robbery plan. Use trailing SL to safeguard your money 💰.
Fundamental Outlook 📰🗞️
Here are some neutral factors that could impact the EUR/USD pair:
EU-US Trade Talks: The ongoing trade talks between the EU and US could lead to a neutral outcome, with both sides agreeing to maintain current trade relationships without making significant changes.
European Central Bank (ECB) Forward Guidance: The ECB's forward guidance on interest rates and monetary policy could remain unchanged, providing no clear direction for the EUR/USD pair.
US Federal Reserve (Fed) Balance Sheet: The Fed's balance sheet reduction could continue at a steady pace, having a neutral impact on the US Dollar and the EUR/USD pair.
Eurozone Inflation: Eurozone inflation could remain stable, around 1.5%, which is close to the ECB's target, providing no clear direction for the EUR/USD pair.
US Economic Data: US economic data, such as GDP growth, could come in as expected, providing no surprises and having a neutral impact on the EUR/USD pair.
European Commission Economic Forecasts: The European Commission's economic forecasts could be revised slightly, but remain broadly in line with current expectations, providing no clear direction for the EUR/USD pair.
German Economic Data: German economic data, such as GDP growth and industrial production, could come in as expected, providing no surprises and having a neutral impact on the EUR/USD pair.
These neutral factors could help to stabilize the EUR/USD pair, reducing volatility and making it more challenging to predict the pair's direction.
Trading Alert⚠️ : News Releases and Position Management 📰 🗞️ 🚫🚏
As a reminder, news releases can have a significant impact on market prices and volatility. To minimize potential losses and protect your running positions,
we recommend the following:
Avoid taking new trades during news releases
Use trailing stop-loss orders to protect your running positions and lock in profits
Please note that this is a general analysis and not personalized investment advice. It's essential to consider your own risk tolerance and market analysis before making any investment decisions.
Keep in mind that these factors can change rapidly, and it's essential to stay up-to-date with market developments and adjust your analysis accordingly.
💖Supporting our robbery plan will enable us to effortlessly make and steal money 💰💵 Tell your friends, Colleagues and family to follow, like, and share. Boost the strength of our robbery team. Every day in this market make money with ease by using the Thief Trading Style.🏆💪🤝❤️🎉🚀
I'll see you soon with another heist plan, so stay tuned 🫂

EURUSDWe are looking for EURUSD to go down first and then give us a reaction for upside from 1.02 level

EURUSD Sellers have an advantage towards Trump's Inauguration After carefully following up on US and EURO Zone data. We can positively say that the data has been favorable to the dollar. As at now the Fed has reduced the number of expected cuts this yr while ECB maintains a dovish tone promising a series of cuts even if they are not to be consistent. Also we have seen the NFP Data high and unemployment declining. If Trump maintains his stand on tariffs we should expect the EURO to be hurt.

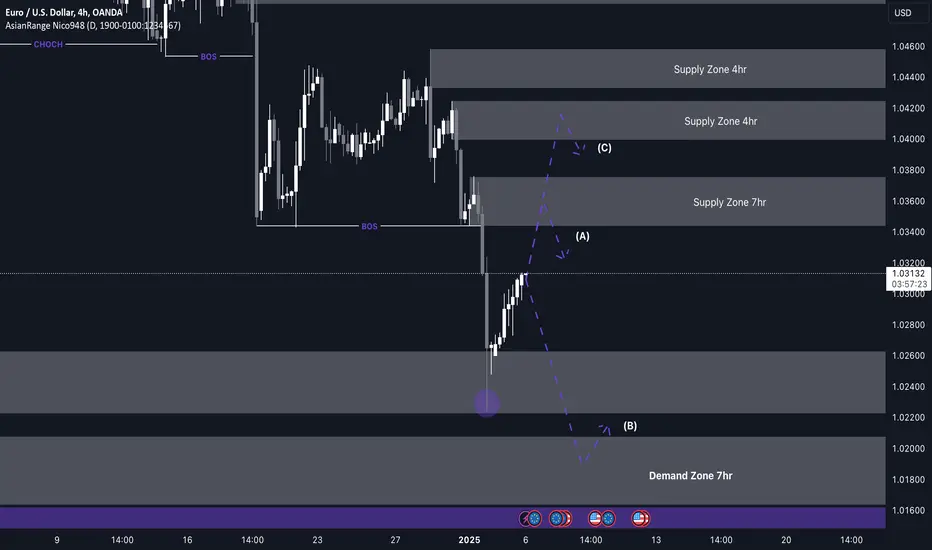
EUR/USD Longs from 1.02000 back upWhile the overall trend for EUR/USD (EU) remains bearish, the strong reaction from my marked demand zone last week has caused a Change of Character (CHOCH) to the upside. This indicates a temporary shift in momentum, and I plan to capitalize on this bullish move.
My strategy is to wait for a retracement back into the 8-hour demand zone below. Once the price taps into this zone while sweeping liquidity, I’ll look for lower time frame confirmations to enter buy positions.
However, if the price continues to move higher without retracing, I’ll consider potential sell opportunities from the key level at 1.04000.
Confluences for EU Buys:
- A CHOCH to the upside has temporarily shifted the trend.
- Significant liquidity to the upside in the form of equal highs and an imbalance that needs to be filled.
- A clean, unmitigated 8-hour demand zone remains below.
- The DXY aligns with this counter-trend idea.
- A pool of liquidity below is likely to be swept before price enters the point of interest (POI).
Note: If the price breaks structure further to the upside, I’ll identify a new demand zone. For now, my primary focus remains on the 8-hour demand zone below for buys and the 6-hour supply zone above for potential sells.

FX & ETF Bullish Market ideas for EUR/USD, GBP/USD & SOXLIn this video I share my bullish ideas on two currency pairs (EUR/USD & GBP/USD) along with ETF (SOXL) and reasons for looking at the bullish side.
The markets look a bit flat at the moment however I'm keeping an eye on how we close this week and make preparations going into next week which could spark some volatility as Donald Trump takes office.
Good Luck. Trade Safe.

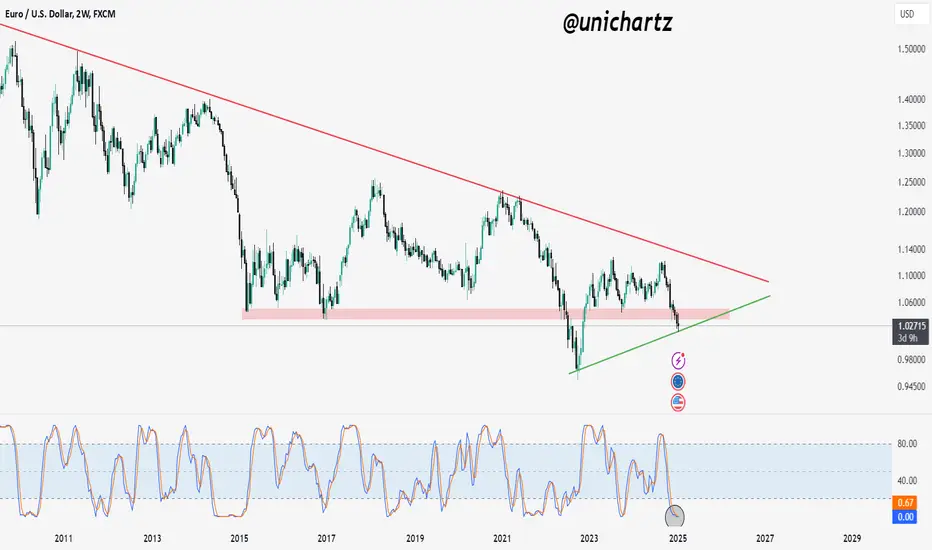
Major Breakdown or Reversal? EUR/USD 2-Week AnalysisEUR/USD analysis on the 2-week timeframe (14 days), the chart clearly shows that the price has faced multiple rejections from the upper resistance line, marked in red. Additionally, the price has broken below the strong 2-week support zone and is now trading just above the lower supportive trendline, indicated by the green line.
The Stochastic RSI is signaling a potential reversal, suggesting that the current price action may retest the breakout levels before making a decisive move. This could either lead to a rebound from the support or further bearish continuation if the trendline breaks.
EUR/USD Short from 1.03000 (Supply Zone 6hr)My analysis for EUR/USD (EU) this week aligns with my view on other pairs, as the Dollar continues to strengthen. The bearish trend remains strong, and I plan to stay aligned with this pro-trend movement.
The price has broken structure to the downside and left a clean 6-hour supply zone that is yet to be mitigated. Once the price retraces to this supply zone, I’ll be looking for potential sell opportunities. I’ll wait for a redistribution pattern to confirm my entry before taking shorts. If the price continues to drop without retracing, I’ll monitor for a closer supply zone to form and adjust my setup accordingly.
Confluences for EU Sells:
- The price remains strongly bearish on higher time frames.
- The DXY is bullish, supporting the bearish trend for EU.
- A clean supply zone caused a Break of Structure (BOS) to the downside.
- The market is consistently forming lower lows and lower highs.
- A significant imbalance below still needs to be filled.
Note: If the price reaches the 7-hour demand zone below or the imbalance, I anticipate a potential bullish reaction, possibly leading to a retracement.

EURUSDWe are looking for pullback to start for EURUSD this week and then one more drop to sweep the low.

Weekly Insights: Euro/Dollar and Gold Analysis
Hello, fellow traders! I hope you’re all doing well. Today, we want to share some insights and observations from the past week that might help you navigate the markets.
Euro/Dollar: We’re seeing some outflows in put options with a strike price of $1.05, which are already in the money and have intrinsic value. Additionally, there’s been a resale of put options at the $1.02 strike. This suggests a sentiment shift—at the very least, we might be witnessing a halt in the downward movement. So, keep an eye on this pair, it could be setting up for a bounce.
Gold: On the gold front, there’s been aggressive buying of call spreads with targets around $2950-$3000. However, this seems a bit too straightforward and obvious—buying after a price increase at high levels doesn’t scream insider trading or strong sentiment. It feels more like a speculative play, and honestly, it’s pretty apparent. The sentiment here is Neutral.

EURUSD Will be in bearish direction after Breaking ChannelHello Traders
In This Chart EURUSD HOURLY Forex Forecast By FOREX PLANET
today EURUSD analysis 👆
🟢This Chart includes_ (EURUSD market update)
🟢What is The Next Opportunity on EURUSD Market
🟢how to Enter to the Valid Entry With Assurance Profit
This CHART is For Trader's that Want to Improve Their Technical Analysis Skills and Their Trading By Understanding How To Analyze The Market Using Multiple Timeframes and Understanding The Bigger Picture on the Charts

Short Eurusd - Targeting 1.02211Eurusd has been making continuous strides further down in price. The recent pullback to 1.04500 was rejected and indicating for me more movement to the downside, there was divergence of the RSI & MFI on the 4hr at that rejection level of price. If price continues to slide, I'll be looking to target a price of 1.02211. I'm currently in a short position at 1.04077, a nice 187 pips I would be looking to grab if price hits target. Patience is key! If you see anything different, feel free to share!

EURUSD; FURTHER DOWNSIDE EXPECTEDEURUSD has broken the October 2023 low of 1.045. On the monthly chart, price is seeking to correct imbalance by pushing lower towards 1.01 price handle.
On the daily chart, we have a new low indicating bearish market structure. This bearish trend could set the tone for Q1, 2025.
Fed Minutes of December, 2024 further reinforce our expectations of a bearish EURUSD. As we await the first NFP in 2025, we are likely to see further weakening.

EURUSD: USD strong dominance will push down the price 1.0?Dear Traders,
Hope you are doing great, this month can be the last month of usd dominating the market. As the new elect president will take the charge it is expected to see volatility within the market. We can see price going below 1.0 so taking appropriate selling entry can become beneficial. good luck

EURUSD H4 FORECASTMarket breaks through Supply Zone!
Next stop: Demand Zone
ENTRY POINT: Demand Zone
DECISION POINT (TARGET):
Stay tuned for updates!

EUR USD Trade Setup 1 hour timeframe EUR USD Entry Setup 1 hour timeframe
On the 1 hour timeframe EUR USD has formed a supply level + a Double Top pattern at the supply level, now we wait for candlestick pattern for entry confirmation.

EURUSDEURUSD ( Euro / U.S Dollar )
Completed " 12345 " Impulsive Waves and " AB " Corrective Waves
Break of Structure
RSI - Divergence
Bearish Channel as an Corrective Pattern in Short Time Frame
Fibonacci Level - 127%

EUR/USD Faces Key Rejection – Bearish Pressure IntensifiesThe daily candle is facing rejection from the descending trendline, confirming strong bearish pressure.
The daily trend remains negative, aligning with the broader bearish sentiment on the weekly chart. For bulls to regain control, EUR/USD must break above the trendline and the 100 EMA at 1.0670.
Failure to do so could lead to further downside, especially if the 1.0300 support zone is breached.
DYOR, NFA

EURUSD DETAILED ANALYSISFollowing up on the guide that I posted on the weekly timeframe, internal price action on the 2H is bullish and we are currently at the OB which supports the first outcome.
Price could continue down without giving us a bearish choch which is a 50/50 trade IMO.
I would prefer to see a bearish choch first to increase its probability of holding.
If we break above the strong week high I will try to go long with the 2H internal aiming for short term targets until I see a bearish choch to target the weekly low.
The least probably but still possible outcome is for price to go above the December high if the 2H internal price action continues bullish.
We also have some very important news releases with Services PMI and NFP being the major ones so be sure to manage your risk this week like every week.

EURUSD DETAILED ANALYSISFollowing up on the guide that I posted on the weekly timeframe, internal price action on the 2H is bullish and we are currently at the OB which supports the first outcome.
Price could continue down without giving us a bearish choch which is a 50/50 trade IMO.
I would prefer to see a bearish choch first to increase its probability of holding.
If we break above the strong week high I will try to go long with the 2H internal aiming for short term targets until I see a bearish choch to target the weekly low. There are several areas where we could see a choch but keep in mind they could just give a reaction (no choch) to then just continue going higher.
The least probably but still possible outcome is for price to go above the December high if the 2H internal price action continues bullish.
We also have some very important news releases with Services PMI and NFP being the major ones so be sure to manage your risk this week like every week.

EurUsd SellWatch out for that zone for a quick dell. I'm looking to go short from that zone it looks promising

EurUsd could drop under parity in 2025 (0.95 target)Now that 2024 has concluded, EUR/USD has ended the year at its lowest point, marking a 7% decline from January and a 9% drop from its summer peak.
Most notably, the pair fell 6% since November—a significant move for such a typically stable currency pair, highlighting strong bearish momentum.
Technical Analysis
On the daily chart, the EUR/USD has shown a steady downtrend since its double top in August and September. Every meaningful reversal attempt was met with selling pressure, leading to a quick resumption of the downward trajectory.
The long-term (monthly) chart paints an even grimmer picture. The pair has been in a clear downtrend since its 2008 peak of 1.60, and it now sits precariously on critical support levels from the 2015 and 2017 lows.
Fundamental Outlook
The fundamentals align with the technical bearish trend. Diverging monetary policies and a bleak economic outlook for the EU add to the pair's struggles.
Conclusion:
Given these conditions, a drop below parity appears likely in the coming year. The most prudent trading strategy for EUR/USD is to sell into rallies and wait for further declines.
My target is 0.95, but, to be honest, I would not be very surprised by 0.9

EUR/USD Shorts from 1.03600 back down?My analysis for EUR/USD (EU) this week closely mirrors my expectations for GBP/USD (GU), as both pairs share similar points of interest (POIs). I’ll be focusing on capitalizing on the bearish trend evident in the formation of lower lows and lower highs.
With the recent break of structure to the downside, new supply zones have been created. I’ll be waiting for a retest of these zones to catch sell opportunities in alignment with the overall trend. Once the price sweeps liquidity and forms a clear schematic, I’ll enter sell trades targeting the demand zone below.
Confluences for EU Sells:
- The price has shown a Change of Character (CHOCH) and multiple Breaks of Structure (BOS) to the downside.
- A few unmitigated supply zones remain, which are likely to be tapped.
- Lots of liquidity below, alongside imbalances that need to be filled.
- The Dollar Index (DXY) is bullish, strengthening the bearish case for EU through correlation.
Note: If the price continues dropping, I’ll wait for a new supply zone to form or look for counter-trend buy opportunities from a valid demand zone.