EURUSDEURUSD still have more correction before the impulse to the upside starts.
Disclosure: We are part of Trade Nation's Influencer program and receive a monthly fee for using their TradingView charts in our analysis.
Eurusdoutlook

07/08/2025 - EURUSD - HEDGE SHORTHedge Short for FX:GBPUSD
COT Retailer still extended
We are on the higher timeframe weekly zone
Substructure is already confirmed bearish
EUR/USD Testing Support — Will Buyers Step In Again?Hi Everyone,
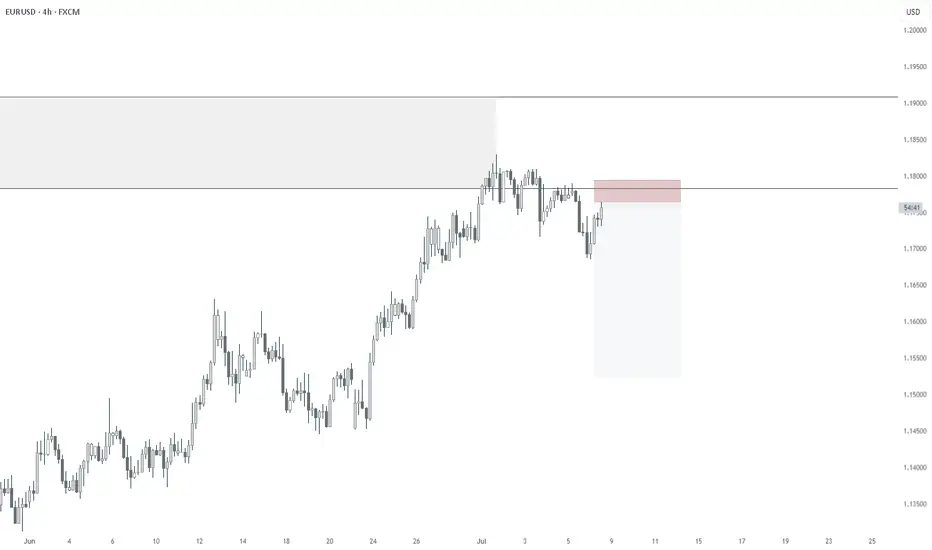
Since our last update, EUR/USD is currently testing the 1.16680 support level. We’re watching for buying interest to emerge above the key 1.16450 zone; if price can stabilise here, we could see a retest of the highlighted resistance area around 1.17450.
Our broader outlook remains unchanged: as long as price holds above 1.16450, we continue to look for the pair to build momentum for another move higher in the coming sessions. A decisive break above last week’s high could attract fresh buying interest, paving the way for a push towards the 1.19290 area and ultimately 1.20000.
We'll be watching closely to see if this recovery gains traction and whether buyers can sustain the move above resistance. The longer-term view remains bullish, provided price continues to respect the key support zone.
We’ll keep updating you through the week as the structure unfolds and share how we’re managing our active positions.
Thanks again for all the likes/boosts, comments and follows — we really appreciate the support!
All the best for the rest of the week. Trade safe.
BluetonaFX

EURUSD Bearish SMC Setup | Premium Supply Rejection + CHoCH +FVGPair: EUR/USD
Timeframe: 4H
Price reacted strongly from a Premium Selling Zone, forming multiple CHoCH (Change of Character) and BOS (Break of Structure) confirmations.
🔻 Red Zones indicate strong institutional selling
🔺 Weak High is now likely to remain protected
Market structure has shifted bearish, and price is targeting imbalances (IMB) and Fair Value Gaps (FVG) below.
⸻
✅ Entry: Taken from the premium supply rejection
🎯 Target 1: 1.16000 – Minor imbalance fill
🎯 Target 2: 1.15000 – Mid-level demand
🎯 Final Target: 1.14500 – Major liquidity zone
❌ Invalidation: Clean break above 1.18000
⸻
📉 Smart Money Confirmation Setup:
• Premium Supply
• CHoCH
• BOS
• FVG & IMB below
🔄 Missed the entry? Wait for a pullback into lower OB or supply zone.
#EURUSD #SmartMoney #SMC #CHoCH #BOS #FVG #OrderBlock #Forex #LiquiditySweep #SupplyDemand

EURUSD h4 update ⚠️ Current Outlook: Reversal Zone Hit
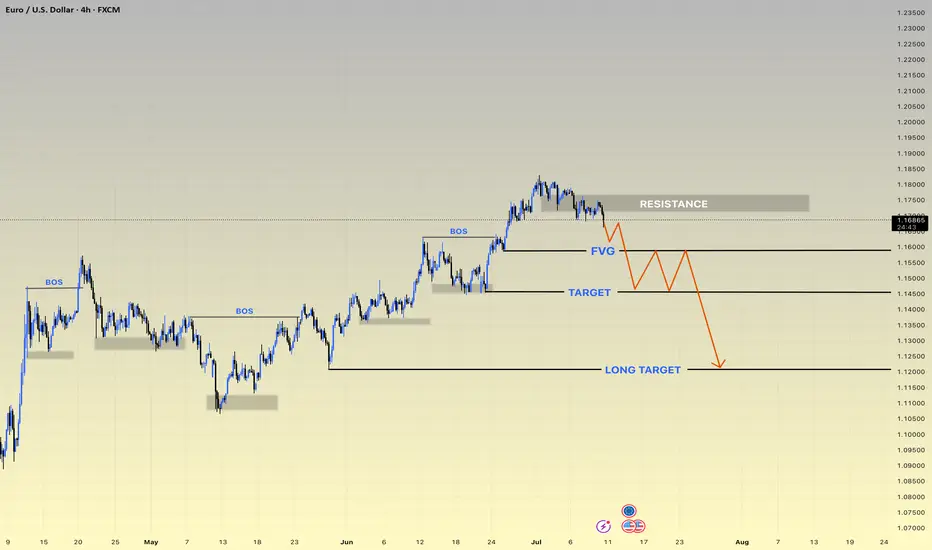
• Price tapped into the strong RESISTANCE zone (~1.1800), failing to break higher.
• Market structure BOS (Break of Structure) confirms bearish intent.
• FVG (Fair Value Gap) likely to act as a short-term liquidity trap.
📍 Disrupted Bearish Flow:
1. Price rejects resistance aggressively ✅
2. Pullback into FVG may trigger a liquidity hunt 🧲
3. Fake bounce → Smart Money re-entry expected 👀
4. Target levels:
• 🥅 TARGET: 1.1550 zone (first major support)
• 🎯 LONG TARGET: 1.1200 zone (high probability zone for HTF buyers)
🔁 Bear Trap Setup Possibility:
• After hitting the LONG TARGET, price could reverse sharply.
• Watch for accumulation signs and deviation below key levels.
⸻
🔥 Key Zones to Watch:
• 🔳 Resistance: 1.1790–1.1820
• 🟦 FVG Retest Zone: 1.1630–1.1660
• 📉 Target Zone: 1.1500–1.1550
• 🚨 Long-Term Demand Zone: 1.1180–1.123
NFP Bears gathering their troops? or will the Bulls stampede...The past 9 days have been quite interesting for the EUR/USD which has been relentless. Price has been rising like a helium balloon let loose at the park...
Bulls have clearly been in control, not only the past 9 days but since the beginning of the year with the exception of the strong pullback in April & May only to bounce for another 700 pip run.
I am totally USD bearish across the board as I have been mentioning in my analysis videos for the past few months but like all macro moves, we always have pullbacks along the way and that is why I have been shorting the EUR/USD back from 1.1500+ - 1.1700+
I've given this a lot of room to breathe, more than usual but considering the following technical setup, I'm willing to give the Bears some leeway and potentially show me they'll come through.
•Rising Broadening pattern (Where two trendlines start close together only to divergence and expand) - This is a bearish pattern.
•Negative Divergence on the MACD, Linear Regression & the RSI.
•Price has made a run to the yearly R3 pivot level. (Rare extension)
•Last daily candle is a hanging man candlestick (Reversal candle)
•Weekly chart has the EUR/USD at the upper band of a polynomial regression channel which calculates for price extremities in the market.
There are a few more setups as well but it's too much to describe here and I'd have to show it in a video (Which I plan to do over the weekend)
With all of that said... It could all fail lol but seriously speaking... You just can't ask for a better probabilistic setup so whatever happens during NFP... happens.
Aside from the technical aspect... I know yearly R2 around 1.1600 was a hotspot for shorts because divergence was at the early stages and taking a short there wouldn't have been a bad idea but we know institutions are in play as well, so above 1.1600 could have been a huge area to run stop losses and margin calls before a potential reversal.
250 pips would be enough to run a large pool of stops and liquidation.
IF price is going to reverse here during NFP, I believe late longs and breakout/pullback traders are going to try and buy at the trendline at 1.1660ish but it wont hold and trap them on the other side of the trade.
Under that, I can see us pulling back towards 1.1200ish...
If the Bears give up and price continues to climb... the original macro target may very well be under way which was 1.2000 - 1.2200 (Based on a Monthly and 3-Month chart analysis)
As of this writing the EUR/USD is pretty much completely flat which is expected before the NFP fireworks ahead of July 4th.
We'll see what happens tomorrow morning! buckle up!
As always, Good luck and Trade Safe! See you post NFP.

EURUSD Will Keep Growing!
HI,Traders !
#EURUSD is trading in an
Uptrend and the pair broke
The key horizontal level
Of 1.16370 and the breakout
Is confirmed so after a potential
Retest of the support cluster
Of the rising and horizontal
Support lines below we will
Be expecting a bullish continuation !
Comment and subscribe to help us grow !

EurUsd - This is the deadly breakout!EurUsd - FX:EURUSD - is about to fly:
(click chart above to see the in depth analysis👆🏻)
EurUsd has been rallying about +15% over the past couple of months. Additionally the breakout at the current resistance trendline is about to be confirmed. Subsequently EurUsd is setting up for another major move higher, which will be painful for all European traders.
Levels to watch: $1.23, $1.11
Keep your long term vision🙏🙏
Philip (BasicTrading)

EUR/USD Pulls Back from Yearly HighsThe EUR/USD pair has depreciated by nearly 0.5% over the past three trading sessions, favoring the U.S. dollar. At the moment, this appears to be the prevailing short-term trend, marking a new and steady bearish bias that has started to weigh on the euro. The current selling pressure has remained consistent, as the U.S. dollar shows renewed strength. The DXY index, which measures dollar performance, has been rising toward the 98 level, showing a solid recovery that could further intensify downward pressure on EUR/USD.
Sustained Uptrend
In recent weeks, the euro has shown consistent bullish momentum, maintaining a dominant uptrend on the long-term chart. So far, the recent bearish corrections haven’t been strong enough to break the structure, making it the key technical formation to watch in EUR/USD. However, the dollar’s current recovery appears to be gaining traction, and if that trend continues, it could put the existing uptrend at risk.
Technical Indicators
MACD: The MACD histogram is oscillating near the neutral zero line, suggesting that momentum from the moving averages remains balanced. If this continues, price action could consolidate into a more defined neutral range in upcoming sessions.
ADX: The ADX line remains above the 20 threshold but is starting to slope downward, which, if sustained, may lead to a more neutral price structure in the near term.
Key Levels to Watch:
1.18068 – Key resistance: This level marks the yearly high for EUR/USD. A breakout above this point could reinforce the current bullish trend.
1.15299 – Nearby support: A recent neutral zone. A breakdown here could trigger a stronger bearish bias and threaten the prevailing uptrend.
1.13177 – Distant support: Corresponds to a consolidation zone formed in May. If price drops to this level, it may activate a fresh and meaningful bearish trend.
Written by Julian Pineda, CFA – Market Analyst

EURUSD and GBPUSD Analysis todayHello traders, this is a complete multiple timeframe analysis of this pair. We see could find significant trading opportunities as per analysis upon price action confirmation we may take this trade. Smash the like button if you find value in this analysis and drop a comment if you have any questions or let me know which pair to cover in my next analysis.

EUR/USD Holds Above Key Support — Outlook IntactHi Everyone,
Price briefly dipped below the 1.16680 support, but our broader outlook remains unchanged as long as it continues to hold above the key 1.16450 level. Should buyers successfully defend the 1.16450 zone, we still see potential for the pair to stabilise and make another attempt higher in the coming sessions.
We’ll be monitoring price action closely to see if support continues to hold and whether momentum starts to build back to the upside.
We maintain the view that a decisive break above last week’s high could attract additional buyers, paving the way for a move towards the 1.19290 level and ultimately the 1.20000 level.
We’ll share further updates on the projected path for EUR/USD if price breaks above this key resistance.
The longer-term outlook remains bullish, with expectations for the rally to extend towards the 1.2000 level, provided the price holds above the key support at 1.10649.
We will continue to update you throughout the week with how we’re managing our active ideas and positions. Thanks again for all the likes/boosts, comments and follows — we appreciate the support!
All the best for a good end to the week. Trade safe.
BluetonaFX

EURUSD I Technical & Fundamental Forecast Welcome back! Let me know your thoughts in the comments!
** EURUSD Analysis - Listen to video!
We recommend that you keep this pair on your watchlist and enter when the entry criteria of your strategy is met.
Please support this idea with a LIKE and COMMENT if you find it useful and Click "Follow" on our profile if you'd like these trade ideas delivered straight to your email in the future.
Thanks for your continued support!Welcome back! Let me know your thoughts in the comments!

#EURUSD: Nothing to expect from DXY| View Changed Swing Trading|Hey there! So, we were previously thinking EURUSD was going to be bearish, but things have turned around and it’s looking bullish for now.
The extreme bearish pressure on USD has caused all the major USD pairs to be in a range. As the week goes on and we get the NFP data, the market will probably focus more on these economic indicators. So, it’s not surprising to see some market ranges during this time.
We’ll keep a close eye on the market, as there might be some manipulation going on this week.
We recommend waiting until Monday’s daily candle closes to see if the bullish trend is strong enough. Then, based on the price momentum, you can make your decisions.
We hope you have a great week and safe trading! If you like our work and analysis, please consider liking, commenting, and sharing our content.
Cheers,
Team Setupsfx
❤️🚀

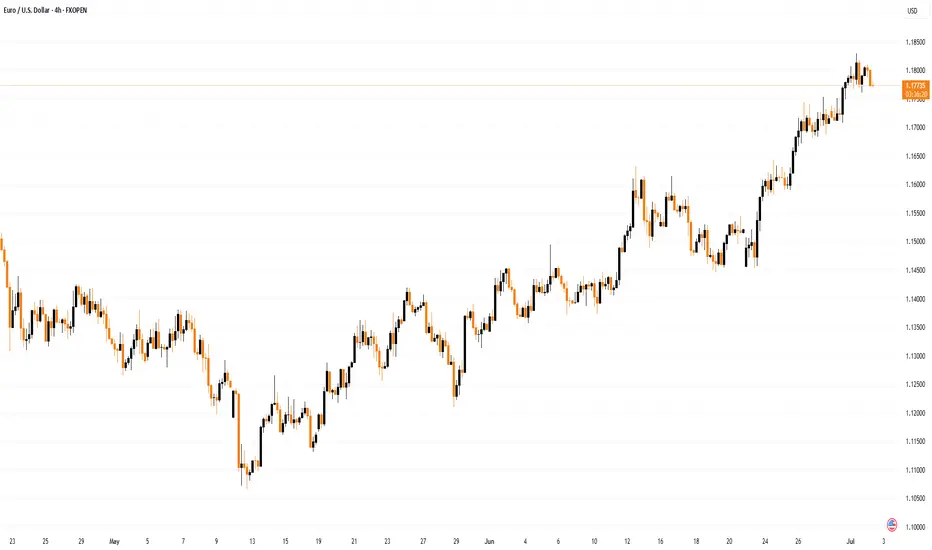
EUR/USD Analysis: US Dollar Strengthens at the Start of the WeekEUR/USD Analysis: US Dollar Strengthens at the Start of the Week
On 2 July, on the EUR/USD chart, we noted that the rally—during which the pair had gained more than 6% since mid-May—was under threat, citing several technical signals, including:
→ proximity of the price to the upper boundary of the ascending channel;
→ overbought conditions on the RSI indicator;
→ nearby resistance from the Fibonacci Extension levels, around 1.18500.
Trading at the start of the week points to renewed US dollar strength. This became particularly evident with the opening of the European session, which triggered a decline in EUR/USD to the 1.17500 area.
It is reasonable to assume that the dollar’s strength against the euro is linked to early-week positioning by traders, who are anticipating news regarding US trade agreements.
According to Reuters, the United States is close to finalising several trade deals in the coming days and is expected to notify 12 other countries today about higher tariffs.
EUR/USD Technical Chart Analysis
The ascending channel established last week remains in play, with the following developments:
→ a dashed midline within the upper half of the channel has been breached by bearish pressure (as indicated by the arrow);
→ a series of lower highs in recent sessions suggests the formation of a downward trajectory, within which the price could move towards the channel median—or potentially test its lower boundary.
P.S. In the longer term, analysts at Morgan Stanley maintain a bullish outlook, forecasting that EUR/USD could rise to 1.2700 by the end of 2027.
This article represents the opinion of the Companies operating under the FXOpen brand only. It is not to be construed as an offer, solicitation, or recommendation with respect to products and services provided by the Companies operating under the FXOpen brand, nor is it to be considered financial advice.

EUR/USD: UPDATEHello friends
Everything is clear on the chart for you, our probability is price growth until the specified areas.
In case of price decline, we have identified two support areas where you can buy.
Be sure to observe risk and capital management.
*Trade safely with us*

EUR/USD Rally Pauses Near 1.18000 – Higher Targets in SightHi Everyone,
Last week, price action delivered the 1.18000 level we had been calling for, and as expected, dynamic resistance around that area proved to be significant.
Looking ahead, we anticipate EUR/USD will continue to test the 1.18000 level this week while holding above the 1.16680 support zone. A strong break above last week’s high could attract further buyers, paving the way for a move towards the 1.19290 and ultimately the 1.20000 levels. We’ll share further updates on the projected path for EUR/USD if price breaks above this level.
The longer-term outlook remains bullish, with expectations for the rally to extend towards the 1.2000 level, provided the price holds above the key support at 1.10649.
We will continue to update you throughout the week with how we’re managing our active ideas and positions. Thanks again for all the likes/boosts, comments and follows — we appreciate the support!
All the best for a good end to the week. Trade safe.
BluetonaFX

July 7 - 1th: Sell The RIPs, Buy The DIPs! (PART 1)This is Part 1 of the FOREX futures outlook for the week of July 7 - 11th.
In this video, we will analyze the following FX markets:
USD Index, EUR, GBP, AUD, NZD, & CAD.
Last Friday was a bank holiday, so the price action is discounted. This Monday has no red folders on the calendar, so the environment is set for a day of misdirection. Be careful to take only trades that confirm your directional bias!
USD is still weak, and analyst have determined the FED will put off cutting rates until September. Tariffs wars may start up again July 9th. And Trumps Bill can add 3+ trillion to the debt.
None of this supports the USD!
Look to buy the dips xxx USD, and look to sell the rips vs USD xxx.
Enjoy!
May profits be upon you.
Leave any questions or comments in the comment section.
I appreciate any feedback from my viewers!
Like and/or subscribe if you want more accurate analysis.
Thank you so much!
Disclaimer:
I do not provide personal investment advice and I am not a qualified licensed investment advisor.
All information found here, including any ideas, opinions, views, predictions, forecasts, commentaries, suggestions, expressed or implied herein, are for informational, entertainment or educational purposes only and should not be construed as personal investment advice. While the information provided is believed to be accurate, it may include errors or inaccuracies.
I will not and cannot be held liable for any actions you take as a result of anything you read here.
Conduct your own due diligence, or consult a licensed financial advisor or broker before making any and all investment decisions. Any investments, trades, speculations, or decisions made on the basis of any information found on this channel, expressed or implied herein, are committed at your own risk, financial or otherwise.

EUR/USD breakout awaiting EUR/USD has not provided a clear structure over the past week or two. The pair appears to be in consolidation, building liquidity on both sides of the current range. At the moment, I’m waiting for a decisive breakout, ideally followed by distribution within the monthly supply zone, although that zone is still some distance away.
This week, my focus will be on whether a new supply zone forms, closer to current price. If price sweeps the nearby equal highs and then shows signs of reversal, this could give us a fresh supply area to work from. Alternatively, if price moves lower, I’ll be looking at the 8-hour demand zone around 1.16000 for a possible long setup.
Confluences for EUR/USD:
- Although price has been slightly bullish, the current consolidation phase suggests a potential reversal could be on the horizon.
- Liquidity is building on both sides of the range, making a reaction from the monthly supply zone increasingly probable.
- There’s significant downside liquidity still untapped, such as Asia session lows, which could serve as short-term targets.
- For clearer confirmation, we still need a decisive break in market structure to the downside.
P.S. If price sweeps the lower liquidity and moves into the 8-hour demand zone near 1.16000, I will be watching for accumulation to form and signs of bullish intent from there.

EURUSD Bullish Setup: Watching for a Break and Retest📈 Looking at EURUSD right now, we’re in a strong bullish structure 🔼 — but it’s clearly overextended 🚀
As we head into the end of the week, there’s still potential for more upside today ⬆️ — but ⚠️ be cautious, since Fridays often bring retracements as we move into the weekly close 🕒📉
🔍 I’m watching for a bullish opportunity if we get a break above the current equal highs, followed by a retest and failure to break back below 🧠📊
If that setup doesn’t materialize, we’ll simply step aside and abandon the idea 🚫
💬 Not financial advice — always trade at your own risk.

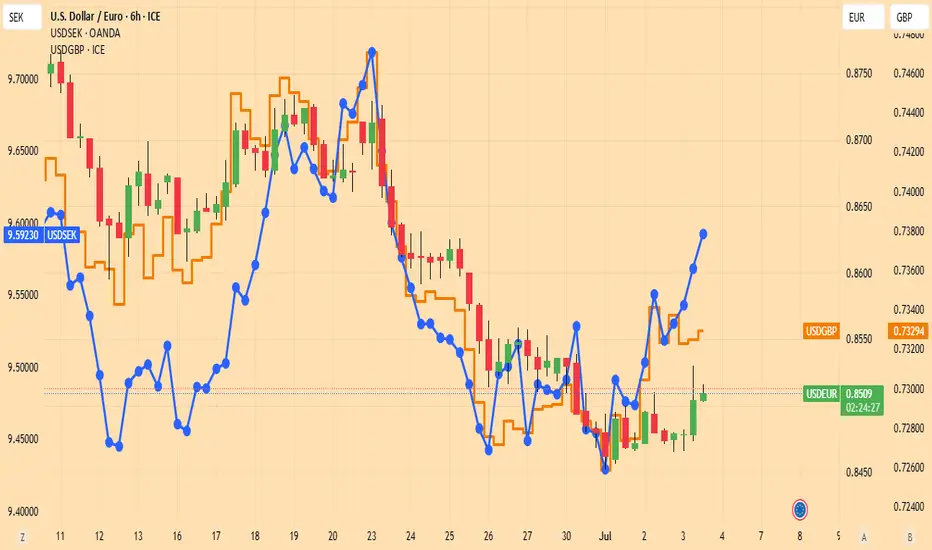
EURUSD should pull backLet us look at the comparative behavior of USDEUR, USDGBP and USDSEK.
Both USDSEK and USDGBP suggest that the Dollar has hit a through against European currencies.
The lines are creeping higher, so USDEUR is lagging.
Strategy : Sell EURUSD as long as USDSEK rises
EUR/USD Rallies on Broad Dollar WeaknessEUR/USD Rallies on Broad Dollar Weakness
EUR/USD started a fresh increase above the 1.1750 resistance.
Important Takeaways for EUR/USD Analysis Today
- The Euro started a decent increase from the 1.1600 zone against the US Dollar.
- There is a connecting bullish trend line forming with support near 1.1770 on the hourly chart of EUR/USD at FXOpen.
EUR/USD Technical Analysis
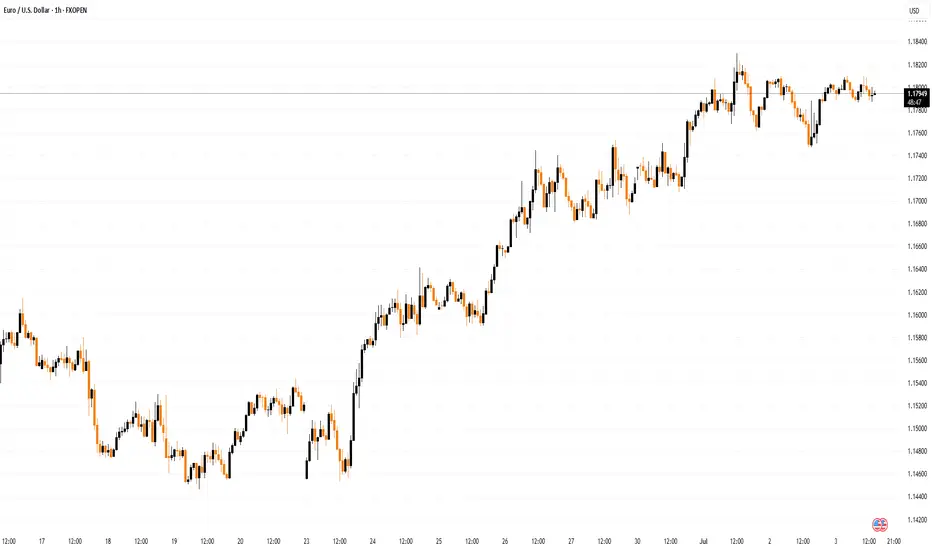
On the hourly chart of EUR/USD at FXOpen, the pair started a fresh increase from the 1.1600 zone. The Euro cleared the 1.1650 resistance to move into a bullish zone against the US Dollar.
The bulls pushed the pair above the 50-hour simple moving average and 1.1750. Finally, the pair tested the 1.1830 resistance. A high was formed near 1.1829 and the pair is now consolidating gains above the 23.6% Fib retracement level of the upward wave from the 1.1590 swing low to the 1.1830 high.
Immediate support on the downside is near a connecting bullish trend line at 1.1770. The next major support is the 1.1710 level. A downside break below the 1.1710 support could send the pair toward the 1.1680 level and the 61.8% Fib retracement level of the upward wave from the 1.1590 swing low to the 1.1830 high.
Any more losses might send the pair into a bearish zone toward 1.1645. Immediate resistance on the EUR/USD chart is near the 1.1830 zone. The first major resistance is near the 1.1850 level. An upside break above the 1.1850 level might send the pair toward the 1.1920 resistance.
The next major resistance is near the 1.1950 level. Any more gains might open the doors for a move toward the 1.2000 level.
This article represents the opinion of the Companies operating under the FXOpen brand only. It is not to be construed as an offer, solicitation, or recommendation with respect to products and services provided by the Companies operating under the FXOpen brand, nor is it to be considered financial advice.
EUR/USD Analysis: Rally May Be Under ThreatEUR/USD Analysis: Rally May Be Under Threat
The euro has appreciated by approximately 15% against the US dollar this year, as confidence in the United States continues to wane. As ECB Chief Economist Philip Lane noted in an interview at CNBC: “There is a degree of reorientation by global investors towards the euro.”
At the same time, officials at the European Central Bank have expressed concern that the rapid strengthening of the euro could undermine efforts to stabilise inflation at 2%. They warn that a move above $1.20 may pose risks for inflation and the competitiveness of export-oriented firms — an issue raised during the ECB’s ongoing ECB Forum on Central Banking in Portugal.
Could EUR/USD Reach the $1.20 Level?
From a technical analysis perspective, EUR/USD is showing bearish signals:
→ If the early April rally (coinciding with Trump’s announcement of new tariffs) is taken as the initial impulse wave A→B, and the May low is interpreted as the end of the B→C corrective move, then, according to Fibonacci Extensions, the pair has now risen to a key resistance zone around 1.1850 (as indicated by the arrow on the chart).
→ In addition, the RSI indicator signals strong overbought conditions, while the price is hovering near the upper boundary of the ascending channel — a level that typically acts as resistance.
Given these factors, we could assume that EUR/USD may be in a vulnerable position, potentially facing a short-term correction — possibly towards the lower boundary of the channel, reinforced by support at the 1.1620 level. However, this does not negate the longer-term bullish outlook for the euro amid prevailing fundamental conditions.
This article represents the opinion of the Companies operating under the FXOpen brand only. It is not to be construed as an offer, solicitation, or recommendation with respect to products and services provided by the Companies operating under the FXOpen brand, nor is it to be considered financial advice.
New rise in EURUSDYesterday, EURUSD continued its bullish movement, reaching 1,1807.
At current levels, all open buy positions should have their risk removed (e.g. stop loss at breakeven).
New buy entries are recommended only after a pullback with a favorable risk-reward setup.
Important news is expected later this week, which may lead to misleading price moves.
Reduce your risk and stay patient!
