Let the market pull back toward the marked FVG.🚨 EUR/USD Traders – Eyes on This Setup! 💹
The market has been respecting a trendline over the past few days, bouncing off support and climbing steadily. 🧗♂️ While doing so, it’s also been tapping into Fair Value Gaps (FVGs)—a clear sign of smart money interest. 📊
🔥 And guess what? We’ve just seen a breakout above the trendline resistance! This could be the beginning of a strong bullish move. BUT… patience is key! 🕰️
📉 Let the market pull back toward the marked FVG zone. If it does, that could give us a golden buy opportunity with high potential upside! 🚀
🧠 Always remember: Do Your Own Research (DYOR)
📛 Not Financial Advice – Trade Smart!
Eurusdprediction

EURUSD SHORT FORECAST Q2 W24 D12 Y25EURUSD SHORT FORECAST Q2 W24 D12 Y25
Professional Risk Managers👋
Welcome back to another FRGNT chart update📈
Diving into some Forex setups using predominantly higher time frame order blocks alongside confirmation breaks of structure.
Let’s see what price action is telling us today!
💡Here are some trade confluences📝
✅Weekly order block
✅15' order block
✅4 hour order block
✅Tokyo ranges to be filled
🔑 Remember, to participate in trading comes always with a degree of risk, therefore as professional risk managers it remains vital that we stick to our risk management plan as well as our trading strategies.
📈The rest, we leave to the balance of probabilities.
💡Fail to plan. Plan to fail.
🏆It has always been that simple.
❤️Good luck with your trading journey, I shall see you at the very top.
🎯Trade consistent, FRGNT X

EURUSD(20250612) Today's AnalysisMarket news:
① The EU hopes that the trade negotiations will be extended beyond the suspension period set by Trump. ② Bessant: As long as "sincerity" is shown in the negotiations, the Trump administration is willing to extend the current 90-day tariff suspension period beyond July 9. ③ Trump will hold multiple bilateral talks during the G7 summit. ④ The total customs revenue of the United States in May reached a record high of US$23 billion, an increase of nearly four times year-on-year. ⑤ Lutnick: One deal after another will be reached.
Technical analysis:
Today's buying and selling boundaries:
1.1463
Support and resistance levels:
1.1556
1.1521
1.1499
1.1427
1.1404
1.1369
Trading strategy:
If the price breaks through 1.1499, consider buying in, and the first target price is 1.1521
If the price breaks through 1.1463, consider selling in, and the first target price is 1.1427

EURUSD - TIME TO SHORT Team, last time we have successfully SHORT the EURUSD and now we are back on it again
This time we have better short position
NOTE: Last few days we have been killing the UK100/FTSE100 with such great opportunity.
Please follow the PRICE target accordingly to the CHART
Target 1 1.147200 to 1.4650
Target 2 at 1.1455-1.1450
Once it reach the 1st Target take 50% profit
Good luck and enjoy the profit

Today's EUR/USD Trend Analysis and Trading RecommendationsThe EUR/USD is trading at the upper end of its recent range, having hit an intraday high of around 1.1440 and remaining near that level. The US Dollar strengthened in the early session due to optimism about the easing of Sino-US trade tensions, but later declined as European stocks fluctuated. Technically, the daily chart shows bulls remain in control, with the 20-day SMA rising gently at 1.1330. In the short term, the pair is range-bound around the 20-day SMA, yet to confirm a bullish breakout, while the 100-day and 200-day SMAs support the overall upward trend.
EUR/USD
buy@1.14200-1.14300
tp:1.14600-1.14900

EURUSD SHORT FORECAST Q2 W24 D10 Y25EURUSD SHORT FORECAST Q2 W24 D10 Y25
Professional Risk Managers👋
Welcome back to another FRGNT chart update📈
Diving into some Forex setups using predominantly higher time frame order blocks alongside confirmation breaks of structure.
Let’s see what price action is telling us today!
💡Here are some trade confluences📝
✅Weekly order block
✅15' order block
✅4 hour order block
✅Tokyo ranges to be filled
🔑 Remember, to participate in trading comes always with a degree of risk, therefore as professional risk managers it remains vital that we stick to our risk management plan as well as our trading strategies.
📈The rest, we leave to the balance of probabilities.
💡Fail to plan. Plan to fail.
🏆It has always been that simple.
❤️Good luck with your trading journey, I shall see you at the very top.
🎯Trade consistent, FRGNT X

EURUSD - Long 15min orderflow changeI have set a pending order on EURUSD based on the structure shift and liquidity left behind to the left and now the right.
Entry order placed. lets see what happens on this position.

Week of 6/8/25: EU AnalysisPrice has reached the extreme of daily bearish structure and we can see a rejection of the 4h latest push to make another high. We're following 1h internal bearish structure to at least take out the weak low, thus making 1h structure bearish and following that to the 4h extreme swing low.
Major news:
Core CPI - Wednesday

EURUSD Analysis todayHello traders, this is a complete multiple timeframe analysis of this pair. We see could find significant trading opportunities as per analysis upon price action confirmation we may take this trade. Smash the like button if you find value in this analysis and drop a comment if you have any questions or let me know which pair to cover in my next analysis.

EURUSD Potential Long then ShortEUR/USD looking to trade around a key supply zone between 1.1450–1.1500. We’re watching for signs of bearish rejection to build a short bias from this area. No trade unless price confirms.
Main Setup:
If price retests upper zone (~1.1450–1.1500) and shows clear bearish price action, I’ll be looking to enter short.
Ideal signs: rejection wicks, SFPs, bearish engulfing, lower timeframe structure shift.
Break & Retest Option:
If price breaks below 1.1390, a clean bearish retest could offer a continuation short setup.
Structure break confirmation is key here.
This is a forecast, and trades will be dependent on live PA.
If we don’t get confirmation, we don’t force it. Patience is key.
DXY Outlook:
The Dollar Index looks bearish overall but is currently in a small corrective bounce. A short-term DXY pullback would support a push into EUR/USD’s supply zone — lining up nicely with our plan. If DXY flips back to bullish, that strengthens our short setup.

EURUSD - Where to next?I managed to catch a nice 1:21 RR on EU
I am now triggered into a long position taking price back up to the previous highs and potentially beyond.
Price is at a very key area on the HTF and we are at a key area of Supply.
As price sits I'm still expecting it to continue higher, however, if we break the 4HR orderflow to the downside there is a strong possibility price will move lower.
We will keep an eye on this one this week!

EURUSDEURUSD getting ready for another push up, it needs some more correction before heading for the top.
Disclosure: We are part of Trade Nation's Influencer program and receive a monthly fee for using their TradingView charts in our analysis.

EURUSD LIVE TRADEHello friends
Since the price has reached the specified important resistance, a correction in the price is expected. Therefore, you can enter the position with capital and risk management and move with it to the specified goals.
*Trade safely with us*

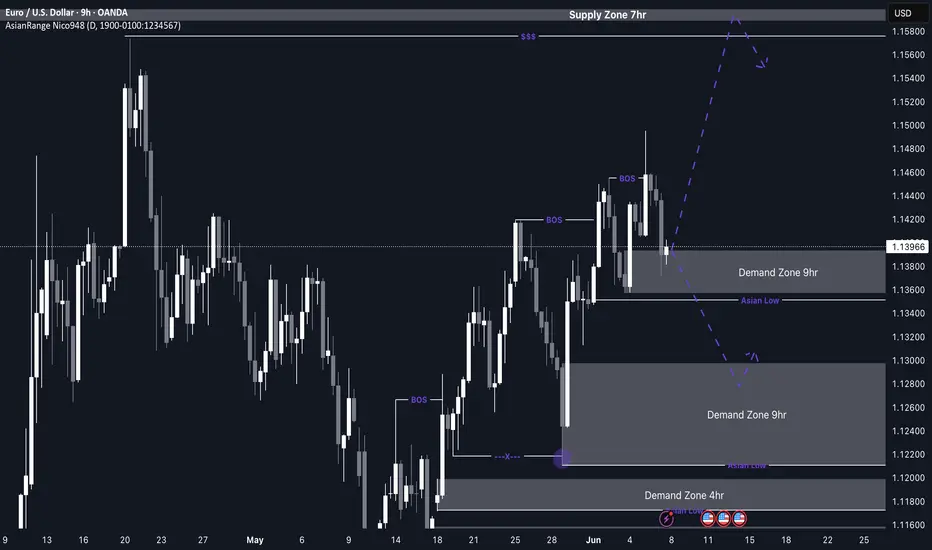
EUR/USD Potential buys from current zone or 1.12800My outlook for EU this week closely aligns with GU — both pairs are showing similar structure and direction. Price continues to form higher highs and higher lows, maintaining its bullish momentum.
Following the most recent break of structure to the upside, EU has now entered a 9H demand zone, where I’ll be watching for signs of accumulation and potential entry as the market opens on Monday.
If this current zone fails to hold, there’s a more discounted 9H demand zone just below, which could offer a cleaner long opportunity. Either way, both scenarios follow the pro trend, which adds conviction to the buy idea.
Confluences for EU Buys:
Price has broken structure to the upside and entered a clean 9H demand zone
There’s another refined 9H demand zone just below for additional confirmation
Plenty of upside liquidity remains untouched
Structure remains bullish on the higher timeframes, making this a pro trend setup
P.S. If price reacts well and continues pushing higher, I’ll be keeping an eye on the 7H supply zone above for any possible short-term bearish reaction.
Wishing everyone a successful and disciplined trading week ahead!
EURUSD Analysis – Short Bias Builds on Key Resistance RejectionEURUSD pair is currently testing a critical resistance zone around 1.1495–1.1500, with bearish rejection beginning to form on the 4H timeframe. The technical setup suggests a potential lower high forming within the context of a broader downtrend, supported by a confluence of horizontal resistance and bearish risk catalysts.
🔍 Technical Overview:
Resistance Zone: 1.1495–1.1575 (multi-timeframe key levels)
Support Levels to Watch: 1.1234 (range base) and 1.1086 (swing low)
Price Action: After a sustained rally, price is showing exhaustion near previous highs, and a rejection pattern is emerging, suggesting selling interest.
Risk Management: Stop placed above 1.1575 high, with downside targets near 1.1234 and extended toward 1.1086.
🧠 Fundamental Backdrop:
ECB Policy Outlook: Lagarde recently warned that a stronger euro and higher tariffs may hurt EU exports. This dovish tone could weigh on EUR sentiment in the medium term.
US Dollar Strengthening: The latest US labor market data (ADP, JOLTS) beat expectations, showing continued resilience in employment and wage growth. This supports the Fed's data-dependent approach, favoring a stronger USD.
Macro Tensions: Global trade concerns (Trump’s tariffs, weak China demand, Germany’s slowing job market) are adding pressure to EUR while supporting safe-haven USD flows.
ECB Consumer Expectations Survey (April): Highlights persistent inflation fears and deteriorating economic confidence.
⏳ Scenario Outlook:
✅ Bearish Bias Preferred below 1.1500 with confirmation of rejection.
🎯 Target Zone 1: 1.1234 – Strong structure & demand zone.
🎯 Target Zone 2 (Extended): 1.1086 – Major low from mid-May.
❌ Invalidation: A breakout and close above 1.1575 would neutralize the bearish outlook and open up higher targets toward 1.17.
Conclusion: The EURUSD pair presents a compelling short opportunity, with both technical resistance and macro pressure aligning for a retracement or reversal. Short setups are favored unless bulls reclaim and hold above the 1.1575 handle.

EURUSD(20250606) Today's AnalysisMarket news:
The European Central Bank cut three key interest rates by 25 basis points. Lagarde hinted that the rate cut cycle will end, and the market is no longer fully pricing in another 25 basis point rate cut this year.
Technical analysis:
Today's buying and selling boundaries:
1.1447
Support and resistance levels
1.1537
1.1503
1.1481
1.1412
1.1391
1.1357
Trading strategy:
If the price breaks through 1.1447, consider buying, and the first target price is 1.1481
If the price breaks through 1.1412, consider selling, and the first target price is 1.1391

EURUSD(20250605) Today's AnalysisMarket news:
U.S. economic data-① ADP employment increased by 37,000 in May, far below the expected 110,000 and the previous value of 62,000. ② The U.S. ISM non-manufacturing index in May fell to 49.9, shrinking for the first time in nearly a year, and the expected increase was from 51.6 to 52.
Technical analysis:
Today's buying and selling boundaries:
1.1401
Support and resistance levels:
1.1478
1.1449
1.1431
1.1372
1.1353
1.1324
Trading strategy:
If the price breaks through 1.1431, consider buying, and the first target price is 1.1449
If the price breaks through 1.1401, consider selling, and the first target price is 1.1372

EURUSD short term analysis in US sessionEURUSD is trading in the price range of 1.161 and 1.158. It is unlikely that there will be a breakout through this price range today. If the pair retreats slightly to 1.156, it is considered a good buy signal. Let's wait and see what the next short-term developments of EURUSD are.
I will send you the long term analysis of the pair tomorrow.

EUR/USD Awaits ECB Decision Near 1.1400 Amid Rate Cut BetsCMCMARKETS:EURUSD FX:EURUSD EUR/USD is consolidating above the 1.1400 psychological level as markets brace for the European Central Bank’s monetary policy announcement. The ECB is widely expected to cut its Deposit Facility Rate by 25bps to 2.00%, marking its seventh consecutive rate cut since June 2024.
Technically, the pair continues to trade within a well-defined ascending channel, reflecting a broader bullish structure. Current price action is facing a minor resistance near 1.1421, which is the top of the short-term range and also a key trendline rejection zone. A clean breakout above this area could expose the monthly resistance near 1.1557.
However, if OANDA:EURUSD EUR/USD fails to breach this level initially, a pullback toward 1.1366 (channel base support) is possible before bulls regain control. The bullish setup remains valid as long as price holds above this support zone.
Traders should monitor the ECB press conference for signals on whether the central bank may pause further easing later this year.
Resistance : 1.1421 , 1.1557
Support : 1.1366 , 1.1250

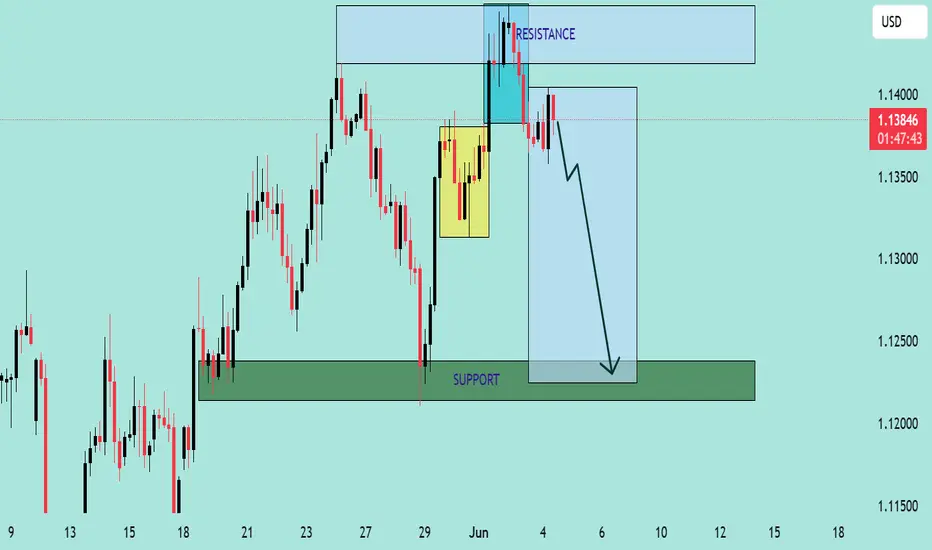
EUR/USD Bearish Reversal Setup Analysis EUR/USD Bearish Reversal Setup Analysis 🧠💼
The chart presents a clear bearish outlook on EUR/USD, with well-defined resistance and support zones, along with a projected short-term price trajectory. Here's a professional breakdown:
🔍 Key Technical Highlights
🔵 Resistance Zone (~1.1400 - 1.1430)
Price recently tested this resistance area and formed multiple wicks, signaling strong seller presence.
A bullish liquidity grab is evident in the highlighted cyan box, suggesting a fake breakout before reversal.
🟡 Supply Zone / Order Block
The yellow box marks a previous consolidation area (potential order block), which was revisited and rejected — reinforcing bearish intent.
🔽 Current Price Action
Price is trading around 1.1378, having broken structure and failed to maintain momentum above the resistance.
Sharp rejections and bearish engulfing candles imply strong selling pressure.
🟢 Support Zone (~1.1230 - 1.1260)
This is a previous demand area where price rallied strongly.
The large blue projection box and arrow suggest a bearish continuation targeting this support region.
📉 Bias: Bearish
Structure: Lower highs forming after liquidity grab.
Price Action: Bearish engulfing after resistance rejection.
Market Sentiment: Sellers appear in control after failing bullish breakout attempt.
🎯 Trade Idea
Entry: After confirmed rejection from resistance (~1.1370–1.1385)
TP: Around 1.1240 (support zone)
SL: Above recent highs (~1.1420)
Risk/Reward: Favorable R:R as the setup targets a large swing down.
EURUSD Trade Setup: Heres My Trade Plan!📈 EUR/USD Trade Outlook: Bullish Trend in Focus 🇪🇺💵
I'm currently watching EUR/USD, and it’s holding a strong bullish trend — with clear higher highs and higher lows across the board 🔁. On the 4-hour timeframe, price has pulled back into equilibrium, and I’m eyeing a potential buy opportunity if the structure continues to hold 🛒.
📚 Looking at historical price action, this setup has played out reliably in the past. That said, it's important to acknowledge that deeper pullbacks can occur — often sweeping liquidity below previous lows before resuming the trend 💧.
⚠️ This is a real risk, so consider conservative position sizing and always manage your risk appropriately.
💬 Drop a comment below if you're watching this setup too — I’d love to hear your take!
❗️Disclaimer: This is not financial advice. The content shared is for educational and informational purposes only. Please do your own analysis and trade responsibly.

Stronger U.S. JOLTS Data Pressures EURUSD!!!EURUSD ( FX:EURUSD ) failed to break the Resistance zone($1.1487-$1.1424) and started to fall again , breaking the Support lines .
In terms of Elliott Wave theory , it seems that EURUSD has managed to complete the main wave X of the Double Three Correction(WXY) structure .
Just moments ago, the U.S. JOLTS Job Openings data was released.
-------------------------------
Actual: 7.39M
Forecast: 7.11M
Previous: 7.19M
The stronger-than-expected JOLTS figure at 7.39 million signals a resilient labor market. This reduces recession fears and increases the likelihood that the Federal Reserve may keep interest rates elevated for longer.
Bullish for the U.S. Dollar( TVC:DXY )
Bearish pressure could hit EURUSD, especially if it's approaching the key resistance zone.
-------------------------------
I expect EURUSD to start to fall again after the pullback to the Support lines and to fall to the targets I have specified on the chart.
Note: If EURUSD touches $1.14580(Stop Loss(SL)), we can expect a failure of the Resistance zone($1.1487-$1.1424).
Please respect each other's ideas and express them politely if you agree or disagree.
Euro/U.S. Dollar Analyze (EURUSD), 1-hour time frame.
Be sure to follow the updated ideas.
Do not forget to put a Stop loss for your positions (For every position you want to open).
Please follow your strategy and updates; this is just my Idea, and I will gladly see your ideas in this post.
Please do not forget the ✅' like '✅ button 🙏😊 & Share it with your friends; thanks, and Trade safe.

Euro Pulls Back – Eyes on ECB and Tariff TurmoilCMCMARKETS:EURUSD FX:EURUSD EUR/USD pulled back from a six-week high of 1.1454 to trade near 1.1379, down 0.52% on Tuesday, as strong U.S. labor market data and revived trade tensions lifted the dollar. April JOLTS job openings rose to 7.39M, beating expectations, signaling a resilient U.S. economy despite a 3.7% drop in factory orders.
In parallel, Trump’s announcement to double tariffs on steel and aluminum has reignited trade war concerns. Markets are also watching for a potential Trump–Xi call later this week.
Meanwhile, the Euro lost ground after May HICP inflation in the Eurozone fell to 1.9%, below the ECB’s 2% target. With core inflation slowing as well, markets have priced in a 25 bps rate cut at Thursday’s ECB meeting.
Technically, OANDA:EURUSD EUR/USD is still trading within a rising channel but rejected key minor resistance zone just below the descending trendline. A confirmed breakout above this area could open the path toward monthly resistance near 1.1559. On the downside, Support Zone 1 (around 1.1375) must hold to maintain the bullish bias; further weakness may expose Support Zone 2 (around 1.1338)
Resistance : 1.1445 , 1.1559
Support : 1.1375 , 1.1338
