Bearish AB=CD - Sell at Current Price!FX:EURUSD has broken its bullish support and formed a bearish AB=CD pattern. AB=CD is a bearish continuation pattern which aligns with the overall price action.
I am shorting EURUSD at current market price and expecting retracement until Point D to complete the pattern!
Eurusdsell

EURUSD - Expecting Bearish Continuation In The Short TermH1 - Clean bearish trend with the price creating series of lower highs, lower lows.
Lower lows on the moving averages of the MACD indicator.
Expecting further continuation lower until the two Fibonacci resistance zones hold.
If you enjoy this idea, don’t forget to LIKE 👍, FOLLOW ✅, SHARE 🙌, and COMMENT ✍! Drop your thoughts and charts below to keep the discussion going. Your support helps keep this content free and reach more people! 🚀
--------------------------------------------------------------------------------------------------------------------
Disclosure: I am part of Trade Nation's Influencer program and receive a monthly fee for using their TradingView charts in my analysis.

EUR/USD Bearish Setup: Supply Zone Rejection Toward1.0900 Target(Swing Trade Setup)
📉 Trendline + CHoCH Confirmation
🔻 Downtrend marked by a falling blue trendline.
🔄 CHoCH (Change of Character) shows a bearish market structure shift, confirmed by a lower low.
🟦 Supply Zone (Sell Zone)
💥 Strong seller reaction previously occurred between:
1.12956 – 1.13896
🔹 Wait for price to retrace into this zone.
🎯 Ideal for short entries.
🎯 Entry & Stop-Loss
🔵 Entry Point: Around 1.12956 – 1.13005
(below supply zone and EMA)
🛑 Stop Loss: 1.13896 – 1.13929
(above the last high + supply zone)
🟦 EMA 70 (Purple Line)
📈 Currently at 1.13051
Acts as dynamic resistance — strengthening the short setup.
🏁 Target Zone
🎯 Main Target: 1.09000
Marked as TARGET POINT 1.0900
🟦 Support Levels Inside Target Zone:
1.09229
1.09150
1.08814
✅ Summary of Trade Idea
📍 Short Position
⬆️ Entry: ~1.13000
🛑 Stop Loss: ~1.13900
⬇️ Take Profit: ~1.09000
⚖️ Risk-to-Reward: ~1:3+ potential

EURUSD m15 SellEURUSD is once again giving a sell signal. It's advisable to set the trade with a 1:1.50 Risk-Reward Ratio. You may consider closing your position at this level.
🔔 I post detailed trade ideas and daily market analysis like this every day on my TradingView profile.
👉 Follow me to get notified and read the full breakdowns.

EUR USD Trade Setup 4 hour timeframe EUR USD has formed a Head and shoulders Pattern on the 4 hour timeframe
the market has been very choppy on the lower timeframe only the higher timeframe can show direction.

EUR/USD W Closure Very Bearish , Best 2 Places For Sell Cleared Here is my opinion on EUR/USD , If we checked weekly time frame , we will see that we have a great bearish price action , and on lower time frames we have avery good bearish price action also , so i think we can sell this pair from the places i mentioned with small sl , and target will be from 100 to 250 pips .

#eurusdYou can enter in one of two trades, and the low-risk entry is the smaller trade entry because the range is more precise.

EURUSD - Expecting Short Term RetracesH4 - Strong bullish move ended with a bearish divergence.
While measuring this strong bullish move using the Fibonacci retracement tool we have two key support zones that has formed (marked in green).
So based on this I expect short term bearish moves now towards the Fibonacci support zones.
If you enjoy this idea, don’t forget to LIKE 👍, FOLLOW ✅, SHARE 🙌, and COMMENT ✍! Drop your thoughts and charts below to keep the discussion going. Your support helps keep this content free and reach more people! 🚀
--------------------------------------------------------------------------------------------------------------------
Disclosure: I am part of Trade Nation's Influencer program and receive a monthly fee for using their TradingView charts in my analysis.

EUR/USD Shorts from 1.5500 back down My analysis this week is quite similar to GU. I’ll be looking for short opportunities to target a demand zone below current price. We’ve seen consolidation over the past week, which has built liquidity on both sides—and it's only a matter of time before that liquidity is swept.
What I’ll be watching for is a reaction at the current supply, where I’ll wait for price to slow down and distribute, giving us an opportunity to catch a retracement down toward a key area of interest for buys. If price reaches 1.12000 or lower, I’ll be looking for signs of accumulation and potential longs from there.
Confluences for EUR/USD Sells:
- The DXY has been bearish, but is approaching a demand zone, which could cause a reversal—aligning with EU shorts.
- A strong weekly supply zone is in play, which could trigger a bearish reaction.
- Plenty of liquidity and imbalances lie to the downside, ready to be cleared.
- A retracement is likely, considering the extended bullish momentum recently.
- Current consolidation suggests a breakout is near, and this supply zone is my nearest POI for shorts.
P.S. Stay flexible—once the consolidation breaks, assess how price behaves. Don’t lock yourself into one bias; always be prepared to adapt to what the market shows you.

EURUSD TRADE IDEA : SELL | SHORT (15/04/25)After failing to recently break the high - I believe EURUSD will seek to dump to the downside. Hold your hats - this may be a swing sell. We can be sure that the bias has changed though!

EURUSD - Short Trade Confirmation :
1. Bearish Order-Flow
2. Market retraced to the supply zone with the help of previous demand, which is liquidity now
3. Tapped into the premium supply zone
4. M5 CHoCH to the downside
5. Previous high reacted as an Inducement
6. Entered in the supply tap
The only thing that is concerning the trade is market tapped into the 15m support trend-line. Once the trend-line is taken out with the strong bearish candle closure, that can add an confluence to the trade.
Thanks for the time..

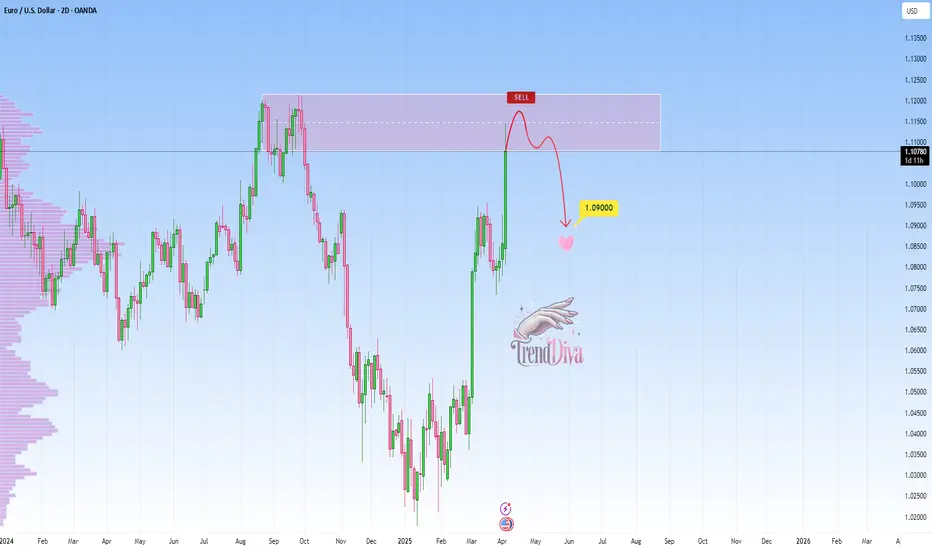
EURUSD at Major Resistance: Will it Drop To 1.09000?OANDA:EURUSD reached a major resistance level that has previously acted as a strong barrier, triggering bearish momentum in the past. This zone also aligns with prior supply areas where sellers have stepped in, making it a potential point of interest for those looking for short opportunities. Given its historical significance, how price reacts here could set the tone for the next move.
If bearish signals emerge, such as rejection wicks, bearish candlestick patterns, or signs of weakening bullish pressure, I anticipate a move toward the 1.09000 level. However, a clear breakout above this resistance could challenge the bearish outlook and open the door for further upside. It's a pivotal area where price action will likely provide clearer clues on the next direction.
Just my take on support and resistance zones, not financial advice. Always confirm your setups and trade with a proper risk management.
Best of luck!
EURUSDWeekly trend line 3rd touch
Counter trend line break
Double tops neckline broke
Shooting star candle at weekly trend line

EUR/USD Double Top Analysis - Bearish Reversal Trade Setup This analysis highlights a Double Top pattern forming on the EUR/USD 4-hour timeframe, which is a classic bearish reversal pattern. The pattern signals a potential shift from a bullish trend to a downtrend, providing traders with a well-defined entry, stop loss, and target levels.
1. Understanding the Double Top Pattern
A Double Top is a trend reversal pattern that forms after an extended uptrend. It consists of two peaks (Top 1 and Top 2) at approximately the same resistance level, followed by a break below the neckline (support level), confirming the pattern.
Pattern Breakdown:
Top 1 & Top 2: These peaks represent failed attempts to break higher, showing strong selling pressure at resistance.
Support (Neckline): The price found support at a key level, where buyers initially stepped in, but eventually, this level was broken, triggering a potential downtrend.
2. Key Levels & Trading Setup
📌 Resistance Level (Bearish Rejection Zone)
The resistance level is marked in the 1.09500 - 1.09600 range.
Price action tested this zone twice (Top 1 & Top 2) but failed to sustain above it.
The repeated rejection indicates that sellers are dominant in this zone.
📌 Support Level (Neckline Breakout Confirmation)
The support level is marked in the 1.07700 - 1.07800 zone.
The price bounced off this area initially, but later broke below it, confirming a bearish move.
The breakout suggests selling momentum is increasing.
3. Trading Strategy – Bearish Setup
🔴 Entry Point (Sell Trigger)
A short trade is confirmed when the price breaks below the neckline (support level) after forming the Double Top.
The breakout confirms seller dominance and signals potential downside movement.
🚨 Stop Loss Placement
Stop Loss is placed slightly above the resistance level at 1.09575.
This ensures protection against false breakouts or price retracements.
🎯 Target (Take Profit Projection)
The price target is calculated based on the height of the Double Top pattern.
Target Level: 1.06639, aligning with the measured move from the resistance to the neckline.
4. Market Outlook & Risk Management
📉 Bearish Scenario (High Probability Move)
✔️ The market structure shows a strong bearish reversal with price failing to break above resistance.
✔️ The confirmed neckline break indicates sellers have taken control.
✔️ If the price continues lower, we can expect a move toward 1.06639.
📈 Bullish Scenario (Invalidation of Trade)
❌ If price closes back above resistance (1.09575), it would invalidate the bearish setup.
❌ This would indicate that buyers are regaining control, and the trade setup should be re-evaluated.
5. Final Thoughts & TradingView Tags
Summary of Trading Setup:
✅ Pattern: Double Top (Bearish Reversal)
✅ Sell Entry: Below the support neckline
✅ Stop Loss: Above 1.09575
✅ Target: 1.06639
✅ Risk-Reward Ratio: Favorable
📌 Tags for TradingView Idea:
#EURUSD #DoubleTop #ForexTrading #BearishReversal #SupportResistance #PriceAction #TechnicalAnalysis #ForexSetup #TradingStrategy

EUR/USD Weekly Forecast: Rising Wedge Breakdown & Bearish TargetChart Overview:
The provided EUR/USD daily chart displays a well-structured Rising Wedge pattern, which eventually led to a significant bearish breakdown. The analysis highlights key levels, including resistance, support, stop loss, and a downside target, all of which contribute to a well-planned trade setup. The market structure suggests a strong bearish continuation, targeting lower price levels based on technical projections.
1. Chart Pattern: Rising Wedge Formation & Breakdown
A Rising Wedge is a bearish reversal pattern that forms when price creates higher highs and higher lows, but the slope of the trendlines indicates weakening bullish momentum. This pattern is often a signal of upcoming bearish price action once a breakout occurs.
Pattern Breakdown Analysis:
The price moved inside the wedge, showing a gradual upward trend with declining momentum.
Upon reaching a key resistance level, price faced strong rejection (marked with a red circle).
The bearish breakdown below the wedge confirmed the pattern, leading to a sharp decline.
A retest of the broken wedge followed before continuing downward.
This confirms a classic bearish trend reversal, making it a strong technical setup.
2. Key Levels and Trade Setup:
🔹 Resistance Level (Major Supply Zone)
The resistance zone (highlighted in beige) acted as a strong supply area, where buyers lost control.
Price reached this resistance multiple times but failed to sustain above it.
A bearish reversal initiated from this level, marking the beginning of a downward trend.
🔹 Support Level (Key Demand Zone)
The support zone (also highlighted) represents a major demand area where price previously reversed.
This level aligns with historical price action, making it a critical area to monitor for potential reactions.
🔹 Stop Loss Placement
A stop loss is placed above the previous high within the resistance zone to protect against false breakouts.
If price invalidates the breakdown and moves above this level, the bearish setup would no longer be valid.
🔹 Price Target Projection
The breakdown suggests a potential drop towards 1.00874, as indicated by the 100% measured move.
This aligns with previous historical support, making it a realistic downside target.
3. Trade Execution Plan: How to Trade This Setup?
📌 Entry Strategy:
Traders can enter short after confirmation of the breakdown and a potential retest.
A sell position can be initiated around the resistance turned support after a pullback rejection.
📌 Stop Loss Strategy:
A stop loss should be set above the resistance zone (around 1.12208) to minimize risk.
This ensures protection against a bullish breakout invalidation.
📌 Take Profit Strategy:
The first take profit target is set at the support level near 1.04498.
The final take profit target is at 1.00874, which aligns with the full measured move projection.
4. Conclusion & Market Sentiment
🔸 Bearish Market Bias – The breakdown of the rising wedge confirms strong bearish momentum.
🔸 Key Resistance Held Strong – The price was unable to break above, confirming seller dominance.
🔸 Downside Target Aligns with Previous Support Levels – A confluence of technical signals supports further decline.
Final Thought:
This chart presents a high-probability bearish trade setup in EUR/USD. The combination of a rising wedge breakdown, clear resistance rejection, and a defined downside target makes it an ideal short-selling opportunity. Traders should watch for price action confirmations and risk management strategies before executing trades.
🚨 Risk Disclaimer: Always apply proper risk management and confirm signals before trading. Market conditions may change, so monitoring price behavior is crucial for trade adjustments.

EUR/USD: Uncertain Trajectory Amid Tariff - Induced JittersThe EUR/USD is trading at 1.0796. After a Thursday rebound from 1.0733 due to a weakening USD, it's now pressured at the intraday high of 1.0799.
US President Donald Trump's new 25% import taxes on cars and car parts, with potential additional levies on the eurozone and Canada, have stoked risk - off sentiment. This has led to a temporary dip in the US dollar's appeal.
On the daily chart, it's found buyers near the non - directional 200 - day SMA, with 1.0730 as dynamic support. It's attempting to break the bullish 20 - day SMA, while the 100 - day SMA is non - directional below the current level. The momentum indicator is flat below 100, and the RSI at 56 hints at upward risk, yet unconfirmed. Bulls should be cautious short - term.
In the 4 - hour chart, technicals are rising but below the mid - line. EUR/USD is fighting a bearish 20 - day SMA, and the 100 - day SMA has lost upward steam around 1.0840. A break above 1.0840 could bring back the bulls.
EURUSD
buy@1.08200-1.08500
tp:1.08900-1.09300
I will share trading signals every day. All the signals have been accurate for a whole month in a row. If you also need them, please click on the link below the article to obtain them.

Attention! Key Signals in the EUR/USD Exchange Rate TrendThe EUR/USD pair has traded with a soft tone for five consecutive trading days, and the decline has expanded to 1.0776, the lowest level since March 6. However, the broad weakness of the US dollar in the middle of the European session pushed the currency pair to turn upward.
In the short term, according to the 4-hour chart, although the possibility of further upward movement is low, the downside potential also seems limited. The EUR/USD found buying support around the bullish 100-day moving average but failed to break through the bearish 20-day moving average. Finally, although technical indicators show an upward trend, they remain in negative territory.
EURUSD Trading Strategy:
buy@1.08200-1.08500
tp:1.08900-1.09300
I will share trading signals every day. All the signals have been accurate for a whole month in a row. If you also need them, please click on the link below the article to obtain them.

CAD JPY Trade Setup 1 hour timeframe CAD JPY Trade Setup 1 hour timeframe
Following last week's trade setup CAD JPY is moving in an uptrend making Higher Highs and Higher Lows, so we will keep looking for Buying opportunities.
CAD JPY is forming a bullish break and retest continuation pattern that also align with the 0.618-0.50 Fib Retracement level.
Lets wait for the price to pull back to the retest level then enter base off candlestick confirmation

EURUSD: ShortThis is a relatively standard double top pattern. The possibility of a decline after a small rebound is higher, so shorting is recommended.

EURUSD Trading: Unveiling the Precise Strategy GuideAfter last week's decline, the euro against the US dollar started to recover at the beginning of this week and is currently trading within the positive range around 1.0850.
According to the Wall Street Journal, the White House is adjusting its tariff policy set to take effect on April 2nd. It may cancel a series of tariffs targeting specific industries and instead impose reciprocal tariffs on countries with significant trade relations with the US. Affected by this news, during the European morning session, US stock index futures rose by 0.8% to 1.0%.
On the 4 - hour chart in the European morning session on Monday, the Relative Strength Index (RSI) indicator climbed to 50, indicating that the recent bearish momentum has dissipated to some extent.
In terms of the upward direction, the 50 - period Simple Moving Average (SMA) forms an interim resistance level at 1.0880, followed by 1.0900. If the euro - US dollar pair can firmly stand above this level, the next resistance level may be at 1.0950.
EURUSD Trading Strategy:
buy@1.08200-1.08500
tp:1.08900-1.09300
I will share trading signals every day. All the signals have been accurate for a whole month in a row. If you also need them, please click on the link below the article to obtain them.

EURUSD Maintains Bearish Momentum - Is 1.07500 the Next Target?OANDA:EURUSD is trading within a well-defined descending channel, with price action consistently respecting both the upper and lower boundaries. Recently, the price rejected a key resistance zone, reinforcing bearish momentum and signaling a potential continuation toward lower levels.
The current price action suggests that if price continues to respect this resistance, we could see further downside toward 1.07500, aligning with the lower boundary of the channel. However, if price breaks above the channel and sustains above it, the bearish outlook may be invalidated, potentially signaling a shift in momentum. Monitoring price action and volume at this level will be essential for confirmation.
Just my take on support and resistance zones—not financial advice. Always confirm your setups and trade with solid risk management.
Best of luck!

EUR/USD: Key Levels and Short-Term OutlookRecently, although inflation data in the United States has declined, it remains elevated, and the labour market continues to be tight. The Federal Reserve may maintain a hawkish stance, which is supportive of the US dollar. Meanwhile, the economic recovery in the eurozone has slowed. Weak manufacturing PMI data has dampened business and consumer confidence, exerting downward pressure on the euro.
From the 4-hour candlestick chart, EUR/USD is currently in a triangular consolidation pattern, with the price hovering around 1.08343. The resistance zone lies between 1.08760 and 1.09090, whilst the first support level is at 1.08067 and the second at 1.07528. In this context, EUR/USD is more likely to test the support levels in the short term.
I will share trading signals every day. All the signals have been accurate for a whole month in a row. If you also need them, please click on the link below the article to obtain them.

Fri 21st Mar 2025 EUR/USD Daily Forex Chart Sell SetupGood morning fellow traders. On my Daily Forex charts using the High Probability & Divergence trading methods from my books, I have identified a new trade setup this morning. As usual, you can read my notes on the chart for my thoughts on this setup. The trade being a EUR/USD Sell. Enjoy the day all. Cheers. Jim
