Eurusd trade idea institutional tactics hello traders this my trading setup
Strategy : institutional tactics
If you like my idea please hit the like button, follow and show some love
wish you good luck and good trading
Eurusdshort

EURUSD - SELL SIGNALThe 1.08000 zone still has a lot of selling pressure, so if there is no clear breakout, the price would have to fall back towards the 1.07500 level.
Guys, what do you think? Leave a comment with your thoughts.

SHORT EUR/USD from 1.0783The declining trendline (shown) has held down EUR/USD since the high of March 8th.
It never ceases to amaze me that trendlines so frequently predict price although like anything in trading you cannot depend on them always.
So you need other signs that the price is heading in one direction or another or if the price is reversing or about to reverse.
The Andean Oscillator is a very accurate indicator that not many traders seem to use which I believe is a mistake as it carries a great deal of informatrion if read correctly.
The red SELL line is now above zero on 1M, 5m and 15M and this would suggest EUR/USD BEARS are entering the market.
Its also worth noting that the previous H1 candle is a classic doji indecision (possibly reversal) candle which adds weight to the analysis.
The main worry about this trade is the proximity of the Weekly Resistance Pivot WR1.
This sits at 1.0799 and will be a target for EUR/USD BULLS so I have the STOP above this level incase we get a run up to this resistance level.
Target if the trade takes off will be the 200 EMA at 1.0750 area though the price would need to break through the 25, 50 and 100 EMA's to get there.
Worth noting that the 200EMA on H1 and H4 are in the same place.
The structure remains BULLISH whilst we trade above the H4 200 EMA but a break of this level opens up a possible deep move south down to 1.0664.

EURUSD possible short for 1.0685suspect one more push to the upside to tap 4h supply zone for short. 1.0840-45 is the level from where price may start selling, second extreme level of supply zone is 1.0880-85. stop loss 1.0900, target: 1.0685.

EURUSD short vibesReacting from price imbalance with a corresponding market shift after hitting some orders at 1.07850.

EUR/USD Short Opportunity Looking at the 4 hour chart here there are several things I have charted that make my decision for looking for short entries more favorable for myself. Personally, I use my own scripts and scalp intraday sessions and zones, but this analysis allows me to ignore the bullish side of things until otherwise seeing a reason to reverse my bias.
Several news factors played into last weeks price action and on the 4hr you can see that we are finally breaching into that large gap that was created the beginning of April where a large amount of shorts came into the market off of a strong DXY (US Dollar) and I give credit to the push on the Euro this week to the strong earnings on the stocks side of things in the USA. (US30, NAS, SP500) This leading to the dollar softening or possibly profit taking? Hard to call those things but I see this a great entry opportunities for shorts because as you see by the first technical I will go over here, that gap has a fibonacci retracement that has been respected at the .50 level.
It also ties in with a 4hr long term trend line that this would be the 5th tap into, which can sometimes mean a 'weaker' trend due to the fact it keeps getting tapped into shows there is interest, however in this scenario you also see a parallel channel that stays respected for a good amount of time on the 4hr. I see all these factors playing into the Bishop RSI v2 which takes 6 intraday timeframes and takes their RSI value and applies a FRAMA calculation to it and provides it as one single line. This has given me great accuracy on picking tops and bottoms or weakening trends in this scenario.
If we have some bullish dollar movement and can continue on our bearish long term trend on the EUR/USD pair here, we can see a 1% retracement this week (very reasonable and realistic) and it would line up with support levels which would most likely be targeted IF the pair goes bearish. Thats the scoop on it as of now!

EUR/USD Ready to short!(5/7/2024)In our last analysis, EUR/USD FX:EURUSD
Continued the mini bullish move(retracement) and right now the price is ranging.
We believe the price has finished the correction phase and is ready to start a new bearish move.
Our technical view has been shown in the chart.
If you like it then Support us by Like, Following, and Sharing.
Thanks For Reading
Team Fortuna
-RC
(Disclaimer: Published ideas and other Contents on this page are for educational purposes and do not include a financial recommendation. Trading is Risky, so before any action do your research.

Sell EUR/USD Triangle BreakoutThe EUR/USD pair on the M30 timeframe presents a potential shorting opportunity due to a recent breakout from a triangle pattern.
Entry: Consider entering a short position (selling) below the broken support trendline of the triangle after confirmation. Ideally, this would be around 1.0770 or lower if the price continues to decline.
Target Levels:
1.0704: This represents the height of the triangle, measured from its apex (highest or lowest point) to the breakout point, projected downwards from the breakout point.
1.0680: This is a further extension of the downside target, based on the height of the recent price movement before the breakout.
Stop-Loss: Once the entry point is confirmed, place a stop-loss order above the broken support line of the triangle, ideally with some buffer around 1.0800. This helps limit potential losses if the price unexpectedly reverses and breaks back upwards.
Thank you.

EUR USD EUR/USD is the forex ticker that tells traders how many US Dollars are needed to buy a Euro. The Euro-Dollar pair is popular with traders because its constituents represent the two largest and most influential economies in the world. Follow real-time EUR/USD rates and improve your technical analysis with the interactive chart. Discover the factors that can influence the EUR/USD forecast and stay up to date with the latest EUR/USD news and analysis articles.

EURO / U.S. DOLLAR EUR/USD SELLEUR/USD SELL 1.07313
Hello Traders 👋If you find this analysis useful, please support me with your likes and comments.
SL 1.07755
TP1 1.06582
If you have another analysis at this pair, please share in comments, I will be glad to discuss with you.

eurusd shortDear friends and companions:
My technical analysis is based on trend line and also smart money.
A suitable point for sale with r/r=5
At the same time, there is a possibility of an increase in the American interest rate and the strength of the dollar. So I will only sell
EURUSD - SELL SIGNALWe still have selling pressure at the 1.07250 level, so the price will remain below that level this week.
In a few hours the FOMC statement and the interest rate decision will be released, so I am going to go short looking for today's daily minimum, and if later they raise the price a little more, it will be a good opportunity to enter again short at a better price.
Guys, what do you think? Leave a comment with your thoughts.

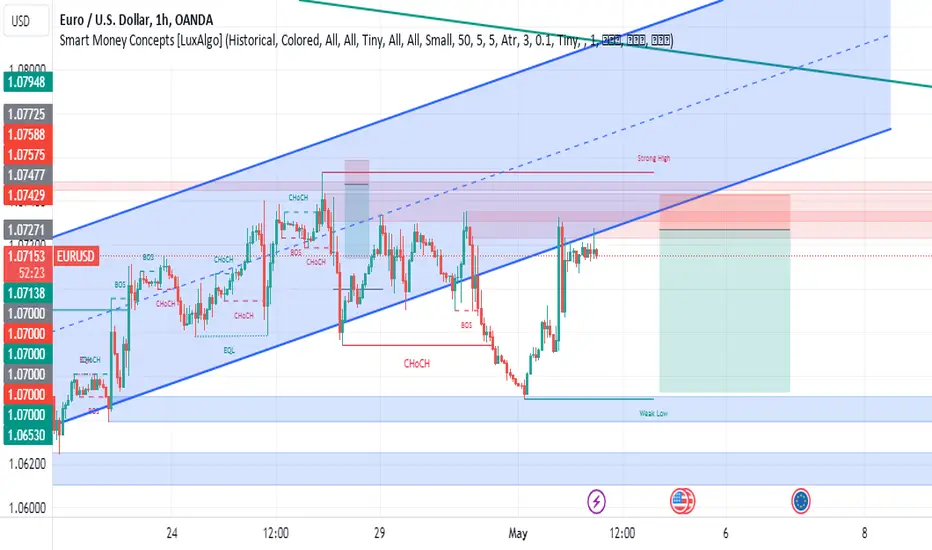
EURUSD Analysis (1st May 2024)
Market Analysis PT2/2 (1st May 2024)
EURUSD Analysis
On the 4 hour timeframe, price action has created a 4 hour bearish FVG which caused the bearish BOS. This makes it a very good Point of Interest for us to look for shorts from.
Ideally during Asia/London, we see price retrace into the 4 hour FVG. Once price does that, i will drop to the 5/15 minute timeframe to look for a bearish Change of character for some potential A+ sell set ups to continue to bearish momentum.
P.S. : There is EURO Bank holiday today, so do expect smaller volatility in the markets, but yet again the markets are unpredictable. Lets see what london brings us🐳

eurusdEUR/USD is the forex ticker that tells traders how many US Dollars are needed to buy a Euro. The Euro-Dollar pair is popular with traders because its constituents represent the two largest and most influential economies in the world. Follow real-time EUR/USD rates and improve your technical analysis with the interactive chart. Discover the factors that can influence the EUR/USD forecast and stay up to date with the latest EUR/USD news and analysis articles

recognising the euro cahrt in the past ( check comments )hi , don 't be tired .
i analyzed the euro chart in the past 15 minutes and 4 hours , but for some reason i forgot to make public that i 'm going to put a link now to the euro in the time
see and comment
time frame and 4 - hour and weekly frames were at the center of descending tracks . ~~~ for doing so , it was necessary to perform 15 minutes of movement upward and then to the bottom to reach the time frame for 4 hours in order to get enough cash to collect and move down .

EURUSD Bearish Butterfly Pattern Formation @ 4-Hour TimeframeEURUSD is currently forming a Butterfly Harmonic Pattern (XABCD) on the 4-hour timeframe. This pattern is characterized by specific Fibonacci ratios between the price swings. The pattern consists of four legs: XA, AB, BC, and CD. The completion point, known as Point D, is expected to coincide with a key Resistance level.
Trendline Analysis:
Additionally, there is a trendline that intersects with the completion point of the Butterfly pattern. This trendline further reinforces the potential resistance at Point D and suggests a strong level of selling pressure.
Bearish Momentum Expected:
Based on the formation of the Butterfly Harmonic Pattern and the confluence with the trendline resistance, we anticipate a shift in momentum towards the downside. This suggests a bearish outlook for EURUSD.
Entry, Stop Loss, and Take Profit Levels:
Entry: We recommend taking a short position at 1.06800, which aligns with the anticipated reversal point (Point D) of the Butterfly pattern and the resistance level.
Stop Loss: To manage risk, a stop loss should be placed at 1.07180, just above the recent swing high. This level provides a buffer against potential market volatility while allowing room for the trade to develop.
Take Profit Targets:
We have identified two take profit levels:
TP-1: Set the first take profit target at 1.06400. This level corresponds to a significant support area and offers a reasonable profit target based on the expected bearish momentum.
TP-2: The second take profit target is set at 1.06025, aiming for a deeper retracement. This level aligns with a previous swing low and provides a more ambitious target for profit-taking.
Conclusion:
In conclusion, the EURUSD pair is exhibiting signs of a potential bearish reversal as it forms a Butterfly Harmonic Pattern along with a trendline resistance on the 4-hour timeframe. Traders may consider short positions with an entry at 1.06800, a stop loss at 1.07180, and take profit targets at 1.06400 and 1.06025. It's essential to monitor price action closely and adjust positions accordingly as the trade develops.

Another mini wave Upward for EUR/USD(4/22/2024)In our last analysis, EUR/USD FX:EURUSD Continued the bearish move and right now the price is ranging.
We believe the price will move upward as a correction.
Our technical view has been shown in the chart.
If you like it then Support us by Like, Following, and Sharing.
Thanks For Reading
Team Fortuna
-RC
(Disclaimer: Published ideas and other Contents on this page are for educational purposes and do not include a financial recommendation. Trading is Risky, so before any action do your research.

EU bearish confluence. MultitimeframeEU Weekly:
EU 4h:
Overall, a lot of bearish confluence across the timeframes. Look for further confirmation and entry setups.
☝️Do not act based on my analysis, do your own research!!
The main purpose of my resources is free, actionable education for anyone who wants to learn trading and improve mental and technical trading skills. Learn from hundreds of videos and the real story of a particular trader, with all the mistakes and pain on the way to consistency. I'm always glad to discuss and answer questions. 🙌
☝️ALL videos here are for sharing my experience purposes only, not financial advice, NOT A SIGNAL. YOUR TRADES ARE YOUR COMPLETE RESPONSIBILITY. Everything here should be treated as a simulated, educational environment. Important disclaimer - this idea is just a possibility and my extremely subjective opinion. Do not act based on my analysis, do your own research!!

eurusd shortEUR/USD is the forex ticker that tells traders how many US Dollars are needed to buy a Euro. The Euro-Dollar pair is popular with traders because its constituents represent the two largest and most influential economies in the world. Follow real-time EUR/USD rates and improve your technical analysis with the interactive chart. Discover the factors that can influence the EUR/USD forecast and stay up to date with the latest EUR/USD news and analysis articles.
EUR/USD is recovering ground toward 1.0700 in the Asian session on Monday. The pair regains lost footing, as markets remain upbeat and weigh negatively on the safe-haven US Dollar. Markets reposition ahead of key Eurozone and US data due later this week.

EUR/USD Shorts to Long idea My bias for EURUSD is similar to GBPUSD, as I'm seeking selling opportunities towards a demand zone. There's a 10-hour supply zone that I'm eyeing for potential sells to continue the downtrend. I'll be waiting for a high to be swept during a Wyckoff distribution before entering my sell positions.
Following this, I anticipate price to decline towards the 3-hour demand zone, which coincides with the 3-hour demand area for GBPUSD. I'll then look for a Wyckoff accumulation phase to ride price back up and fill in the major imbalances left from the upside.
Confluences for EU Sells are as follows:
- Price has been very bearish recently and confirms this via continuous break of structures.
- Good 10hr supply that has recently been created which also caused a BOS.
- Theres an imbalance below that needs to get filled as well as lots of liquidity to be taken.
- The overall trend of the market on the higher time frame is bearish as well.
- DXY also looking bullish as well and it's aligning very well with EU's Zones.
P.S. If the demand zone fails, it will break a significant level of structure, making selling positions more favorable. Currently, bearish momentum remains strong, and I anticipate further downside movement.
Have a great trading week remember risk accordingly and maintain emotional discipline!

EURUSD Bearish SetupWe observe a pronounced bearish signal on the EU Daily chart. The recent breach of the last higher low suggests an increase in bearish momentum, indicating a strengthening bearish trend. The supply zone has already been retested, setting the stage for a potential move towards a new lower low. A downtrend of 500 pips is anticipated in the near future.

eurusd sellEUR/USD gained traction and turned positive on the day above 1.0650. The improvement seen in risk mood following the earlier flight to safety weighs on the US Dollar ahead of the weekend and helps the pair push higher.
The Relative Strength Index (RSI) indicator on the 4-hour chart recovered toward 50, reflecting a loss of bearish momentum. On the upside, 1.0700 (50-period Simple Moving Average (SMA), static level) aligns as first resistance before 1.0730 (static level) and 1.0750 (100-period SMA).
Supports are located at 1.0600 (psychological level, static level) before 1.0530 (static level from November).

