USD Weakness Persists: Can EUR/USD Target 1.18?
The EUR/USD exchange rate has continued to strengthen, breaking through the psychological barrier of 1.1600 during the intraday session, marking the first time it has reached this level since November 2021. The pair surged to an intraday high of 1.1630, driven by the confluence of a persistently weakening US dollar and enhanced economic resilience in the Eurozone.
Technically, the EUR/USD currently exhibits a robust bullish pattern. If it can sustain above the 1.1600 threshold, it is poised to test the 1.1800 resistance zone. Conversely, a false breakout followed by a retracement below 1.1500 would warrant caution, as it may signal a attenuation of bullish momentum and potential reversal risks.
Humans need to breathe, and perfect trading is like breathing—maintaining flexibility without needing to trade every market swing. The secret to profitable trading lies in implementing simple rules: repeating simple tasks consistently and enforcing them strictly over the long term.
Eurusdshort

Today's EUR/USD Trend Analysis and Trading RecommendationsThe EUR/USD is trading at the upper end of its recent range, having hit an intraday high of around 1.1440 and remaining near that level. The US Dollar strengthened in the early session due to optimism about the easing of Sino-US trade tensions, but later declined as European stocks fluctuated. Technically, the daily chart shows bulls remain in control, with the 20-day SMA rising gently at 1.1330. In the short term, the pair is range-bound around the 20-day SMA, yet to confirm a bullish breakout, while the 100-day and 200-day SMAs support the overall upward trend.
EUR/USD
buy@1.14200-1.14300
tp:1.14600-1.14900

EURUSD SHORT FORECAST Q2 W24 D10 Y25EURUSD SHORT FORECAST Q2 W24 D10 Y25
Professional Risk Managers👋
Welcome back to another FRGNT chart update📈
Diving into some Forex setups using predominantly higher time frame order blocks alongside confirmation breaks of structure.
Let’s see what price action is telling us today!
💡Here are some trade confluences📝
✅Weekly order block
✅15' order block
✅4 hour order block
✅Tokyo ranges to be filled
🔑 Remember, to participate in trading comes always with a degree of risk, therefore as professional risk managers it remains vital that we stick to our risk management plan as well as our trading strategies.
📈The rest, we leave to the balance of probabilities.
💡Fail to plan. Plan to fail.
🏆It has always been that simple.
❤️Good luck with your trading journey, I shall see you at the very top.
🎯Trade consistent, FRGNT X

The euro is in high - level oscillation.The euro has rebounded slightly against the US dollar, trading around 1.143 during the European session, recovering some of the losses from last week's decline from around 1.1500. Fundamentally, the US dollar weakened after taking profits from the strong non - farm payrolls data last Friday, while the hawkish remarks by European Central Bank Governing Council member Kazimir provided support for the euro. From the perspective of market structure, the short - term market sentiment is slightly bullish. The key resistance levels are concentrated in the 1.1494 - 1.1500 area. If this platform is broken through and held, it may form a new bullish breakout point.
Humans need to breathe, and perfect trading is like breathing—maintaining flexibility without needing to trade every market swing. The secret to profitable trading lies in implementing simple rules: repeating simple tasks consistently and enforcing them strictly over the long term.

EUR/USD Best Place To Sell To Get 250 Pips , Don`t Miss It !Here is my EUR/USD Analysis and if you check the chart you will see that we have avery strong res area forced the price to go down hard last time , so i will sell this pair from the same res area , it will force the price to go down hard at least 250 pips , waiting the price to touch it and then we can sell it .

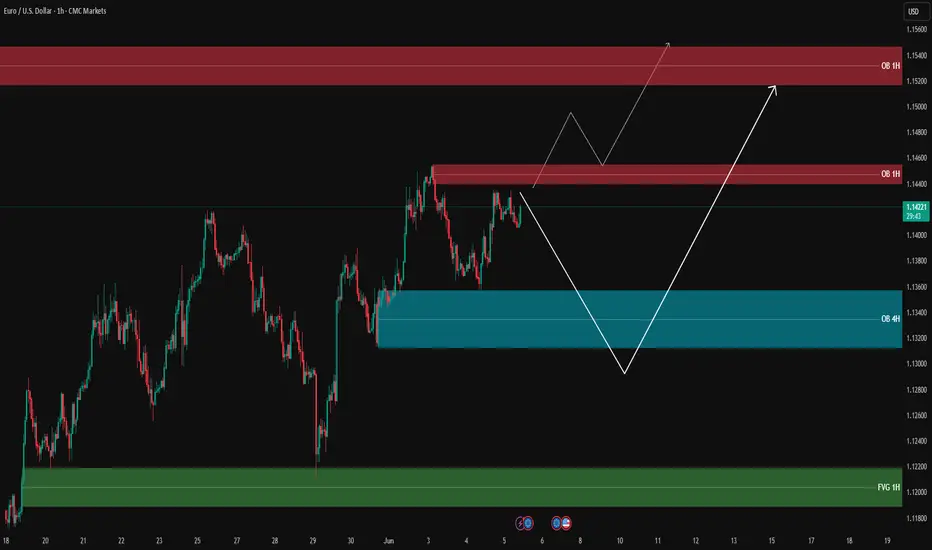
EUR/USD Analysis – Possible Scenarios🔹 Price is currently trading around 1.1421, consolidating between key supply and demand zones.
🔴 Supply Zone (Order Block 1H): 1.14360 – 1.14590
📌 Strong bearish reaction from this resistance area. First scenario: rejection from this OB and a move downward.
🔵 Demand Zone (Order Block 4H): 1.13050 – 1.13430
✅ If price fails to break the resistance, we could see a retracement to this OB. Bullish reaction here may offer long opportunities.
🟢 Fair Value Gap (FVG 1H): 1.11800 – 1.12220
📉 If OB 4H fails to hold, price could drop into this FVG area – a high-liquidity zone for potential reversal.
📊 Possible Scenarios:
1️⃣ Break and hold above OB 1H → price may extend toward next OB zone at 1.15150 – 1.15400
2️⃣ Rejection from OB 1H → pullback to OB 4H → possible long setup if confirmed
3️⃣ Break below OB 4H → deeper move into FVG 1H
‼️ Avoid premature entries – wait for valid confirmations.
🔍 Insight by ProfitaminFX
If this outlook aligns with your bias, or if you see it differently, feel free to share your perspective in the comments. Let’s grow together 📈
SHORT | EUR/USD | 1DMacro: Dollar strength likely as uncertainty grows from USD economic data; ECB expected to trim dovish tone next week.
Structure: In consolidation after reaching envelope top (~1.1494); forecasting downside to 1.1387–1.1400.
Trigger & Execution:
• Entry: Short on break below 1.1380
• Stop: 1.14678
• Target: 1.12344
• R:R: ~1:2.36
Rationale: Profit-taking above envelope top supports pullback; structural risk limit remains.

EURUSD - Look for Short (SWING) 1:2.5!Price has formed an ascending channel on the higher time frame, currently consolidating before potentially entering a distribution phase. A breakout could occur in either direction, but if the chart pattern plays out as expected, we may see a break below the key support level. Let’s aim for at least TP1.
Disclaimer:
This is simply my personal technical analysis, and you're free to consider it as a reference or disregard it. No obligation! Emphasizing the importance of proper risk management—it can make a significant difference. Wishing you a successful and happy trading experience!

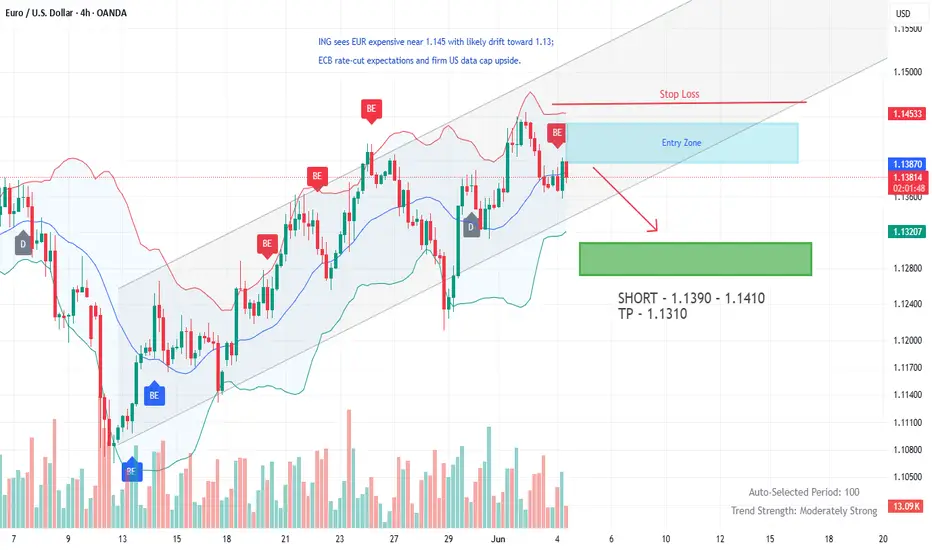
EUR/USD Short IdeaEUR/USD Short Idea [ /b]
ING sees EUR expensive near 1.145 with likely drift toward 1.13; ECB rate‑cut expectations and firm US data cap upside.
Softer euro-area CPI and tomorrow’s ECB meeting keep rate-cut
expectations alive, capping EUR/USD rallies.
Lingering tariff tension, diverging central-bank paths and
well-defined chart levels combine to drive the current high-conviction plays:
euro softness after a below-target CPI print and Thursday’s looming ECB rate
cut meet still-solid U-S data, making EUR/USD ripe for a fade from 1.14.
SHORT ON EUR/USDEUR/USD has just swept a previous high and has plenty of liquidity to the downside to capture.
I will be selling EU to the next swing low looking to catch 80-100 pips.

EUR/USD Update: Bullish Outlook Towards 1.14190 and BeyondHi Everyone,
As we projected in our analysis last week, EUR/USD corrected throughout the week and approached a retest of the 1.12000 level.
We expect the price to potentially retest 1.12000 and confirm it as support before advancing further to challenge the May 26 high of 1.14190. This would further reinforce our outlook for a potential long-term bullish trend.
Of course, the price could also challenge the 1.14190 high without a second retracement, should there be strong buying pressure early in the week. A successful breach of this level would likely drive the price higher towards the 1.15240 level.
We will provide further updates on the expected path for EUR/USD should the price reach this target.
The longer-term outlook remains bullish, with expectations for the rally to extend toward the 1.2000 level, provided the price holds above the key support at 1.10649.
We will continue to update you throughout the week with how we’re managing our active ideas and positions. Thanks again for all the likes/boosts, comments and follows — we appreciate the support!
All the best for the week ahead. Trade safe.
BluetonaFX

The range of 1.12-1.14 becomes an "arena"!The EUR/USD exhibited a narrow trading range on the last trading day of this week, with market focus in the evening centered on the upcoming release of the U.S. April core Personal Consumption Expenditures (PCE) price index data, one of the Federal Reserve's most closely watched inflation indicators. Recently, the U.S. dollar has remained strong amid the Fed's hawkish stance and risk aversion triggered by tariff rhetoric, while the euro has shown some resilience but lacks a clear direction amid a mix of fundamental and technical factors.
Looking ahead, the trajectory of EUR/USD will largely depend on the upcoming U.S. core PCE data and market repricing of Fed policy. If the PCE data meets expectations (month-on-month 0.1%, year-on-year 2.5%), the euro is likely to continue oscillating within the range of 1.1270 to 1.1435, with limited short-term potential to break above the upper Bollinger Band at 1.1435. If the data surprises on the upside, the U.S. dollar could strengthen further, and the euro may test support levels at 1.1200 or even 1.1108. Conversely, if the data is weak, market expectations for a July rate cut by the Fed may intensify, and the euro could challenge resistance at 1.1400 and higher levels.
Humans need to breathe, and perfect trading is like breathing—maintaining flexibility without needing to trade every market swing. The secret to profitable trading lies in implementing simple rules: repeating simple tasks consistently and enforcing them strictly over the long term.

EURUSD 4H ELLIOTT WAVE COUNT – DOWNSIDE TARGET CONFIRMED!Good Morning, Traders,
I’m sharing my wave analysis for EURUSD with you. After completing its first five waves, it formed the A-B wave and is now expected to move into the C wave.
The target level for the C wave is currently 1.11838.
I meticulously prepare these analyses for you, and I sincerely appreciate your support through likes. Every like from you is my biggest motivation to continue sharing my analyses.
I’m truly grateful for each of you—love to all my followers

SHORT ON EUR/USDEUR/USD has pulled back to a major supply zone that previously formed a DOUBLE TOP in that area in the past. (This is technically the re-test)
I have placed a sell limit order in the supply area and I will be expecting EUR/USD to fall past the swing low for over 100 -150 pips.

EURUSD Analysis - Waiting for movement
EURUSD has broken above the 1H resistance and has retested it, which is now acting as temporary support.
🔄 If price starts ranging around this level, we could see a short-term bearish move of a few dozen pips, targeting the buy-side liquidity and unfilled orders highlighted on the chart.
📈 However, if price gains bullish momentum from here, there's a potential for a 100-pip upward move.
We’re currently watching how price interacts with the supply and demand zones, to align our entries with it on the lower timeframes.
🔍 Insight by ProfitaminFX
If this outlook aligns with your bias, or if you see it differently, feel free to share your perspective in the comments. Let’s grow together 📈


EURUSD - SHORT PREDICTION - MONDAY, 26TH MAY 2025A pullback appears to be underway, following a sweep of inducement around the 15-minute level at 1.13900—marking our first significant Change of Character (CHoCH). This shift aligns with the broader narrative from the 1-hour timeframe, suggesting the potential for a deeper retracement into the extreme 1H order block.
With the current price trading around 1.13777, we anticipate a move back up to the 1.14078 level. This area is of interest for initiating short positions, in line with the ongoing correction.
Our first take-profit target is set at 1.13368, where we expect an initial reaction. Should bearish momentum continue, we foresee price extending lower to sweep the previous daily low at 1.12771 and potentially tapping into the daily external order block at 1.12664.
From there, we’ll closely monitor price behavior. If bullish intent begins to form, we’ll assess the potential for long setups targeting a move back toward the weekly high at 1.14190.

EUR/USD Rising Wedge Breakdown – Bearish Opportunity in Sight🔍 Technical Breakdown
🟦 1. Rising Wedge Pattern (Bearish)
The price has been moving within a tightening upward channel — forming higher highs and higher lows, but with decreasing momentum. This is a typical Rising Wedge, a pattern that signals exhaustion in an uptrend and typically resolves to the downside.
The pattern formed over several days.
Volume has been declining as the price pushed higher — a classic sign of weakening trend strength.
🚨 2. Major Resistance Zone
The wedge culminated near a major historical resistance zone (around 1.1400), which price failed to break multiple times — showing strong seller presence. This adds confluence to the bearish breakdown.
📉 3. Breakdown & Retest
Price broke below the lower wedge trendline, confirming the bearish reversal. After the breakdown, the pair appears to be retesting the previous support line — now acting as new resistance.
This retest is crucial — a successful rejection here typically confirms the breakdown and provides an ideal entry point for short positions.
⚡ Volume Clues
Note the "Volume Burst" earlier in the chart, followed by a sharp move up. But that rally was unsustainable — buyers couldn’t hold above resistance, and volume has since faded. This volume exhaustion is further evidence that bullish momentum is weakening.
🔄 Key Support Zones Below
Around 1.1200: A strong SR flip zone (support-turned-resistance), which could act as temporary support.
Final Bearish Target: Around 1.1070, a strong demand zone where price previously consolidated before the last bullish run.
This is the measured move target from the wedge height applied to the breakdown point.
🧠 Why This Matters (Trader Insight)
This setup combines:
A reliable bearish pattern (rising wedge)
Key horizontal resistance
A volume drop
A clean retest structure
That makes it a high-confluence short trade idea. These patterns don't always play out immediately, but when they do, they often drop hard.
📌 Trade Setup Summary
Bias: Bearish
Pattern : Rising Wedge (broken)
Current Action: Retesting the broken wedge
Entry Zone: 1.135–1.138 (retest confirmation)
First Target: 1.1200 (SR Flip)
Final Target: 1.1070 (Demand Zone)
Invalidation: Break and hold above 1.1410

EURUSD – 1H Update on Our Previous EURUSD Post +60 PipsAs expected from our last idea, price reacted well to our 1H Order Block zones.
🔹 Upon receiving bullish confirmation on the 3-minute timeframe, we entered a long position, which has now moved 60 pips in our favor.
📍 Current Setup:
Price is now at a decision point – around yesterday’s high (PDH) and the 1H supply (OB).
✅ If price breaks above PDH (dashed yellow line), it could lead to a clean break of the 1H resistance and continuation to the upside.
🚫 However, if bullish momentum weakens, there’s a real chance price may pull back to collect buy-side liquidity in the blue and green demand boxes below.
⚠️ It’s Friday – trade with caution!
Late-week volatility and false spikes are common before weekly close.
🔍 Insight by ProfitaminFX
If this outlook aligns with your bias, or if you see it differently, feel free to share your perspective in the comments. Let’s grow together 📈

EURUSD SELL/SHORTBy utilizing levels, historical patterns, , we can formulate a hypothesis that the market might follow a similar trajectory if bearish sentiment prevails.

EUR/USD Short Opportunity – Rising Wedge + Retest + TargetThis technical setup on EUR/USD (1H timeframe) highlights a potential high-probability short opportunity based on a combination of price action, chart patterns, and key structural levels. The pair is showing signs of weakening bullish momentum and preparing for a bearish continuation.
🔎 1. Pattern Analysis: Rising Wedge Formation
The primary pattern visible is a Rising Wedge, which is traditionally a bearish reversal formation. It’s defined by:
Higher highs and higher lows, but both trendlines are converging, suggesting weakening bullish control.
Volume (not shown here) typically decreases within a rising wedge, further confirming a potential breakout.
This wedge formed after a previous sharp bullish recovery, acting as a continuation structure that often reverses.
In this case, the price formed multiple touches on both wedge boundaries, enhancing the reliability of the pattern.
🧱 2. Key Structural Zones:
Minor Resistance Zone (~1.1270–1.1285):
Clearly marked on the chart with a blue shaded zone.
Price has reacted from this level multiple times, validating it as a supply area.
The most recent attempt to break above this level failed, further confirming seller dominance.
Consolidation Zone (highlighted in yellow):
Prior to the wedge’s formation, price entered a consolidation phase.
Consolidation often precedes a breakout or a trend reversal. In this case, it provided a base for the rally that formed the wedge.
🔁 3. Breakout and Retest:
Price has broken below the lower support line of the rising wedge.
This breakout is a bearish signal and suggests the pair may now be ready for a stronger downside move.
The price appears to be retesting the broken wedge support, which is a classic confirmation move before continuation.
Retests of broken structures often offer low-risk, high-reward entry opportunities.
🎯 4. Trade Plan and Setup:
Entry Zone: Watch for bearish rejection or candle confirmation on the retest of the wedge support turned resistance.
Stop Loss (SL): Positioned just above the resistance zone, at 1.12887, protecting the trade against false breakouts or reversals.
Take Profit Levels:
TP1 – 1.10649: This level is a strong support zone based on previous price action and structural significance.
TP2 – 1.09670: The full measured move from the height of the wedge. This also aligns with historical support and psychological round number proximity (1.10).
🧠 5. Confluence Factors:
Technical Pattern: Rising wedge = bearish.
Support/Resistance: Multiple reactions to both the resistance zone and wedge trendlines confirm market memory.
Price Action: Break + retest = ideal entry confirmation.
Risk-Reward Ratio: Favorable, especially with conservative TP1 and aggressive TP2 levels.
Macro Context (optional): If posted during news week – potential USD strength based on rate expectations, NFP, or inflation.
⚠️ 6. Risk Management Tips:
Use a position size that aligns with your account risk tolerance (1–2% rule).
Wait for confirmation (bearish engulfing candle or rejection wick) before entering.
Always be prepared for invalidation. If price closes above the resistance zone, this idea is voided.

EURUSD SHORT FORECAST Q2 W21 D20 Y25EURUSD SHORT FORECAST Q2 W21 D20 Y25
Professional Risk Managers👋
Welcome back to another FRGNT chart update📈
Diving into some Forex setups using predominantly higher time frame order blocks alongside confirmation breaks of structure.
Let’s see what price action is telling us today!
💡Here are some trade confluences📝
✅Weekly order block rejection
✅4H 50 EMA
✅Intraday 15' order blocks
✅Tokyo ranges to be filled
🔑 Remember, to participate in trading comes always with a degree of risk, therefore as professional risk managers it remains vital that we stick to our risk management plan as well as our trading strategies.
📈The rest, we leave to the balance of probabilities.
💡Fail to plan. Plan to fail.
🏆It has always been that simple.
❤️Good luck with your trading journey, I shall see you at the very top.
🎯Trade consistent, FRGNT X

SHORT ON EUR/USDEUR/USD is in a overall uptrend.
I'm just looking to catch the pullback as we continue to make downtrend market structure on the pullback itself.
Looking to catch 200-400 pips to the downside.
