What to do after you missed a big price move (Example: EUR/USD)There was a big fast move in EUR/USD last week.
The ‘European currencies’ did especially well versus the US dollar, including GBP/USD and USD/CHF as well as the ‘Skandies’ SEK/USD and NOK/USD.
If you rode the move, then job done. If you did ride the move up, you might have taken full profits already - or maybe you are leaving a little bit of the position open to ride any continuation of the move.
But, what to do if you missed it completely?
Explosive moves in the market usually mean traders who were on the ‘losing’ side step out for a while, having lost confidence in their view. For example if you were bearish and the market makes a significant move higher - you’re probably going to be a lot less confident in your bearish view - but perhaps also not ready to take an opposite bullish view. The loss of sellers in the market can see the up-move continue with minimal pullback.
This might suggest buying any small dips to ride the next leg higher, and emotionally it would offer some salvation to capture the second leg of the move even if you missed the first leg. However, what you are doing here is ‘chasing the market’.
One trouble is that after a big move in the market, there is no definitive place to put your stop loss, except at the beginning of the move - which is now far away. That's a bad risk: reward.
It is tempting to place a closer (more manageable) stop loss under lower timeframe levels of support - but then you find yourself trading an unknown strategy that requires different rules to follow because it is based on a lower timeframe.
And indeed, after a sharp move in the market - there is still a chance for a sharp pullback to match. Why? Because buyers quickly take profits on their unexpected quick gains, which will create selling pressure into minimal support - because the next support level is far away.
A sharp pullback would mean an opportunity to buy into the uptrend at a lower level, closer to the previous support. But then the flipside of the sharp pullback is that it raises questions over the sustainability of the initial move.
Probably the biggest takeaway here is not to think about this ‘explosive’ move in isolation.
Instead of forcing a trade, consider:
1. Waiting for the right setup in the same market. If your strategy is based on structured breakouts, wait for the next clean consolidation or pattern before re-engaging. A big move often leads to a new setup—but forcing a trade in the middle of a volatile move isn’t a strategy, it’s FOMO.
2. Looking at uncorrelated markets. Just because EUR/USD already made a big move doesn’t mean you have to trade it now. If you want to be in at the start of a move, shift focus to another market that hasn’t yet made its move.
3. Sticking to your edge. If your strategy works over hundreds of trades, don’t abandon it just because one market moved without you. The next opportunity will come—if not in this market, then in another.
Again, the best trades don’t come from reacting to what already happened, but from positioning for what’s about to happen. If you missed the move, accept it, reset, and wait for the next high-quality setup—whether in the same market or somewhere else.
Eurusdshort

EURUSD IDEA : SHORTS | SELL (07/03/25)This is a theory. I believe price on the weekly is clearly over extended. With the NFP incoming, it may seek to fall from here especially with a clear setup occurring on the W TF. I believe price to be bearish at this point, having interacted on the weekly POI - Please look at the charting before making any decisions, and let me know what you think of it.
N.B.: This is not financial advice. Trade safely and with caution.

EURUSD Approaching Key Resistance – Will Sellers Step In?OANDA:EURUSD is approaching a significant resistance zone, highlighted by previous price reactions and strong selling interest. This area has historically acted as a supply zone, where sellers have stepped in, leading to notable price reversals. The current price action suggests a potential bearish reaction if the resistance holds.
If sellers maintain control, we could see a decline toward the 1.03940 level, which represents a logical target based on the current market structure. Confirmation signals—such as a bearish engulfing candle, rejection wick, or increased selling volume—would strengthen the bearish outlook.
However, if the price breaks above this resistance zone and sustains momentum, the bearish outlook may be invalidated, signaling a potential shift in favor of buyers.
Monitoring how price reacts to this zone is crucial for identifying entry opportunities. As always, applying proper risk management is essential given the potential for volatility.
Just my take on support and resistance zones—not financial advice. Always confirm your setups and trade with solid risk management.
Best of luck!

EUR/USD: Is History Repeating? Key Levels to Watch NowHey Realistic Traders, Will FX:EURUSD Repeat its Bearish Cycle? Let’s dive into the analysis...
On the H4 chart, EUR/USD is trading below the 200-day EMA once again, signaling that the bearish trend is still in play. This downward movement has been reinforced by a rising wedge breakout, a common pattern that often leads to further declines.
Just a few days ago, we spotted a similar bearish breakout in FX:EURUSD , which resulted in a continued drop. As traders, we follow the Dow Theory principle: "History Repeats Itself ." Based on this idea, we expect the price to follow the same pattern, keeping the bearish momentum intact.
Looking ahead, EUR/USD could move lower toward the first target at 1.02861 and, if selling pressure continues, potentially reach the second target at 1.02205. These targets are based on previous price movements and key historical support levels.
However, this bearish scenario depends on the price staying below the critical stop-loss level at Stop Loss 1.05039
Support the channel by engaging with the content, using the rocket button, and sharing your opinions in the comments below.
Disclaimer: “Please note that this analysis is solely for educational purposes and should not be considered a recommendation to take a long or short position on FX:EURUSD ”.

Fri 28th Feb 2025 EUR/USD Daily Forex Chart Sell SetupGood morning fellow traders. On my Daily Forex charts using the High Probability & Divergence trading methods from my books, I have identified a new trade setup this morning. As usual, you can read my notes on the chart for my thoughts on this setup. The trade being a EUR/USD Sell. Enjoy the day all. Cheers. Jim

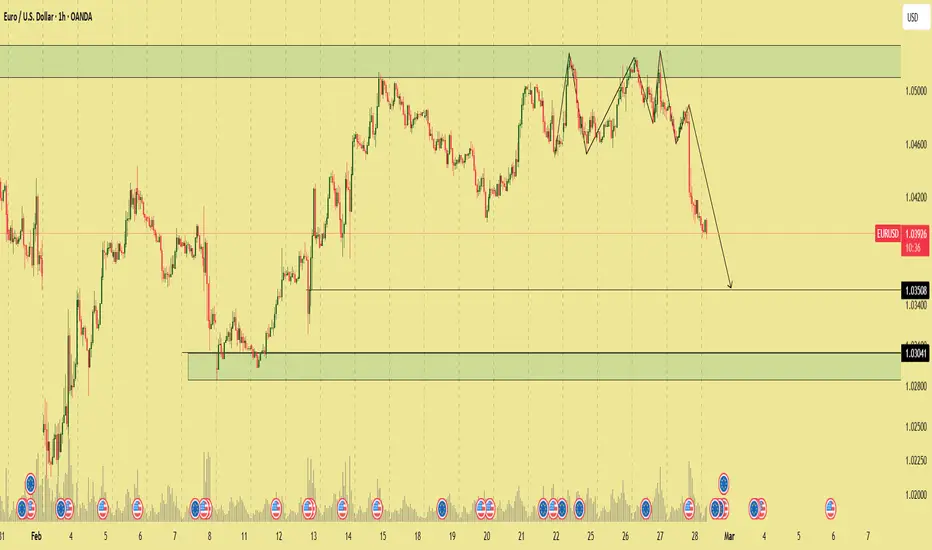
EUR/USD confirms the downtrend.EUR/USD confirms the downtrend.
Current targets are 1.03508 and 1.03041
where the previous strong buying pressure was concentrated.
Wait to sell until the target is reached
#EURUSD
EUR/USD - H1- Chart - Ascending Triangle (27.02.2025) The EUR/USD Pair on the H1 timeframe presents a Potential Selling Opportunity due to a recent Formation of a Triangle Breakout Pattern. This suggests a shift in momentum towards the downside in the coming hours.
Possible Short Trade:
Entry: Consider Entering A Short Position around Trendline Of The Pattern.
Target Levels:
1st Support – 1.0433
2nd Support – 1.0405
🎁 Please hit the like button and
🎁 Leave a comment to support for My Post !
Your likes and comments are incredibly motivating and will encourage me to share more analysis with you.
Best Regards, KABHI_TA_TRADING
Thank you.

EUR/USD at a Crossroads: Will Trade Tensions Push It Lower? EUR/USD has been struggling to maintain momentum above the 1.0500 mark, facing renewed selling pressure as macroeconomic and geopolitical factors influence sentiment. With the US Dollar regaining strength and concerns about European economic stagnation growing, the pair remains vulnerable to further downside.
Technical Analysis:
Resistance Levels: 1.0532 (January 27 high), 1.0629 (December peak), 1.0744 (200-day SMA).
Support Levels: 1.0405 (55-day SMA), 1.0282 (February 10 low), 1.0209 (February 3 low), and 1.0176 (January 13 YTD low).
Indicators: The Relative Strength Index (RSI) is near 55, indicating modest momentum, while the Average Directional Index (ADX) remains around 15, suggesting a weakening trend.
Moving Averages: The 200-day SMA at 1.0744 serves as a key dynamic resistance, while the 55-day SMA at 1.0405 acts as interim support.
Fundamental Analysis:
Several key fundamental factors are exerting downward pressure on EUR/USD:
Trade Policy Uncertainty: While US tariff tensions have temporarily eased, lingering trade disputes, including a 10% duty on Chinese imports and potential EU-targeted tariffs, keep investors cautious.
Diverging Central Bank Policies: The Federal Reserve remains firm on keeping interest rates elevated, while the European Central Bank has begun rate cuts, signaling weaker economic confidence in the Eurozone.
Economic Growth Divergence: The US economy continues to show resilience with robust labor markets and stable inflation, while the Eurozone faces stagnation and potential contraction, particularly in Germany.
European Political Risks: Uncertainty in Germany and wider Eurozone economic struggles add to the Euro’s bearish outlook, making it less attractive compared to the US Dollar.
The EUR/USD pair is at a critical juncture, with key support levels in focus. Trade policies, central bank divergence, and economic growth disparities continue to drive market sentiment. This week is pivotal for the Eurozone, with key economic data releases culminating in Friday’s PMI figures, which could determine the pair’s next major move. Traders should remain cautious and closely monitor both technical and fundamental developments.
Note: Please remember to adjust this trade idea according to your individual trading conditions, including position size, broker-specific price variations, and any relevant external factors. Every trader’s situation is unique, so it’s crucial to tailor your approach to your own risk tolerance and market environment.

Euro / U.S. Dollar
Hello Dear Traders
Euro Analysis
Based on the DXY analysis, which is bullish, I present to you the updated analysis for the Euro. I have identified the suitable selling area on the 1-hour timeframe. We are in a downward structure on the 4-hour timeframe, while the minor 1-hour chart is bullish. By obtaining confirmation from the 1-hour chart—validated by breaking the CHoCH—we can utilize this area of the Secret Order Block (1H) for entering a sell position.
Again, in the selling area, a 5-minute confirmation can help us optimize our entry into the trade.
First Support: 1.04494
1-Hour Liquidity: 1.03731
Potential Suitable Buying Area: 1.02720, which I will update once the price reaches this level.
Thank you for your support and companionship, dear friends.
Wishing you all success!
Fereydoon Bahrami
A retail trader in the Wall Street Trading Centre (Forex)
Risk Disclosure:
Trading in the Forex market is risky due to high price volatility. This analysis is solely my personal opinion and should not be considered financial advice. Please do your own research. You are responsible for any profits or losses resulting from this analysis.

EURUSD ShortNice corrective short possibility, before another impulse high, with 40 pip target 7 pip sl

EUR/USD - High-Probability Short Setup! Are we going lower?EUR/USD - This trade is based on a bearish retracement rejection from a key Fair Value Gap (FVG), targeting a strong confluence area where Fibonacci levels and volume profile data align.
🔹 Entry Criteria:
Price has tapped into a Fair Value Gap (FVG) twice, showing signs of rejection.
The green zone represents an imbalance where sellers previously stepped in, making it an ideal short entry area.
Look for bearish confirmation, such as wicks, bearish engulfing candles, or lower timeframe breakdowns before executing the trade.
🔹 Target (Take Profit - TP):
The primary target is the 0.618 - 0.65 Fibonacci retracement zone (Golden Pocket), a strong level where price often reverses.
This level aligns with the Point of Control (POC) from the volume profile tool, adding further confluence.
🔹 Stop-Loss & Invalidation:
Stop-loss should be placed above the last high near the FVG zone to protect against invalidation.
If price closes above the FVG zone, the trade setup becomes invalid, as it would indicate bullish strength and a possible continuation higher.
🔹 Additional Considerations:
Price is likely seeking sell-side liquidity below previous lows, supporting the downside move.
Market conditions and potential fundamental catalysts (news events) should be monitored before entry.
📌 Summary:
This trade idea involves shorting from a key imbalance zone (FVG), expecting price to fill the gap and move toward a high-probability support area at the Golden Pocket + POC confluence zone. However, if price closes above the FVG, the trade setup is invalidated, signaling a potential bullish continuation. 🚀
__________________________________________
Thanks for your support!
If you found this idea helpful or learned something new, drop a like 🙌 and leave a comment—I’d love to hear your thoughts! 🚀
Make sure to follow me for more price action insights, free indicators, and trading strategies. Let’s grow and trade smarter together!📈

EURUSD ShortHave some short with low SL high reward, if it breaks out above i willl start changing my bias and look for long opportunities

EUR/USD Wedge Breakout (17.2.25)The EUR/USD Pair on the M30 timeframe presents a Potential Selling Opportunity due to a recent Formation of a Wedge Breakout Pattern. This suggests a shift in momentum towards the downside in the coming hours.
Possible Short Trade:
Entry: Consider Entering A Short Position around Trendline Of The Pattern.
Target Levels:
1st Support – 1.0413
2nd Support – 1.0375
🎁 Please hit the like button and
🎁 Leave a comment to support for My Post !
Your likes and comments are incredibly motivating and will encourage me to share more analysis with you.
Best Regards, KABHI_TA_TRADING
Thank you.


EURUSDEUR/USD has faced strong rejection from the 1.04400 resistance level in the H1 timeframe, signaling a possible downside move. If bearish momentum continues, the price may decline towards the following key levels:
📉 Target 1: 1.03950
📉 Target 2: 1.03500
🔹 Stop Loss: 1.04700 (to limit potential losses in case of reversal)

Scenario on EURUSD 12.2.2025On the EURUSD market, I would see the following scenarios. I think that if a floor were to be established, then the sfp at the price of 1.02424 should follow, from here the price could rebound upwards. If the market does not react to this level, then we have the last option and that is the sfp at the price of 1.01958. Then we only have the monthly level, which if it does not hold, I would look for an entry into the long until somewhere below this level, otherwise I see short positions first around the price 1.04650 and then around the monthly level at the price of 1.05795.

Strong Sell on EURUSD starting from today. Strong Sell on EURUSD as $$$ is getting its strength back. Enjoy the swing trade on EURUSD

BEARISH SWING SETUP ON EU The last setup I posted was bullish and did give a good reaction that I took as confirmation however the trade did not play out. This then caused a bearish choch on the daily and price has since pulled back and is now showing bearish structure.
Both swing and internal structure on the 4H timeframe and above are bearish so that is the direction I'm following right now.
Fractal structure on the 4H is currently bearish and I will continue trading in that direction targeting January's low.

EUR/USD - Potential short if price moves to resistanceClear market structure where we see support and resistance respecting price at 1.03500. That can also clearly be seen at 4h chart.
Price is forming lower lows and lower highs
1h 50ema also closing in at 1.03500 + Pivot


EURUSD Analysis for ShortsWe have a strong resistance level on daily and 4H time frame
expecting a drop from the range drawn

EURUSDHello
The trend in the dollar is completely bullish in the high times.
Be sure to see confirmation to get TB...
I emphasize that it needs confirmation!

EURUSD ShortA short bias on EUR/USD suggests that you anticipate the euro weakening against the U.S. dollar. 5 pip SL target a nice 30 pips, possible play out
